HelenP. I Euro will drop to trend line, after movement upHi folks today I'm prepared for you Euro analytics. If we look at the chart, we can see that EURUSD has been moving in a stable upward trend, supported by a clear ascending trend line. Each time the price approached this line, it rebounded and continued to grow, respecting the bullish structure. After the recent breakout from the support zone around 1.1500, the market made a strong impulse to the upside and reached a local high. Now, the momentum seems to be slowing down, which opens the possibility for a corrective movement. Given this setup, I expect that the price could first make a small upward push to trap late buyers, and then turn around to begin a decline. The trend line remains a critical technical level, and I anticipate the price will revisit it soon. For this reason, I’ve placed my goal at 1.1575 points — this area aligns with the trend line and can serve as the next support if a pullback occurs. As long as this level holds, the market remains in a bullish structure, but a correction seems likely before further growth. If you like my analytics you may support me with your like/comment.
Disclaimer: As part of ThinkMarkets’ Influencer Program, I am sponsored to share and publish their charts in my analysis.
Analysis

XAUUSD D1 Forecast: Gold at Pivotal 325x Support What's Next for the Yellow Metal?
Today, we're zooming out to examine the broader picture for Gold (XAUUSD) on the Daily (D1) timeframe. Our latest analysis indicates that Gold has encountered a very strong, critical support level around the 325x region. This is a pivotal point that could significantly influence Gold's medium to long-term direction!
🌍 Macroeconomic Landscape: The Underlying Forces Influencing Gold
While we've observed a degree of USD weakness stemming from speculations around the Federal Reserve (such as the rumours regarding Jerome Powell's replacement) and expectations of interest rate cuts, these factors haven't fully countered Gold's recent decline on the daily chart. Furthermore, the sustained ceasefire between Israel and Iran continues to temper Gold's appeal as a safe-haven asset.
Nevertheless, the current price action at the robust 325x support level presents a significant technical signal. The impact of forthcoming US macroeconomic data (particularly the PCE Price Index on Friday) and speeches from FOMC members will be crucial in confirming or negating our projected movements for Gold. Should positive news for Gold align with this support holding, it could act as a potent catalyst.
📊 XAUUSD D1 Technical Analysis: Projecting Gold's Next Move
Given that Gold has reached strong support at 325x, we can anticipate the following scenarios:
Bounce from 325x (Potential Upside Phase):
If the 325x area (which reinforces the 3264.400 support from image_e9d325.png) holds firm, we expect a strong reaction and an upward move for Gold.
The initial target for this bounce would be the 332x region, aligning with resistance levels 3313.737 - 3330.483 from our previous analysis. On a broader timeframe (as illustrated in image_83845c.png), this corresponds to the resistance zone around 3326.022. This 332x area might represent a continuation pattern, suggesting it could be a corrective rally before the resumption of the larger trend.
Resumption of Downtrend (After Reaching 332x):
Once Gold reaches and tests the 332x zone (3313.737 - 3330.483 / 3326.022) and exhibits bearish confirmation signals (e.g., a strong bearish engulfing candle, a pin bar, or a clear top formation), we anticipate a resumption of the downward movement.
The next major target for this decline would be the 317x area, which correlates well with the strong support at 3173.052 on the larger timeframe (as depicted in image_83845c.png).
🎯 XAUUSD D1 Trading Plan: Your Long-Term Strategy Ahead!
Considering the current D1 analysis, here's our actionable plan:
1. BUY PHASE (Bounce from Support):
Entry: Observe price reaction in the 325x - 326x zone (specifically 3264.400). Only consider buying if there are clear bullish confirmations (e.g., a confirmed bullish pattern on the daily or 4-hour candle, a strong bounce from the zone with significant volume).
SL (Stop Loss): Position just below the 325x support zone (e.g., 3245-3240, depending on confirmation).
TP (Take Profit): 3280 - 3284 - 3290 - 3295 - 3300 - 3305 - 3310 - 3313.737 - 3320 - 3326.022 (key 332x zone). This will be our primary target for the potential bounce.
2. SELL PHASE (Downtrend Resumption):
Entry: Once the price reaches and tests the 332x zone (3313.737 - 3330.483 / 3326.022) and shows bearish confirmation signals (e.g., a strong bearish engulfing, pin bar, or clear top formation).
SL (Stop Loss): Position slightly above the 332x zone (e.g., 3335-3340).
TP (Take Profit): 3326 - 3320 - 3316 - 3310 - 3305 - 3300 - 3295 - 3290 - 3280 - 3200 - 3173.052 (final 317x target).

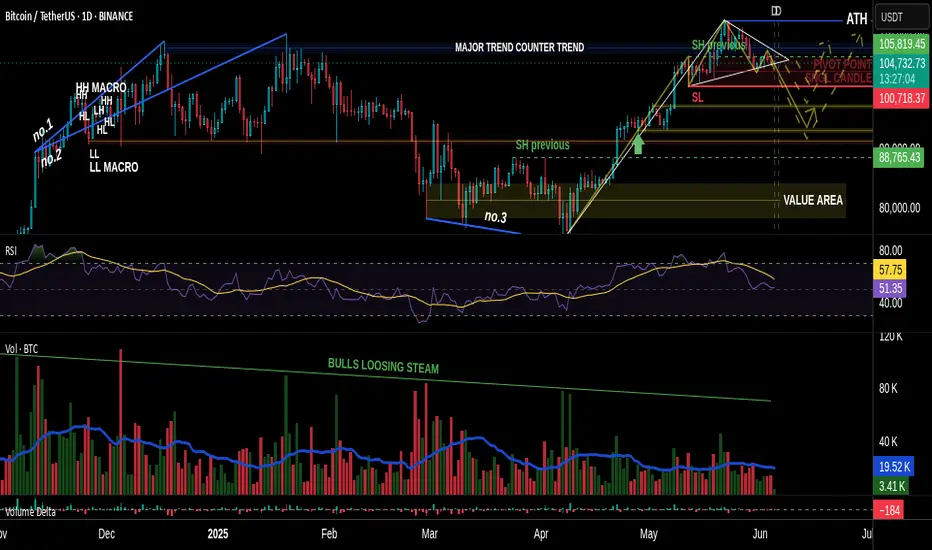
VSA vs BTC: Into a Bearish Scenario or Not?Predicting the market requires skill.
Most traders fail at one crucial point: they don’t see the market as a living, breathing organism—a structure where one move leads to another, like cause and effect in motion.
That’s what we often call reading the psychology of the market. When you begin to grasp the fundamental principles behind that, you step into the realm of elite traders.
And yes—Volume Spread Analysis (VSA) is a powerful tool, but only if you know how to read it properly.
I’m not a certified trader or financial advisor, and I don’t give signals, entries, or exits. I’m simply a solo observer, sharing a slice of what true technical and fundamental analysis looks like.
And yes—it takes time. It takes skills. Now, if we want to even attempt predicting the future of price action, we must understand something: A chart is not a single truth. It’s a battlefield of conflicting signals.
Patterns, marks, levels—some suggest bullish continuation, others hint at sharp reversals. Confusion is inevitable if you don’t learn to distinguish which signs matter.
In our current BTC chart, we’re witnessing this contradiction unfold clearly:
• A bullish flag formation...
• Yet within it, the emerging completion of a Head & Shoulders pattern!
How arrogant can the market be! 😄
A moment to laugh—but also a moment to observe how cleverly the crowd is misled.
This is classic manipulation, wrapped in a textbook setup.
But what’s most telling isn’t the pattern on the surface—it’s the volume beneath the structure.
It’s always the quiet details that speak the loudest.
Before price shows its true face, volume often leaves footprints. In our case, those footprints were already leading toward a bearish path—long before the structure began to shape itself clearly.
So while retail eyes focused on the bullish flag, the underlying volume had already begun withdrawing support.
Not aggressively—no. Subtly, almost elegantly, in that familiar way institutions mask intention:
• Spikes that don’t hold
• Buying that doesn’t follow through
• And a steady fade in commitment as price climbs into weakness
It’s in those quiet inconsistencies where VSA earns its value.
It tells us: the move isn’t about what’s obvious.
It’s about what never fully materialized.
So yes, the pattern may still remain incomplete. The Head & Shoulders may yet fail to validate.
But for those who were watching volume first—not structure—the script was already being written.
✒️ From now on, professionally speaking, we must still wait:
• For the Head & Shoulders to confirm or dissolve. So eyes targeted at the swing low level near 107k
• And for volume to either legitimize or invalidate the entire setup
Only then does the chart grant us permission to speak in certainties.
🐾 But so far…
• The clues have favored the bears.
• Sell opportunities appeared early and often—for those who know what to look for.
• Bullish spikes in volume? They were met with silence.
• Momentum fizzled under a macro backdrop of fading demand.
If you were in the right mindset, and aligned even the lower timeframes to basic structural zones,
you already saw the path ahead wasn’t being carved by the bulls.
Let them finish the patterns.
Let the candles paint the story.
But for those trained in volume, the ink has already dried.
And if you're still reading, maybe you already sense it—
real insight doesn’t shout, and it never floats in abundance.
Value has never been about noise. It’s about what’s rare, quiet, and overlooked by the crowd.
Just like in the markets—the true signals aren’t loud, and they’re never free in the economic sense.
Just as price rises where supply thins, the same applies here:
what’s scarce... holds weight.
PS For last A little exercise, something to grasp on. Have you noticed how Volume & RSI behaves in lower time frames? 4Hour or 1Hour for example. Can you identify how volume confirms a bearish move. Do you discover the correct correlation and combined use between VSA & RSI. Remember my previous insight
See you next time!
ARTY - Play-and-Earn Launch Poised to Ignite Rally Toward $1.80Hi guys, this is my overview for ARTYUSDT, feel free to check it and write your feedback in comments👊
After consolidating in a flat range between $0.36 and $0.74 for months, ARTY triggered a bullish breakout, climbing rapidly toward $1.83.
Following this surge, price corrected back to the $0.27–$0.36 support area, which absorbed selling pressure and formed a reliable accumulation base.
On June 30th, Artyfact will launch its inaugural Play-and-Earn mode, poised to attract hundreds of thousands of new users and significantly boost ARTY demand.
This upcoming catalyst underpins the bull case, reinforcing buyers’ confidence and justifying another leg higher from current levels near $1.62.
Key downside support remains at $1.00–$1.08, where any retracements could offer favorable long entries ahead of resumed uptrend momentum.
My three upside targets are $1.00 for the first level, $1.40 as intermediate resistance, and $1.80 near the previous all-time high.
If this post is useful to you, you can support me with like/boost and advice in comments❤️

HelenP. I Gold will rebound up from trend line to $3400 levelHi folks today I'm prepared for you Gold analytics. After looking at this chart, we can see how the price after a prolonged consolidation inside a large wedge pattern, XAUUSD, approached the ascending trend line again - this line has acted as a key support several times in the past. This time is no exception: the price reacted to it with a bullish bounce. We can see a confluence here — trend line support coincides with the lower boundary of the wedge and the local support zone at 3270 - 3250 points. Now the price is trading above this line, showing early signs of recovery. Given the symmetry of this structure and past behavior, I expect gold to continue rising from current levels. The nearest major obstacle lies in the resistance zone around 3400 - 3420, which acted as a turning point before. That’s why my current goal is set at the 3400 level. If bulls hold the trend line, we may see a steady move toward this key resistance. Given the trend line reaction, wedge structure, and current momentum, I remain bullish and expect further growth. If you like my analytics you may support me with your like/comment ❤️
Disclaimer: As part of ThinkMarkets’ Influencer Program, I am sponsored to share and publish their charts in my analysis.

XAUUSD: Gold's Muted Ascent Below $3350 XAUUSD: Gold's Muted Ascent Below $3350 – Navigating Key Levels Amidst USD Weakness!
Hello TradingView Community!
Let's delve into the intricate world of Gold (XAUUSD) today. The yellow metal is showing a subtle positive bias, largely influenced by a weaker US Dollar, yet a decisive bullish breakout above the $3350 mark remains elusive.
🌍 Macroeconomic Landscape: Forces Shaping Gold's Path
Gold has maintained a slight positive stance for the second consecutive day, but it's struggling to find significant follow-through, staying below the $3350 level in early European trading.
USD Under Pressure – A Tailwind for Gold: The primary driver for Gold's recent strength is the weakening US Dollar. Reports suggesting President Trump is considering replacing Fed Governor Jerome Powell have sparked concerns about the US central bank's future independence. This speculation has fueled market expectations for further Fed rate cuts this year, pushing the USD to its lowest point since March 2022, thereby providing support for non-yielding assets like Gold.
Cautious Outlook Prevails: Despite USD weakness, a definitive bullish trend for Gold is not yet confirmed. The ongoing ceasefire between Israel and Iran holds firm, with prevailing optimism limiting significant safe-haven rallies. This complex environment necessitates caution before confirming a definitive bottom for Gold or positioning for a substantial recovery from levels below $3300.
Key Data Ahead: Traders are keenly awaiting upcoming US macroeconomic data and speeches from FOMC members. These insights will be crucial in influencing XAU/USD, particularly ahead of Friday's pivotal US Personal Consumption Expenditures (PCE) Price Index release.
📊 XAUUSD Technical Outlook: Pinpointing Strategic Zones
Based on recent technical analysis (referencing image_e9d325.png for key levels), Gold is in a consolidation phase after a recent sharp decline, trading around the $329X mark. Price action below shorter-term moving averages suggests either lingering bearish pressure or an accumulation phase.
Strong Support Zones (Potential Buy Areas): Critical demand areas are identified around 3294.414, 3276.122, and notably 3264.400. These levels are crucial for potential price bounces.
Key Resistance Zones (Potential Sell Areas): Significant supply zones are found at 3313.737, 3321.466, 3330.483, and 3341.947. These are points where selling pressure may emerge.
🎯 XAUUSD Trading Plan: Your Actionable Strategy
Here's a breakdown of the strategic entry and exit points for your XAUUSD trades:
BUY ZONE (Strong Support - Long-Term Bias):
Entry: 3266 - 3264
SL: 3270
TP: 3280 - 3284 - 3290 - 3295 - 3300 - 3305 - 3310 - 3320
BUY SCALP (Quick Buy at Intermediate Support):
Entry: 3284 - 3282
SL: 3278
TP: 3288 - 3292 - 3296 - 3300 - 3305 - 3310 - 3320 - 3330
SELL ZONE (Key Resistance):
Entry: 3331 - 3333
SL: 3337
TP: 3326 - 3320 - 3316 - 3310 - 3305 - 3300
SELL SCALP (Quick Sell at Near Resistance):
Entry: 3313 - 3315
SL: 3320
TP: 3310 - 3305 - 3300 - 3295 - 3290 - 3280
⚠️ Key Factors to Monitor Closely:
US Macro Data: Friday's US Personal Consumption Expenditures (PCE) Price Index is paramount for market direction.
FOMC Member Speeches: Any official comments on monetary policy or inflation outlook will significantly impact USD and Gold.
Geopolitical Stability: Developments related to the Israel-Iran ceasefire can influence safe-haven demand.

GBP/CAD - Breakout (27.06.2025)The GBP/CAD pair on the M30 timeframe presents a Potential Buying Opportunity due to a recent Formation of a Breakout Pattern. This suggests a shift in momentum towards the upside and a higher likelihood of further advances in the coming hours.
Possible Long Trade:
Entry: Consider Entering A Long Position around Trendline Of The Pattern.
Target Levels:
1st Resistance – 1..8857
2nd Resistance – 1.8909
🎁 Please hit the like button and
🎁 Leave a comment to support for My Post !
Your likes and comments are incredibly motivating and will encourage me to share more analysis with you.
Best Regards, KABHI_TA_TRADING
Thank you.
Disclosure: I am part of Trade Nation's Influencer program and receive a monthly fee for using their TradingView charts in my analysis.

Fundamental Market Analysis for June 27, 2025 GBPUSDThe GBP/USD pair held positive momentum near 1.3735 during Asian trading on Friday.
Concerns over the Fed's future independence continue to undermine the US Dollar and create a tailwind for the major pair. U.S. President Donald Trump's announcement that he is considering selecting the next Fed chairman ahead of schedule, which has spurred fresh controversy over U.S. rate cuts. Trump said the list of potential successors to Powell had shrunk to “three or four people”, without naming any finalists.
In addition, weaker-than-expected US gross domestic product (GDP) data also sent the dollar lower. The U.S. economy contracted faster than expected in the first three months of this year, falling 0.5%, the U.S. Bureau of Economic Analysis (BEA) reported on Thursday. The figure was below the previous estimate and the market consensus of -0.2%.
Bank of England Governor Andrew Bailey warned earlier this week that interest rates are likely to continue to fall. At its June meeting, the UK central bank left interest rates unchanged at 4.25%, although three of the nine members of the Monetary Policy Committee (MPC) voted to cut interest rates.
Trading recommendation: BUY 1.3750, SL 1.3690, TP 1.3865

A temporary drop in gold is logical for an upward moveGold is in an upward trend in higher timeframes, and to form this trend, we need to reach a position where buyers step in. At this moment, a slight pullback in the 15-minute timeframe seems logical, as we are in a small descending channel. OANDA:XAUUSD

EUR/USD Biases (Long, Short, and Today’s View)EUR/USD Trading Biases: Navigating Bullish Momentum and Key Resistance Zones
This will be a concise market analysis essay (around 600–700 words) suitable for a financial audience, such as forex traders or analysts. Let me begin:
EUR/USD Trading Biases: Navigating Bullish Momentum and Key Resistance Zones
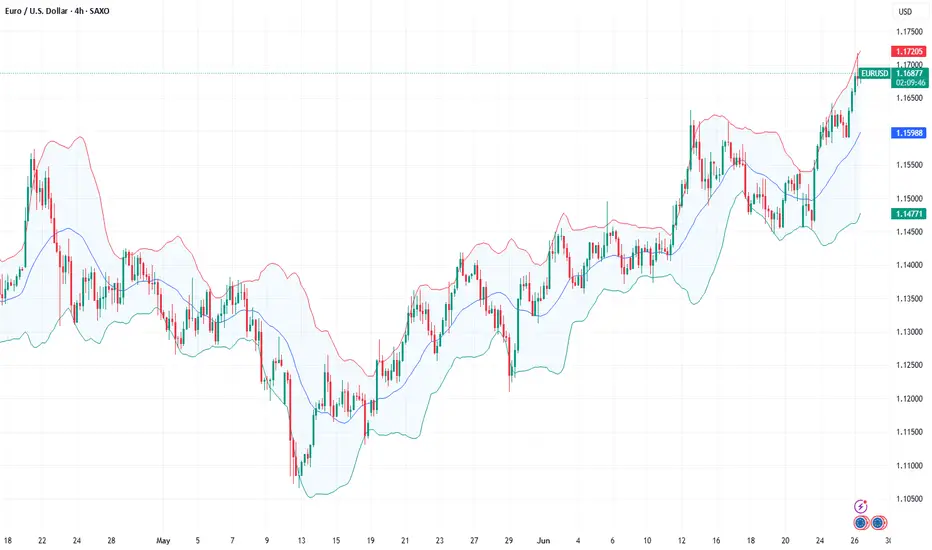
The EUR/USD pair, one of the most actively traded currency pairs in the forex market, has exhibited strong bullish momentum in recent sessions. As of June 26, 2025, the euro’s ascent against the dollar has brought it to a critical juncture, testing significant technical and psychological resistance levels. Traders are now weighing the potential for continued upside against growing signals of exhaustion and looming fundamental catalysts.
Bullish Outlook: A Technically Supported Advance
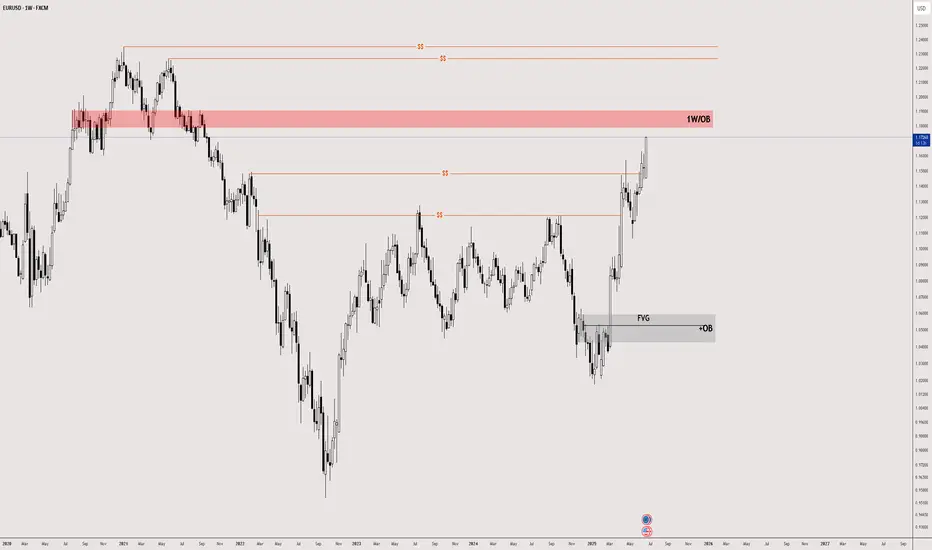
From a technical perspective, the bullish case for EUR/USD remains compelling. The pair is entrenched in a sustained uptrend, marked by successive breakouts above prior resistance levels and validated by daily and weekly closes above 1.1600. The current price action is converging on a crucial supply zone located between 1.1700 and 1.1900—an area historically known for triggering reversals but also pivotal in confirming trend continuation if broken convincingly.
Technical indicators further bolster the bullish narrative. The Relative Strength Index (RSI), while approaching overbought territory, is still supportive of higher prices. The Moving Average Convergence Divergence (MACD) displays a widening bullish histogram, and the Average Directional Index (ADX) confirms trend strength. Near-term resistance lies between 1.1680 and 1.1730, with potential for an extension to 1.1800 should the pair breach this upper band.
On the fundamental front, improved German Ifo business sentiment data has injected optimism into the eurozone outlook. Additionally, easing geopolitical tensions and a broader risk-on sentiment in global markets have undercut the dollar's safe-haven appeal. Speculation over potential Federal Reserve rate cuts further dampens dollar strength, creating tailwinds for EUR/USD.
Bearish Considerations: Resistance and Reversal Risks
Despite the encouraging trend, caution is warranted. The area between 1.1700 and 1.1900 represents a major weekly order block (OB) resistance—territory where several past rallies have lost steam. Oscillators such as the Commodity Channel Index (CCI) and RSI are showing signs of overextension, and the market is now vigilant for reversal patterns or signs of exhaustion.
Fundamentally, while the recent Ifo data is encouraging, it remains below the key threshold of 100, reflecting lingering skepticism about the eurozone's full recovery. Moreover, upcoming U.S. economic releases, particularly GDP figures and jobless claims, could act as potential catalysts for a dollar rebound. Hawkish commentary from Federal Reserve officials could also tilt sentiment, especially if it dampens expectations of rate cuts.
If EUR/USD fails to hold above the 1.1700–1.1730 resistance zone, a corrective move toward 1.1530–1.1500 becomes plausible. Deeper pullbacks could extend toward 1.1470 and 1.1390, especially if risk sentiment reverses or economic data surprises in favor of the dollar.
Today’s View: Bullish with a Note of Caution
For today, June 26, the prevailing bias remains bullish, yet increasingly cautious. The pair is testing the lower end of the 1.1700 OB zone. A decisive break and hold above this level would likely unleash further upside toward 1.1730 and 1.1800. However, overbought conditions and proximity to a known resistance zone suggest that traders should remain alert to potential rejection.
Intraday strategies favor buying on dips above 1.1600–1.1635, with stops placed just below 1.1600 and targets set at 1.1700–1.1730. Conversely, short positions should only be considered if there is a clear rejection from the 1.1700–1.1730 area, with downside targets at 1.1530–1.1500 and stops above 1.1800.
Conclusion
The EUR/USD is currently at a pivotal inflection point. While the bullish trend is intact and supported by both technical and fundamental factors, the proximity to a major resistance zone introduces a layer of complexity. Traders must remain agile—ready to ride a breakout higher if confirmed, but equally prepared to pivot if the pair falters and signals a reversal. In markets like these, timing and confirmation are everything.
What's Next For Bitcoin?Bitcoin Eyes A New ATH In the Upcoming Days...
But Do Not Be Surprised If BTC Drops Back To 90K.
Studying Previous Cycles, Showed Massive Drop Before the Bull Run.
#bitcoin #crypto #btc #trading #trader #portfolio #technicalanalysis

BTC multi-timeframe: bullish momentum and strong support zones__________________________________________________________________________________
Technical Overview – Summary Points
__________________________________________________________________________________
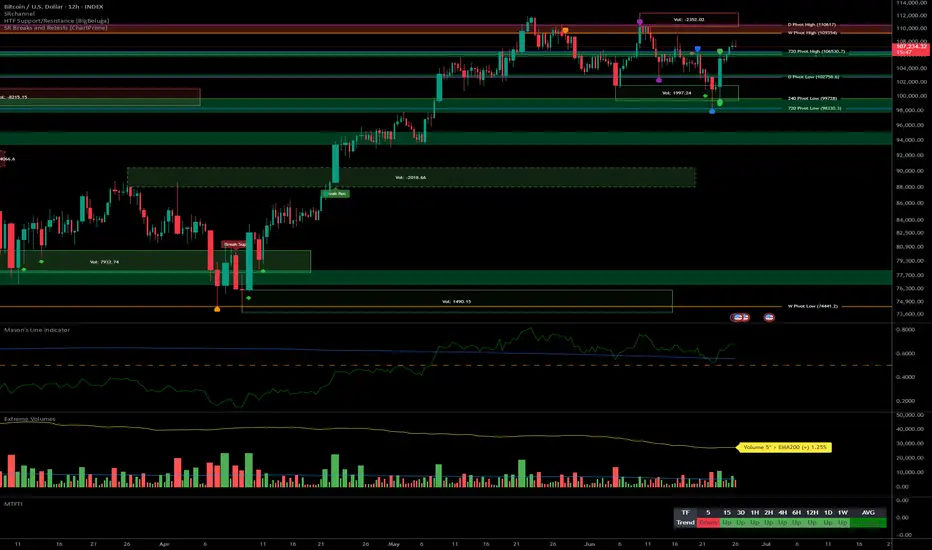
Momentum: Clear bullish bias across all timeframes (MTFTI Up everywhere except 5min). Weak selling pressure, no distribution or capitulation signals.
Support/Resistance: Key resistances: 110647–109554 (HTF). Major supports: 102756 (D Pivot Low), 98330 (720 Pivot Low). Multiple buy zones on retracement.
Volume: Recent volumes below "extreme" threshold, no euphoria/capitulation detected.
Multi-TF Behavior: Global bullish alignment, volatility present intraday, but no confirmed reversal risk. Risk On / Risk Off Indicator shows no major anomaly.
__________________________________________________________________________________
Strategic Summary
__________________________________________________________________________________
Strategic Bias: Structurally bullish market. Prioritize tactical buys on pullback, active risk management.
Opportunities: Reinforce long positions on $106k/$103k/$100k retrace. Partial targets below 110–111k.
Risk Zones: Rejection under 106500–107000 with extreme volume spike = short-term top signal. Invalidation if H1 < 106k or H4 < 102.7k.
Macro Catalysts: US calendar (GDP, durable goods, jobless claims), geopolitics (Russia/Ukraine). No systemic alert, but caution required.
Action Plan: Filter entries on technical supports, exit on extreme sell volume or macro shock.
__________________________________________________________________________________
Multi-Timeframe Analysis
__________________________________________________________________________________
1D: Compression below historical resistances (109–111k), solid momentum, potential buy zone 102750–98330.
12H: Multiple resistances, uptrend, support confluence 102756–106530 pivot key.
6H: Price under resistance cluster (106530), possible profit-taking on rejection, strong support 102756.
4H: High-range structure, reinforced supports, next breakout could trigger acceleration with volume.
2H: Pivot zone 106500–107200, caution below close, buy zone on correction.
1H: Support stacking structure, no clear breakdown, critical node, aggressive buy 106100–105800.
30min: Compression at range high, caution on buying resistance, key spots 106000/104500.
15min: Possible buyer exhaustion under 108k, tactical buy on support 106000–106500 if confirmed.
Summary: Strong bullish alignment, same key supports, no panic. Risk On / Risk Off Indicator neutral, controlled market, possible whipsaw on short-term TFs but no major reversal sign.
__________________________________________________________________________________
Macro, News & On-Chain Analysis
__________________________________________________________________________________
Macro: Fed and traditional markets calm, no monetary alert. Israel/Iran ceasefire, increased volatility in Europe (Russia/Ukraine). Moderate risk-on sentiment.
Calendar: June 26: US durable goods/GDP/jobless claims (potential volatility).
On-chain: BTC range $100–110k, fundamental support $93–100k, no panic/capitulation. Low spot volumes, bullish digestion phase.
__________________________________________________________________________________
Conclusion
__________________________________________________________________________________
Dominant bias: Up/moderately bullish in short term, focus on retracement buying.
Risk management: Stop H4 < $102.7k, H1 < $106k, scalping: break of 106k with extreme volumes.
Action zones: Reinforce on $106k/$103k/$100k retrace, partial TP below 110–111k, extension if confirmed breakout.
Monitor: Volume, support reactions, macro catalysts.
Summary:
Technical and on-chain context remains bullish; best approach is tactical buying on pullback with dynamic stops. Stay agile in case of extreme selling volume or macro shocks. Act on signals, protect capital.
__________________________________________________________________________________
BTC/USDT Drop to 101k?🧠 High Time Frame Context
Trend: Consolidation within a broad range (support and resistance clearly defined).
Key Psychological Levels:
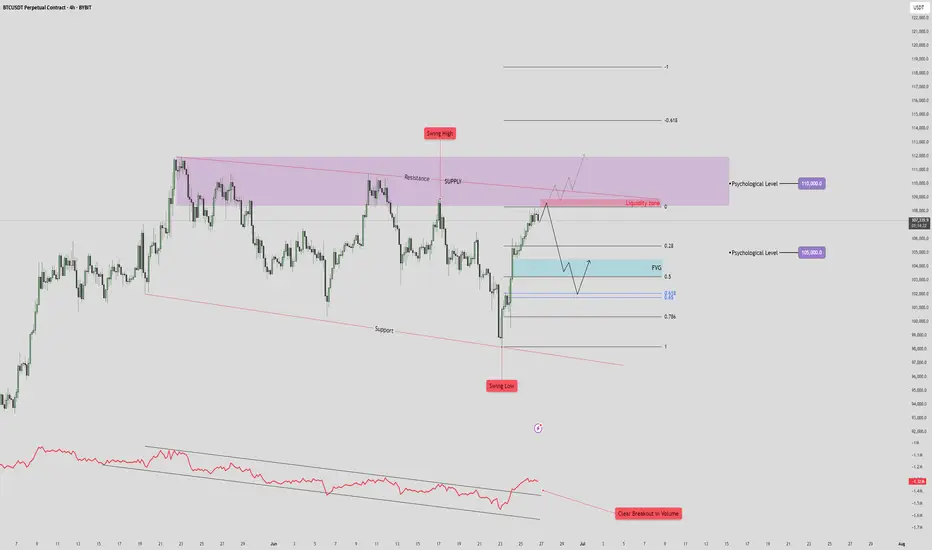
105,000 USDT – minor level, acting as a magnet in short-term PA.
110,000 USDT – major supply confluence and liquidity target.
🟪 Supply & Resistance Zone
Zone: Marked in purple (108.5k-112k).
Key Observation:
Swing high formed inside this zone, indicating liquidity trap.
Potential fake-out or strong rejection from this area.
Strong confluence with a descending resistance trendline, adding to the selling pressure.
🔵 Fair Value Gap (FVG) & Retracement Targets
FVG identified just below the current price (~103.5k-104.5k).
Price is projected to:
Reject from the current high.
Drop to fill the FVG zone.
Possibly bounce between FVG and Fibonacci retracement levels:
0.5
0.618
0.786
🔴 Volume & RSI Divergence
Volume breakout is noted on the last push down (bottom red annotation), followed by a retrace.
OBV shows bullish divergence with price:
🔻 Support Structure
Lower red trendline is a key long-term support.
Previous swing low aligns with this trendline – buyers showed strong interest here.
If FVG fails to hold, expect a retest of this trendline near 97,000–98,000.
📈 Likely Scenarios
Base Case (Neutral-Bearish):
Price rejects current zone (~107,000).
Pullback into FVG (101–104K).
Bounce to 105K (minor resistance), then decide next direction.
Bullish Breakout:
If price breaks and closes above 110K, it invalidates supply zone.
Opens door to 115–118K range.
Bearish Breakdown:
Fails FVG zone.
Tests previous swing low and support (~97K).
Below that, structure becomes macro bearish.
🧩 Summary
Short-Term: Retracement into FVG likely. Monitor reaction.
Medium-Term: Bearish bias while price is below 110K.
Invalidation for bears: Clean break and hold above 110K.
Euro's Surge on USD Weakness – Is 1.20 the Next Stop?EURUSD: Euro's Surge on USD Weakness – Is 1.20 the Next Stop?
Hello TradingView Community!
The EURUSD pair is currently commanding significant attention with its strong upward momentum.
🌍 Fundamental Highlights: Euro's Tailwinds & USD's Headwinds
The Euro has demonstrated notable strength, recently breaching the 1.17 mark to hit its highest level in over 3.5 years. According to ING, if this momentum holds, the next target could be 1.20, contingent on continued USD weakness.
The US Dollar faces considerable pressure following news that President Trump intends to name a successor to Fed Chair Powell soon, sparking concerns about the Fed's independence. Such speculation often leads to expectations of a more 'dovish' monetary policy, weakening the USD.
Adding to the Euro's support are the NATO agreement to increase defense spending targets to 5% and President Trump's seemingly "less aggressive" stance towards the EU.
In summary: Should USD depreciation persist, not only the Euro but other asset classes might also attract capital inflows, particularly given the ongoing uncertainties surrounding inflation risks and monetary policy.
📊 EURUSD Technical Outlook (H4/M30 Chart):
Our technical analysis of the EURUSD chart (image_b73298.png) confirms a clear and robust uptrend, characterized by successive higher highs and higher lows. The EMAs are in a bullish alignment, reinforcing this upward trajectory.
Upside Targets (Potential BUY Zones):
1.17807: The initial potential target if the bullish momentum continues.
1.18458: A higher target representing the next potential resistance zone.
Key Support Levels (Potential BUY Zones for pullbacks):
1.16070: A strong support level where demand could emerge after a correction.
An implied intermediate support around 1.166xx (visually suggested by price action between current levels and 1.16070) could also offer buying opportunities after minor pullbacks.
🎯 EURUSD Trading Plan:
BUY Zone 1 (Intermediate Pullback):
Entry: 1.16600 - 1.16700
SL: 1.16450
TP: 1.16800 - 1.17000 - 1.17200 - 1.17500 - 1.17807 - 1.18000 - 1.18300 - 1.18458
BUY Zone 2 (Strong Support):
Entry: 1.16070
SL: 1.15900
TP: 1.16200 - 1.16400 - 1.16600 - 1.16800 - 1.17000 - 1.17300 - 1.17600 - 1.17807 - 1.18458
SELL Zone (Consider only at upside targets with clear reversal signals):
Entry: 1.18458 (This is an upside target, but also a potential resistance for selling if strong reversal signals appear).
SL: 1.18600
TP: 1.18300 - 1.18000 - 1.17807 - 1.17500 - 1.17200 - 1.17000 - 1.16800
⚠️ Key Factors to Monitor:
Fed Leadership News: Any official announcements regarding the Fed Chair succession will trigger significant USD volatility.
Eurozone Economic Data: Upcoming inflation, GDP, and employment reports.
ECB Statements: The European Central Bank's stance on monetary policy.
Geopolitical Developments: Major tensions or agreements can influence market sentiment.
Trade smart and always manage your risk effectively! Wishing everyone a profitable trading day!

Riding the Wave or Facing a Pullback? Key Levels to WatchGBPUSD: Riding the Wave or Facing a Pullback? Key Levels to Watch!
Hello TradingView Community!
The GBPUSD pair is currently under the spotlight, experiencing significant movements driven by a mix of market sentiment and economic indicators.
🌍 Fundamental Snapshot: GBP's Lift vs. Underlying Pressures
The British Pound has seen a notable surge, climbing near 1.3765 against the US Dollar. This uplift is primarily fueled by market hopes for an imminent announcement of Fed Chair Powell's successor by President Trump, hinting at potential future dovish shifts in Fed policy. Such speculation could dampen USD's strength, benefiting GBPUSD.
However, the outlook isn't entirely clear-cut for the Pound. Fed Chair Powell has cautioned that tariff-induced inflation might prove persistent, adding a layer of complexity to the broader USD sentiment. Domestically, UK employers are reportedly planning workforce reductions to offset rising social security contributions, which could weigh on the GBP.
In essence, GBPUSD is benefiting from potential USD weakness linked to Fed policy expectations, but traders should remain vigilant about internal economic pressures within the UK.
📊 GBPUSD Technical Analysis (H4/M30 Chart):
Our technical analysis of the GBPUSD chart (image_b6d4de.png) reveals a clear uptrend, marked by consistent higher highs and higher lows. The EMAs are also in a bullish alignment, reinforcing this upward momentum.
Key Resistance (Potential Sell Zone): We identify significant resistance at 1.38366. This level could attract selling pressure, suggesting a potential price reversal or consolidation after hitting this mark.
Key Support Levels (Potential Buy Zones):
Initial support lies at 1.36648.
A stronger support area is at 1.36158. These levels could act as bounce points after any corrective moves.
🎯 GBPUSD Trading Plan:
BUY Zone 1 (Near Current Support):
Entry: Consider entries around 1.36648.
SL: 1.36500 (just below support).
TP: Target incremental gains towards 1.36800, 1.37000, 1.37200, 1.37400, 1.37600, 1.37800, 1.38000, and potentially 1.38300 (just shy of major resistance).
BUY Zone 2 (Stronger Support):
Entry: Look for entries around 1.36158.
SL: 1.36000 (below strong support).
TP: Target incremental gains towards 1.36300, 1.36500, 1.36700, 1.37000, 1.37300, 1.37600, 1.38000, and 1.38300.
SELL Zone (At Resistance):
Entry: Consider short entries around 1.38366.
SL: 1.38500 (just above resistance).
TP: Target incremental declines towards 1.38200, 1.38000, 1.37800, 1.37500, 1.37200, 1.37000, 1.36800, and 1.36648 (targeting support).
⚠️ Key Factors to Monitor:
Fed Leadership News: Any official announcement regarding the Fed Chair succession will trigger significant USD volatility.
UK Economic Data: Upcoming reports on employment, inflation, and GDP will directly impact the Pound.
BoE Statements: Monetary policy stances from the Bank of England.
US Inflation/Employment Data: Continues to influence overall USD strength.
Trade wisely and always prioritize robust risk management! Wishing everyone a successful trading day!

XAUUSD: Gold's Inflationary Tug-of-WarXAUUSD: Gold's Inflationary Tug-of-War – Navigating Powell's Remarks & Key Levels
Hello TradingView community!
Let's dive into Gold (XAUUSD) today, as its price action continues to be shaped by the Federal Reserve's (Fed) cautious stance on inflation and interest rates. Recent comments from Fed Chair Jerome Powell are particularly noteworthy.
🌍 Macroeconomic Drivers: Tariffs, Inflation, and Fed's Deliberation
The market finds itself in a complex situation following key statements from Fed Chair Jerome Powell:
Powell indicated that substantial tariffs could trigger a prolonged wave of inflation, potentially moving beyond conventional economic models. This introduces a new and significant factor into the inflation outlook.
Despite recent inflation moderation, Powell stressed the necessity of more data from June and July before considering any rate cuts. This underscores the Fed's cautious approach and lack of immediate urgency.
He also cautioned about the risk of "price shocks turning into persistent inflation".
In this environment, where market sentiment is stretched between hopes for rate cuts and the emerging risk of tariff-driven inflation, Gold maintains its role as a crucial psychological anchor. Should the Fed be slow to react to this potential new inflationary pressure, Gold's appeal could intensify.
📊 XAUUSD Technical Analysis & Trading Plan:
Based on the XAUUSD charts (H4/M30 timeframe) you provided (e.g., image_008403.png): Gold is currently undergoing a corrective or consolidating phase after a notable pullback. The price is trading below shorter-term moving averages, suggesting either bearish momentum or an accumulation phase.
Key Resistance Zones (Potential SELL Areas):
3,352.383 - 3,353.860: An immediate resistance point, coinciding with the 0.5 Fibonacci level.
Higher up: 3,391.750 - 3,395.000: This represents a very strong previous peak and a major resistance barrier.
Key Support Zones (Potential BUY Areas):
3,317.738 - 3,311.214: An intermediate support area, close to the 0.236 Fibonacci level.
3,302.939 - 3,302.857: A strong demand zone, aligning with the recent low.
Further down: 3,286.257: This is the next significant support level if preceding zones are breached.
🎯 XAUUSD Intraday Trading Plan:
Here are our refined zones and targets for today's trading:
BUY SCALP:
Entry: 3316 - 3314
SL: 3310
TP: 3320 - 3324 - 3328 - 3332 - 3336 - 3340
BUY ZONE:
Entry: 3304 - 3302
SL: 3298
TP: 3308 - 3312 - 3316 - 3320 - 3330 - 3340 - 3350
SELL SCALP:
Entry: 3353 - 3355
SL: 3360
TP: 3350 - 3345 - 3340 - 3335 - 3330
SELL ZONE:
Entry: 3390 - 3392
SL: 3396
TP: 3386 - 3382 - 3378 - 3374 - 3370 - 3360
⚠️ Key Factors to Monitor:
Fed Official Speeches: Any new comments from Fed officials regarding inflation or monetary policy outlook.
US Economic Data: Upcoming inflation (CPI, PCE) and employment reports (NFP) will be crucial for policy expectations.
Geopolitical Developments: Ongoing global tensions consistently bolster Gold's safe-haven appeal.
Trade wisely and always manage your risk effectively! Wishing everyone a profitable trading day!

Euro may start to decline to support line of upward channelHello traders, I want share with you my opinion about Euro. Earlier, the price was trading inside a downward wedge, gradually making lower highs and lower lows. After reaching the bottom of the wedge near the buyer zone (1.1210 - 1.1180), we saw a strong bullish impulse that broke through both the resistance line of the wedge and the support area near 1.1450 - 1.1485. This breakout signaled the beginning of a new phase - a transition into an Upward Channel. Since then, the price has been forming higher highs and higher lows, respecting both the upper and lower boundaries of this new structure. Along the way, it has rebounded from the support line multiple times and recently made a strong move up toward the resistance line of the channel. Currently, the price is approaching that resistance line, which may act as a potential reversal area. Given the previous price behavior and the clearly defined channel, I expect the price to reach the top boundary and then start to decline toward the lower support line. That’s why I’ve set my TP 1 at 1.1555 points, which aligns perfectly with the support line of the upward channel. Based on the recent breakout, the structure of the trend, and the reaction from key zones, I remain short-biased for the upcoming sessions. Please share this idea with your friends and click Boost 🚀
Disclaimer: As part of ThinkMarkets’ Influencer Program, I am sponsored to share and publish their charts in my analysis.

GOLD - Price can continue to move down in falling channelHi guys, this is my overview for XAUUSD, feel free to check it and write your feedback in comments👊
Some days ago price bounced from support level and started to grow to $3400 level, making a small correction before.
When it reached this level, price entered to wedge, where it made a correction and then started to grow.
In a short time, price exited from wedge and soon broke $3400 level, but then it started to decline in a falling channel.
In falling channel, Gold broke $3400 level one more time and in a short time declined to $3305 support level.
After this movement, Gold turned around and started to move up to resistance line of channel.
I expect that Gold can reach resistance line of channel and then start to decline to $3295 support area.
If this post is useful to you, you can support me with like/boost and advice in comments❤️
Disclaimer: As part of ThinkMarkets’ Influencer Program, I am sponsored to share and publish their charts in my analysis.

Fundamental Market Analysis for June 26, 2025 EURUSDThe EUR/USD pair continues to rise to 1.16800 during Thursday's Asian session. The US dollar (USD) is weakening against the euro (EUR) as investors worry about the future independence of the US Federal Reserve (Fed). Final data on US GDP growth for the first quarter will be in focus later on Thursday.
US President Donald Trump said on Wednesday that he is considering three or four potential candidates to replace Fed Chairman Jerome Powell. According to the Wall Street Journal, Trump may consider former Fed Governor Kevin Warsh, National Economic Council Director Kevin Hassett, and Treasury Secretary Scott Bessent. Other candidates include former World Bank President David Malpass and Fed Governor Christopher Waller.
This raises questions about a potential weakening of the Fed's independence and a possible decline in its authority, which undermines the dollar and creates favorable conditions for the major currency pair.
Across the Atlantic, European Central Bank (ECB) policymakers are concerned about the economic outlook due to Trump's tariff policy and geopolitical risks. Earlier this week, ECB policymaker François Villeroy de Galhau said that despite current conditions, further rate cuts are still possible. Statements by ECB policymakers may put pressure on the single currency in the near term.
Trading recommendation: BUY 1.16750, SL 1.16300, TP 1.17500
XAU/USD - Channel Breakout (26.06.2025)The XAU/USD pair on the M30 timeframe presents a Potential Buying Opportunity due to a recent Formation of a Channel Breakout Pattern. This suggests a shift in momentum towards the upside and a higher likelihood of further advances in the coming hours.
Possible Long Trade:
Entry: Consider Entering A Long Position around Trendline Of The Pattern.
Target Levels:
1st Resistance – 3385
2nd Resistance – 3410
🎁 Please hit the like button and
🎁 Leave a comment to support for My Post !
Your likes and comments are incredibly motivating and will encourage me to share more analysis with you.
Best Regards, KABHI_TA_TRADING
Thank you.
Disclosure: I am part of Trade Nation's Influencer program and receive a monthly fee for using their TradingView charts in my analysis.

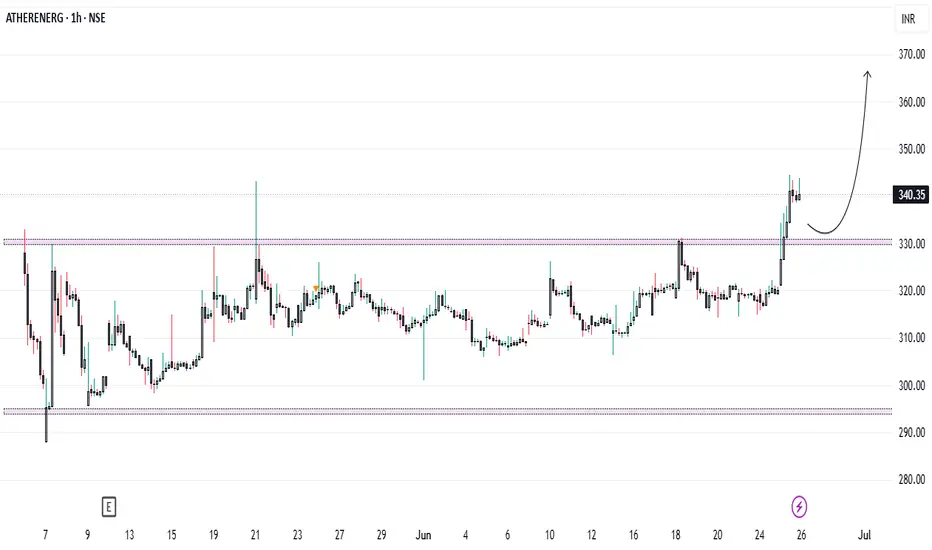
Ather’s Affordable EV Announcement Triggers Market Rally...Technical Analysis:
Ather Energy has successfully broken above the key resistance level of ₹330 and is currently trading around ₹340. This breakout is supported by a noticeable surge in volume, confirming bullish momentum. The ₹330 level, which previously acted as a strong resistance, may now serve as a potential support in the event of a retest. Traders and investors can look for buying opportunities on dips near ₹330, while those already holding the stock are advised to continue holding for further upside.
Fundamental Analysis:
From a fundamental standpoint, Ather’s maiden quarterly results have been encouraging. The company reported a one-third increase in revenue, while its EBITDA loss narrowed to ₹172 crore, down from ₹239 crore in the same quarter last year. This marks a significant step towards operational efficiency and profitability.
Adding to the positive sentiment, Ather recently announced that it will unveil its new EL EV platform and upcoming concept models in August 2025. The highlight of this announcement is that the new scooter will be Ather’s most affordable offering, signaling a strategic push to expand market penetration and compete in the mass segment of the EV market.
Conclusion:
The breakout at ₹330, supported by improving financial performance and strong product pipeline news, suggests a bullish outlook for Ather Energy in the near term. Investors should monitor the ₹330 level for price retest and accumulation opportunities. Holding is recommended for existing investors, while fresh entries can be considered on technical confirmation around support zones.
Note: Due to ongoing global uncertainties, market conditions may remain volatile. Investors are advised to exercise caution and manage risk accordingly.
GBP/JPY Bullish Flag (25.06.2025) The GBP/JPY pair on the M30 timeframe presents a Potential Buying Opportunity due to a recent Formation of a Bullish Flag Pattern. This suggests a shift in momentum towards the upside and a higher likelihood of further advances in the coming hours.
Possible Long Trade:
Entry: Consider Entering A Long Position around Trendline Of The Pattern.
Target Levels:
1st Resistance – 198.46
2nd Resistance – 199.00
🎁 Please hit the like button and
🎁 Leave a comment to support for My Post !
Your likes and comments are incredibly motivating and will encourage me to share more analysis with you.
Best Regards, KABHI_TA_TRADING
Thank you.
Disclosure: I am part of Trade Nation's Influencer program and receive a monthly fee for using their TradingView charts in my analysis.

Ready for a new day, please bring another doubler like $EYENReady for a new day, please bring another doubler like NASDAQ:EYEN $5 to $10 or NYSE:SRFM yesterday which were the only 2 trades made and 2 nice wins🙏🏻
