USDCAD: Oil Price Weakness Weighs on CAD – Can USD Capitalize?USDCAD: Oil Price Weakness Weighs on CAD – Can USD Capitalize?
Hello TradingView community!
Today, let's analyze the USDCAD pair, which is showing interesting dynamics as the CAD faces pressure from falling oil prices.
🌍 Macro Drivers: CAD Struggles Amidst Lower Oil, USD Upside Limited
The USDCAD pair is caught in a tug-of-war between the Canadian Dollar (CAD) and the US Dollar (USD):
CAD pressured by oil: The Canadian Dollar has seen its gains trimmed, primarily weighed down by lower crude oil prices. Canada, being a major oil exporter, sees its currency directly impacted by these fluctuations.
Oil prices lower: A recent truce between Israel and Iran is keeping crude oil prices significantly lower (16% below Monday's highs), directly affecting CAD's strength.
USD's limited upside: Despite CAD's weakness, the US Dollar's upside attempts are being constrained by recent soft US economic data and persistent hopes for Federal Reserve (Fed) monetary policy easing.
In summary, USDCAD is seeing a slight upward tick due to a weaker CAD from oil price drops, but the USD's rally is somewhat capped by Fed easing expectations.
📊 Technical Analysis & USDCAD Trading Plan
Based on the USDCAD chart (H4/M30) provided:
Overall Trend: USDCAD is trading within an ascending channel, but shows signs of weakness near the channel's upper boundary. Price appears to be forming a lower high after a previous upward move.
Key Price Levels:
Potential SELL Zone (Resistance): Clearly identified around 1.36989. This is a strong resistance level, coinciding with recent local highs. Selling pressure is likely to emerge here.
Key Support (Potential BUY Zone): Around 1.36734 and further down at 1.36431. The 1.36431 level is particularly significant, aligning with a major Fibonacci level (1.382) and acting as a robust demand area from prior price action.
Moving Averages (EMAs): Price is trading near the EMAs (black, orange, red), indicating a consolidation phase and potential for a significant move.
Projected Price Action: The chart suggests that USDCAD could pull back from the current resistance zone (1.36989) towards the support levels below, particularly 1.36431, before potentially finding buying interest to resume an upward trend.
🎯 USDCAD Trading Plan:
SELL ZONE: 1.36989
SL: 1.37050
TP: 1.36900 - 1.36850 - 1.36800 - 1.36750 - 1.36700 - 1.36600 - 1.36500 - 1.36431
BUY ZONE: 1.36431
SL: 1.36300
TP: 1.36500 - 1.36550 - 1.36600 - 1.36650 - 1.36700 - 1.36750 - 1.36800 - 1.36900
⚠️ Key Factors to Monitor:
Crude Oil Prices: Any significant movements in crude oil will directly impact the CAD.
US Economic Data: Upcoming reports on inflation and employment from the US could heavily influence Fed policy expectations and USD strength.
Bank of Canada (BoC) Policy: Statements or decisions from the BoC will also be a critical factor affecting the CAD.
Trade smart and stay vigilant! Wishing everyone a successful USDCAD trading day!
Analysis

Downtrend Slowing – Recovery Opportunity After Correction?USD/JPY: Downtrend Slowing – Recovery Opportunity After Correction?
Hello TradingView community!
Today, let's focus on analyzing the USD/JPY pair, which is showing interesting developments after its recent correction.
🌍 Macro Overview: USD/JPY Under Current Pressures
The market is observing shifts in the dynamics of the USD/JPY pair:
UOB Group's 24-Hour View: The USD experienced a sharp decline from 148.02 on Monday to 144.49, despite being "oversold". This indicates a slowing in the downtrend, though caution remains.
Retest Expected: According to UOB Group, there's a likelihood of USD/JPY retesting the 144.50 level before a more sustained recovery can be expected.
Downside Limited: A drop below 144.50 cannot be ruled out, but based on current momentum, any further weakness is unlikely to reach 144.00.
Resistance Levels: On the upside, resistance levels are noted at 145.20 and 145.55.
Overall, USD/JPY is in a phase of seeking equilibrium after a significant decline.
📊 Technical Analysis & USD/JPY Trading Plan
Based on the USD/JPY chart (H4/M30) you provided:
Overall Trend: The pair has undergone a relatively deep corrective decline after reaching a local peak, but appears to be seeking a strong support zone.
Key Price Levels:
Crucial Resistance (SELL Zone): Clearly at 144.894 - 145.178. This is an confluence area of Fibonacci levels and local highs where selling pressure could emerge strongly.
Important Support (Potential BUY Zone): Around 143.800 - 143.500. This represents a potential bottoming area where demand might be strong enough to push the price higher.
Projected Price Action: After the sharp decline, USD/JPY might retest the 144.50 area. If it holds above key support levels, an upward move towards resistance zones is plausible, as indicated by the arrows on the chart.
🎯 USD/JPY Trading Plan:
BUY ZONE: 143.800 - 143.500
SL: 143.400
TP: 144.000 - 144.200 - 144.500 - 144.800 - 145.000 - 145.200 - 145.500
SELL ZONE: 144.894 - 145.178
SL: 145.300
TP: 144.700 - 144.500 - 144.200 - 144.000 - 143.800 - 143.500
⚠️ Key Factors to Monitor:
US and Japanese Economic Data: Upcoming reports on inflation and employment from both nations could significantly impact Fed and BoJ policy expectations.
BoJ Policy Decisions: Any shifts in the Bank of Japan's stance will create strong volatility for the JPY.
Global Risk Sentiment: Changes in overall market sentiment can also affect JPY crosses.
Trade smart and stay informed! Wishing everyone a successful USD/JPY trading day!

Can it Reach New Highs as USD Weakens?EUR/USD: Euro's Resilience Holds Strong – Can it Reach New Highs as USD Weakens?
🌍 Macro Landscape: EUR/USD Rides Risk-On Sentiment and Fed Cut Hopes
The Euro (EUR) is showing significant strength, maintaining its position near a three-year high against the US Dollar (USD). This resilience is largely fueled by a moderately positive risk appetite in the market.
Simultaneously, the US Dollar is facing considerable downward pressure. This weakness stems from recent weaker-than-expected economic data from the United States and increasing market expectations for the Federal Reserve (Fed) to implement interest rate cuts. If US economic indicators continue to soften, it could solidify the case for earlier Fed rate cuts, further undermining the USD and potentially boosting EUR/USD.
🏦 Central Bank Policy: Diverging Paths for ECB and Fed
Federal Reserve (Fed): The market is increasingly pricing in the likelihood of Fed interest rate cuts. Weaker US data strengthens this narrative, as the Fed might be compelled to ease monetary policy to support economic growth. This dovish outlook for the Fed is a key driver of USD weakness.
European Central Bank (ECB): While the provided information focuses on the EUR's strength due to broader market sentiment and USD weakness, the ECB's more measured approach to monetary policy compared to the Fed's potential easing can create a favorable interest rate differential for the Euro, attracting capital flows.
This divergence in central bank policy expectations—with the Fed leaning towards cuts and the ECB maintaining a more cautious stance—creates a tailwind for the EUR/USD pair.
🌐 Capital Flows: Money Favors Euro Amidst USD Softness
Global capital flow models suggest that funds are increasingly moving towards assets perceived as offering better relative value or stability. As US yields become less attractive due to anticipated Fed rate cuts, capital may flow out of USD-denominated assets.
This outflow from the USD naturally benefits currencies like the Euro, especially given its current positive momentum driven by a moderate risk-on environment. The re-pricing of Fed policy risk directly influences these capital movements, contributing to the upward trajectory of EUR/USD.
📊 Technical Structure (H4 Chart Analysis): EUR/USD Eyes Key Resistance Levels
Based on the provided EUR/USD H4 chart:
Uptrend intact: The pair continues to exhibit a positive trend, characterized by higher lows and higher highs within an ascending channel.
Key Resistance Levels:
Initial Resistance: 1.16330. This level aligns with recent highs and the top of the minor channel. A break above this suggests further bullish momentum.
Major Resistance Zone: 1.17031. This is indicated as a significant resistance area, potentially a long-term target or a reversal point. A break here would confirm strong bullish conviction.
Key Support Levels:
Immediate Support: 1.15470. This level has acted as a support point, aligning with the EMA 200 and a Fibonacci retracement level, indicating a potential bounce area.
Strong Support Zone: 1.15249. This zone represents a robust demand area, aligning with previous price action and serving as a crucial level for bulls to defend.
Moving Averages (EMA 13-34-89-200): The price is trading above the short-term and long-term EMAs, suggesting strong bullish momentum. The EMAs are fanning out and showing a bullish alignment, reinforcing the uptrend.
Projected Price Action: The chart suggests that the price might retrace towards the 1.15470 or 1.15249 support zones before resuming its upward trajectory towards the 1.16330 and potentially 1.17031 resistance levels.
🎯 Trade Strategy Recommendations:
Scenario 1 – BUY the Dip:
Entry: Look for bullish confirmation around 1.15470 - 1.15249.
Stop-Loss: Below 1.15100 (or a level below the 1.15249 support for risk management).
Take-Profit:
TP1: 1.15600
TP2: 1.15800
TP3: 1.16000
TP4: 1.16200
TP5: 1.16330 (Targeting the immediate resistance)
TP6: 1.16500
TP7: 1.16800
TP8: 1.17031 (Targeting the major resistance)
Scenario 2 – SELL the Rally (Counter-trend/Reversal):
Entry: Look for bearish confirmation around 1.16330 - 1.16400 or higher near 1.17031.
Stop-Loss: Above 1.16500 (or above 1.17100 if selling at higher resistance).
Take-Profit:
TP1: 1.16200
TP2: 1.16000
TP3: 1.15800
TP4: 1.15600
TP5: 1.15470 (Targeting the immediate support)
TP6: 1.15249 (Targeting the strong support zone)
⚠️ Key Events to Watch:
Upcoming US Economic Data: Any further weak data could solidify Fed rate cut expectations and weigh on the USD.
ECB Official Statements: Comments from ECB members on inflation or monetary policy could impact EUR's strength.
Global Risk Sentiment: A continued moderate risk-on environment will generally support the EUR against the USD.
Trade smart and stay informed! Wishing everyone a successful trading day!
Powell's Softer Tone Hints at Gold's LiftoffXAUUSD: Powell's Softer Tone Hints at Gold's Liftoff – Ready for a July Rally?
Hey everyone!
Let's dive into XAUUSD today! We've got some sweet news from Fed Chair Jerome Powell that could be a game-changer for Gold.
🌍 Macro Edge: Gold Breathes Easier as Rate Pressures May Ease!
Gold's recent climb is largely thanks to Powell's "soft-spoken" remarks. He's openly admitted that tariff-driven inflation is lower than expected, even subtly hinting at earlier rate cuts – perhaps as soon as July!
Despite his "no need to rush" stance, the market's getting a clear message: if inflation keeps cooling down, the Fed will have room to loosen policy sooner. This is music to Gold's ears! Lower rates mean a reduced opportunity cost for holding Gold (which doesn't yield), making it far more attractive to investors.
🌐 Capital Flows: Gold vs. USD – Who's the Next Safe-Haven King?
Market liquidity always dances to the tune of interest rates and risks. Gold and the USD typically share the safe-haven crown during volatile times.
However, if Powell's "dovish tilt" holds, and the Fed cuts rates soon, prepare for a significant capital shift:
USD might cool off: Lower US yields reduce the USD's appeal.
Gold takes the spotlight: With lower holding costs and persistent global geopolitical uncertainties, Gold could see a surge in demand.
The market's re-pricing of Fed policy is already bolstering Gold, signaling a potential upside move on the horizon!
📊 Technical Insight (H4/M30 Chart): Gold Breaking Free, Targeting Higher Peaks!
Looking at our XAUUSD chart (H4/M30, based on your image):
Channel Breakout: Gold has clearly broken out of its prior descending channel! This is a positive sign, indicating weakening selling pressure and a potential trend reversal. Price is consolidating, possibly forming a new accumulation pattern or a minor ascending channel.
Key Levels to Watch:
Potential SELL Zone (Resistance): Around 3352.383 - 3371.205. This is a major historical resistance cluster where Gold has previously met strong selling pressure. Watch for rejection here.
Higher Resistance: 3391.750 - 3395.000. A decisive break above this level would signal a more robust long-term bullish trend.
Current BUY Zone (Support): Around 3302.939 - 3311.214. This is a critical demand zone where strong buying interest is likely to emerge, aligning with recent lows.
Next Key Support: 3286.257. This is the next line of defense if the current BUY zone breaks.
🎯 Trade Plan & Key Zones:
BUY ZONE: 3286 - 3284
SL: 3280
TP: 3290 - 3294 - 3298 - 3302 - 3306 - 3310 - 3315 - 3320
BUY SCALP: 3302 - 3300
SL: 3295
TP: 3306 - 3310 - 3314 - 3318 - 3322 - 3326 - 3330
SELL ZONE: 3353 - 3355
SL: 3360
TP: 3350 - 3346 - 3340 - 3335 - 3330 - 3320
SELL ZONE: 3372 - 3374
SL: 3378
TP: 3370 - 3366 - 3362 - 3358 - 3354 - 3350
⚠️ What Else to Watch For:
More Fed Official Speeches: Any new comments on inflation or policy will keep the market buzzing.
Geopolitical Developments: Ongoing global tensions can always boost Gold's safe-haven appeal.
Let's trade smart and stay sharp! Wishing everyone a successful trading day!

BTCUSD : HUGE FALL AHEAD ? Sell at 106200 or below
Stoplos : 113000
Target : 100000, 90000
BTCUSD struggling hard to make new highs. Retest of 90k level expected.

Fundamental Market Analysis for June 25, 2025 USDJPYEvents to pay attention to today:
17:00 EET.USD - Fed Chair Jerome Powell will deliver a speech
17:30 EET.USD - Crude oil inventory data from the Department of Energy
USDJPY:
The Japanese yen (JPY) remains in the lead against the US dollar during Wednesday's Asian session and remains close to the weekly high reached the day before, amid a combination of favourable factors. The summary of opinions from participants at the Bank of Japan (BoJ) meeting in June showed that some policymakers called for interest rates to be kept unchanged due to uncertainty about the impact of US tariffs on the Japanese economy. In addition, the fragile truce between Israel and Iran and trade uncertainty are supporting the Japanese yen as a safe-haven currency.
Meanwhile, investors seem convinced that the Bank of Japan will raise interest rates again amid mounting inflationary pressure in Japan. These forecasts are confirmed by Japan's producer price index (PPI), which rose for the third consecutive month in May and remained above 3% year-on-year. In contrast, traders are factoring into their prices the likelihood that the Federal Reserve (Fed) will further lower the cost of borrowing this year. This, in turn, is causing US dollar (USD) bulls to tread cautiously and suggests that the path of least resistance for the lower-yielding Japanese yen remains upward.
Trading recommendation: SELL 144.900, SL 145.100, TP 144.000

XAUUSD 1H | Harmonic AB=CD | Sentiment Reversal in PlayGold has formed a clean Harmonic AB=CD Pattern, with price currently sitting at the PRZ (Potential Reversal Zone). This aligns with technical expectations for a possible bullish shift.
🗓️ The recent sharp sell-off in Gold was heavily influenced by the ongoing Iran-Israel conflict, triggering fear, panic, and speculative selling. Despite Gold's fundamentally bullish bias as a safe-haven asset, market sentiment overpowered fundamentals in the short term.
🔍 On the 30min LTF, we have a crystal-clear Bullish Divergence on RSI, adding further confluence that downside momentum is weakening, and a corrective reversal may unfold from this area.
Bias:
✅ Harmonic AB=CD complete — PRZ active
✅ LTF Bullish Divergence (30m) confirmed
✅ Price action showing exhaustion at key support
✅ Expecting potential bullish reaction and relief rally
⚠️ As always, waiting for confirmation with proper risk management. Market remains sensitive to geopolitical headlines.
💡 DYOR — Do Your Own Research before executing trades.

GBP/JPY Triangle Breakout (25.06.2025)The GBP/JPY Pair on the M30 timeframe presents a Potential Selling Opportunity due to a recent Formation of a Triangle Breakout Pattern. This suggests a shift in momentum towards the downside in the coming hours.
Possible Short Trade:
Entry: Consider Entering A Short Position around Trendline Of The Pattern.
Target Levels:
1st Support – 195.96
2nd Support – 195.37
🎁 Please hit the like button and
🎁 Leave a comment to support for My Post !
Your likes and comments are incredibly motivating and will encourage me to share more analysis with you.
Best Regards, KABHI_TA_TRADING
Thank you.
Disclosure: I am part of Trade Nation's Influencer program and receive a monthly fee for using their TradingView charts in my analysis.

APX Rebound in Play?📈 “APX Rebound in Play? Eyeing the AUD 1.55 Resistance”
Appen (APX) has shown a significant uptick today, closing at AUD 1.040 (+5.58%) with a sharp volume spike (8.96M shares) that could suggest accumulation. After a long downtrend, price appears to be consolidating above key support near AUD 1.00, forming a potential base for reversal.
🔍 Chart Highlights:
Support Zone: AUD 1.000 – strong historical level holding.
Resistance Targets: → AUD 1.555 → AUD 1.655 → AUD 1.785
R/R Setup: Defined green zone shows potential upside if momentum continues; red zone clearly marks invalidation below support.
🧠 Thesis: If APX maintains momentum and holds above AUD 1.00, we may be witnessing a structural shift with upside potential toward AUD 1.78 in stages. Breakout traders might watch for confirmation via volume and price action at each resistance.
💬 “Could we be looking at an early-stage reversal or just a dead-cat bounce? Watching the 1.00 level closely.”
#ASX #APX #APPEN #MJTRADING #TRADING #SHARE #STOCKMARKET #BUY #CHART #MONEYMANAGEMENT

Euro can drop from wedge, breaking support levelHello traders, I want share with you my opinion about Euro. The price previously started a confident upward movement, breaking out from the buyer zone around 1.1075 and forming an upward wedge pattern. As the trend continued, EUR pushed through the support area and traded inside the wedge, showing multiple bounces from the support line. Eventually, the pair reached the resistance line at the top of the wedge and then reversed. After a short correction, it tried to rebound again but failed to create a new high. The market then pulled back into the support area 1.1455 - 1.1410 and is now testing that level once more. Currently, the Euro is trading just above the support area, and we may see a short-term rebound from here. However, given the overall structure, I expect the price to break the support level and exit the wedge pattern to the downside. In my opinion, this breakout will initiate a strong bearish wave, targeting the 1.1250 points, which is where I’ve set my TP 1. Given the pattern structure, recent lower highs, and the weakening bullish momentum, I remain bearish and anticipate further decline once support is broken. Please share this idea with your friends and click Boost 🚀
Disclaimer: As part of ThinkMarkets’ Influencer Program, I am sponsored to share and publish their charts in my analysis.

Bitcoin can correct to support line of channel and start to growHello traders, I want share with you my opinion about Bitcoin. The price was moving inside a strong upward channel, where it managed to break through the support level and then the resistance level, eventually reaching the seller zone. After that, BTC started to turn around and declined, once again breaking through the 109000 resistance level, this time from above. That movement also marked an exit from the upward channel. Following that, the price made a correction move down to the support level — the same zone that previously acted as a breakout area. From there, BTC showed strength again with a bullish impulse upward, returning to the Seller Zone. However, that rally was short-lived. The market started to decline again, this time forming a downward channel. Now the price is approaching the support line of this channel, which coincides with the support level around 100500 and the buyer zone between 99500 and 100500. I think BTC can decline a bit further to test this support line, and then rebound from this area, starting a new upward move toward the channel resistance line. That’s why I’ve set my TP at 106000 points, just below the resistance line. Given the structure and past reactions from these zones, I remain bullish and expect further growth after this local pullback. Please share this idea with your friends and click Boost 🚀
Disclaimer: As part of ThinkMarkets’ Influencer Program, I am sponsored to share and publish their charts in my analysis.

EURO - Price can continue to decline inside wedge patternHi guys, this is my overview for EURUSD, feel free to check it and write your feedback in comments👊
Some days ago, price tried to grow, but failed and dropped below $1.1220 support level, after which started to grow in channel.
In rising channel, price broke $1.1220 level one more time and then rose to resistance line and then corrected.
Next, Euro rose to $1.1455 level and some time traded inside this level, until it broke it and continued to move up.
Price exited from rising channel and later started to decline inside wedge pattern, where it declined to $1.1455 level.
Recently, price bounced from this level and in a short time rose to resistance line of wedge pattern.
In my mind, Euro can continue to decline to $1.1400 support line of wedge, breaking support level.
If this post is useful to you, you can support me with like/boost and advice in comments❤️
Disclaimer: As part of ThinkMarkets’ Influencer Program, I am sponsored to share and publish their charts in my analysis.

AUD/USD 2H | MAKE OR BREAK (Key Edge)🟡 AUD/USD 2H Analysis – June 19, 2025
Bias: Neutral → Reactive (Awaiting Breakout Direction)
Timeframe: 2H
🔍 Market Overview:
AUD/USD is approaching a make-or-break level at the confluence of an ascending trendline and a minor horizontal support around 0.6460–0.6470. This comes after price was rejected from the 2025 high (0.6555) — a significant technical ceiling, labeled as a Possible Reversal Point.
✳️ Technical Structure:
🔵 Upper wedge resistance rejected price twice (0.6555)
🔵 Support trendline has been respected since late May
🟠 Current zone (0.6460) = last line of bullish defense
🔻 Breakdown risk is rising due to lower highs & compression
🔼 Bullish Playbook (Bounce Scenario):
Trigger: Bullish reaction from 0.6460 with strong momentum candle or engulfing
Entry: 0.6465–0.6475
Stop: Below 0.6440
Target 1: 0.6515
Target 2: 0.6555 (2025 High / Upper Wedge Edge)
R/R: ~2.0+
🔽 Bearish Playbook (Breakdown Scenario):
Trigger: 2H close below 0.6455 + retest rejection
Entry: 0.6450–0.6445 on retest
Stop: Above 0.6480
Target 1: 0.6400 (demand zone)
Target 2: 0.6300
R/R: ~2.5+
The next 4–8 candles could define the near-term structure. Respect the edge — react, don’t predict.
Zoom in:
Please Manage Your Risk...
#AUDUSD #MJTRADING #TRADINGVIEW #Chart #Analysis #Forex #Forexsignal #FXSignal

Fundamental Market Analysis for June 24, 2025 GBPUSDThe GBP/USD pair is strengthening to 1.3560 in the early European session on Tuesday, helped by a weaker US Dollar (USD).
Federal Reserve (Fed) Governor Michelle Bowman said on Monday that she would favor an interest rate cut at the next meeting in July if inflationary pressures remain muted. Bowman's comments echoed those of Fed chief Christopher Waller, who said on Friday that he believes the U.S. central bank may consider a rate cut in July.
Traders now put the probability of a rate change at the July meeting at nearly 23%, and the probability that the Fed will cut rates in September at about 78%.
On the other hand, uncertainty surrounding the ceasefire between Israel and Iran and renewed tensions in the Middle East could increase safe-haven flows, supporting the Pound Sterling (GBP). The Israel Defense Forces said early Tuesday it had detected rockets launched from Iran towards southern Israel, despite US President Donald Trump saying a “full and final” ceasefire between Israel and Iran would take effect.
Trading recommendation: SELL 1.3545, SL 1.3645, TP 1.3345

XAUUSD: Key Reversal Zone or Deeper Correction Ahead?XAUUSD: Key Reversal Zone or Deeper Correction Ahead?
Gold enters the new trading week balancing on a technical and macroeconomic knife’s edge. After a steep decline, prices are testing critical liquidity zones — just as geopolitical tensions and US economic uncertainty intensify.
🌍 Macro & Fundamental Outlook
📰 Middle East Tensions Rising Again: Israel has signaled potential strikes on Tehran after Iran allegedly violated a ceasefire agreement. Such developments usually support gold as a safe-haven asset.
📊 US Economic Signals Are Mixed: Last week’s PMI and housing data point toward an economic slowdown. If this week’s Core PCE data softens, expectations for a Fed rate cut in September will grow — likely weakening the USD and lifting gold.
🏦 Global Demand for Gold Still Strong: Central banks, particularly from China and India, are continuing their gold accumulation, reinforcing long-term bullish fundamentals.
📉 Technical Analysis (H1–H4)
Gold is still trading within a downward channel but is now approaching a strong demand zone around 3276, a level that has triggered rebounds in the past.
EMA 34 – 89 – 200 indicate bearish momentum, but RSI is showing bullish divergence — hinting at a possible reversal or short-term bounce.
Price action around key support and resistance levels will be crucial this week.
✅ XAUUSD Trade Setup
BUY ZONE: 3278 - 3276 | SL: 3270 | TP: 3282 - 3286 - 3290 - 3294 - 3298 - 3302 - 3305 - 3310
SELL ZONE: 3367 - 3369 | SL: 3375 | TP: 3364 - 3360 - 3356 - 3352 - 3348 - 3344 - 3340 - 3330 - 3320
📌 The Buy Zone lies within a historical liquidity pocket — ideal for a potential rebound if geopolitical risks rise or USD weakens.
📌 The Sell Zone is near a key Fair Value Gap (FVG) and local resistance — strong confluence for short opportunities on a bounce.
🧭 Final Thoughts
XAUUSD is facing a pivotal moment. With both geopolitical events and major US economic data on the horizon, traders should prepare for volatility. Patience, technical discipline, and proper SL/TP management will be key to navigating this environment successfully.

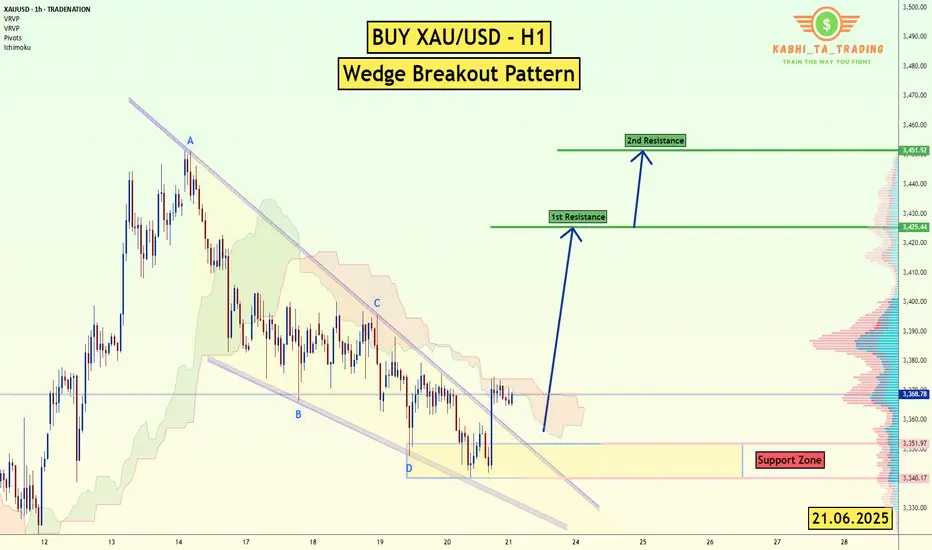
XAU/USD (Gold) - H1 - Wedge Breakout (21.06.2025)The XAU/USD pair on the H1 timeframe presents a Potential Buying Opportunity due to a recent Formation of a Wedge Breakout Pattern. This suggests a shift in momentum towards the upside and a higher likelihood of further advances in the coming Days.
Possible Long Trade:
Entry: Consider Entering A Long Position around Trendline Of The Pattern.
Target Levels:
1st Resistance – 3425
2nd Resistance – 3451
🎁 Please hit the like button and
🎁 Leave a comment to support for My Post !
Your likes and comments are incredibly motivating and will encourage me to share more analysis with you.
Best Regards, KABHI_TA_TRADING
Thank you.
Disclosure: I am part of Trade Nation's Influencer program and receive a monthly fee for using their TradingView charts in my analysis.
NZD/JPY - Triangle Breakout (23.06.2025)The NZD/JPY Pair on the H1 timeframe presents a Potential Selling Opportunity due to a recent Formation of a Triangle Breakout Pattern. This suggests a shift in momentum towards the downside in the coming hours.
Possible Short Trade:
Entry: Consider Entering A Short Position around Trendline Of The Pattern.
Target Levels:
1st Support – 86.35
2nd Support – 86.00
🎁 Please hit the like button and
🎁 Leave a comment to support for My Post !
Your likes and comments are incredibly motivating and will encourage me to share more analysis with you.
Best Regards, KABHI_TA_TRADING
Thank you.
Disclosure: I am part of Trade Nation's Influencer program and receive a monthly fee for using their TradingView charts in my analysis.

XAUU-USD chart it will go back upwardXAUUSD Buy Setup Active 🟢💰
Gold is holding strong above key support – currently trading at 3355. We’ve entered a Buy position expecting continued bullish momentum in the market.
📍 Entry: 3355
🎯 Targets: 3420 – 3450 – Final Target 3400
🛑 Stop Loss: 3325 (below recent structure low)
With global uncertainty and technical strength aligning, this move could push gold higher in the coming sessions.
Stay alert, manage risk, and follow the trend until reversal confirmation. 🧭📈
#XAUUSD #GoldTrade #ForexTrading #BuySetup #TradingViewAnalysis #MarketUpdate

Euphoria in the air! But, will it get us there?
-liquidity pools at white lines
-triangle formation atop fast move up
-gan fan from recent move and one dating back to Nov '22 coincide
-lost support of 50ma on 12h tf
conclusion: before any significant move upward,
i think that bitcoin will first reclaim liquidity around
the 97,700-99,988k zone. if support lost there, next zone below would be ~90,225k. this could either be a deswelling of momentum into a further drop, or a compression event, indicative of a rapid, significant move, possibly beyond current ATH ranging up to 181,678 thousand dollars or there abouts.
Im building a position broken up into many parts to wait out this long grind we have ahead of us.

GBPCAD : SELL SETUP FORMED IN 4RSell @ 1.8460 or below
Target : 1.8225, 1.8000
Stoploss : 1.8560
Sell breakout and pullback done. Short entered at 1.8460

XAUUSD – Are the Bulls Back? Key Reversal Zone in PlayXAUUSD – Are the Bulls Back? Key Reversal Zone in Play
Gold has been consolidating in a tight range for several sessions, but both macro and technical indicators are pointing to a potential breakout. With volatility expected to rise, traders should keep a close eye on these high-probability zones.
🌍 Macro Overview – Is the Tide Turning for Gold?
📉 The Fed remains hawkish, but market sentiment has shifted, with over 65% probability priced in for a rate cut in September. This adds pressure on the dollar and offers upside potential for gold.
💸 10-year US Treasury yields are stabilizing, reducing the opportunity cost of holding gold and reigniting interest from risk-averse investors.
⚠️ Ongoing geopolitical risks in the Middle East and Eastern Europe continue to fuel demand for safe-haven assets.
🏦 Central banks, especially in China and India, are steadily increasing their gold reserves — a bullish long-term signal for the market.
📊 Technical Outlook – Watch the Fair Value Gap (FVG)
The 3325–3327 support zone aligns with an unfilled FVG on H1-H4 charts, providing a key area for bullish momentum to resume.
Sustained price action above this level may open a path toward 3360 and beyond.
Conversely, if price reaches the 3398–3400 resistance area and shows signs of exhaustion, it could trigger a short-term pullback.
✅ Trade Setup
🟢 BUY ZONE: 3327 – 3325
SL: 3320
TP Targets: 3330 → 3335 → 3340 → 3345 → 3350 → 3355 → 3360 →
🔴 SELL ZONE: 3398 – 3400
SL: 3405
TP Targets: 3395 → 3390 → 3386 → 3380 → 3375 → 3370 → 3360
⚠️ Final Thoughts
The gold market is approaching a decision point... With the PCE and US GDP data due this week, traders should expect a potential volatility spike.
Risk management remains key — wait for confirmation at key levels, stick to your plan, and don’t let emotions override discipline. This week could offer strong directional moves for gold, but only for those prepared.

Fundamental Market Analysis for June 23, 2025 EURUSDThe EUR/USD exchange rate fell to around 1.14900 at the start of the Asian session on Monday. The US dollar is strengthening against the euro (EUR) amid US President Donald Trump's decision to join Israel's war against Iran, which has sharply escalated the conflict. Traders will closely monitor developments surrounding the conflict in the Middle East.
Over the weekend, the US entered the conflict between Israel and Iran when American military aircraft and submarines struck three Iranian targets in Iran, Fordow, Natanz, and Isfahan. Trump said Iran's key uranium enrichment facilities had been “totally destroyed” and warned of “much more severe” strikes if Iran did not agree to peace. The rise in tensions following the US bombing of Iranian nuclear facilities is contributing to the rise in safe-haven currencies such as the US dollar and is having a negative impact on the major currency pair.
Earlier this month, the European Central Bank (ECB) cut interest rates for the eighth time this year to support the eurozone's sluggish recovery, but made it clear that there would be a pause in July. ECB President Christine Lagarde said that rate cuts are coming to an end, as the central bank is now “well positioned” to deal with the current uncertainty. The ECB's hawkish tone may help limit the euro's losses in the near term.
Trading recommendation: BUY 1.15000, SL 1.14600, TP 1.15800

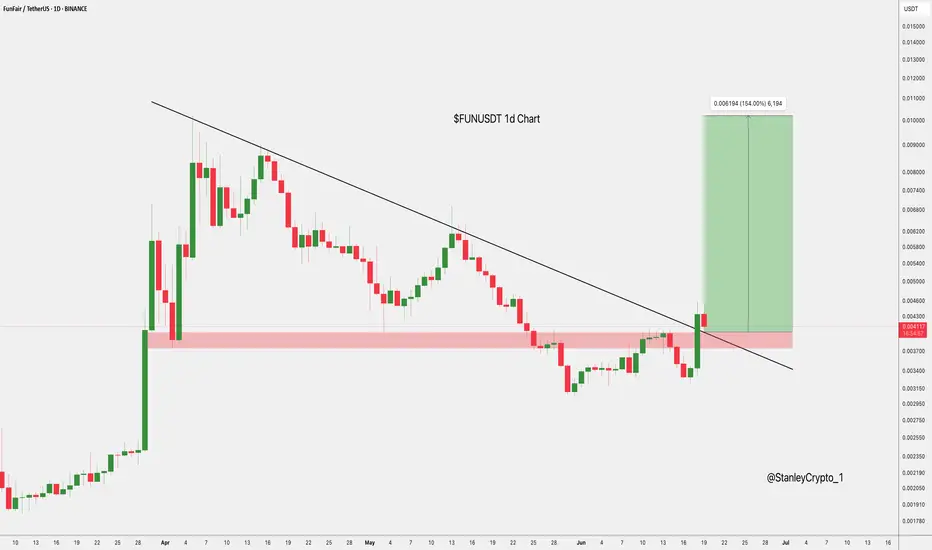
$FUNUSDT Breakout Setup NYSE:FUN has broken out of a long-term downtrend with strong bullish momentum.
It’s now retesting the breakout zone, which also aligns with a key support area.
If this level holds, the next target is 0.010199, a potential 154% move.
Clean breakout-retest setup in play.
DYRO, NFA