#XAUUSD Expectation for Goldin my opinion the is high expectation for the gold going up the the 1696.25 level if respect it can back the down side until 1682.25 however if you have a strong break down " 1682 " level then the price will going down to the " 1663.35 "
Analytics

#S&P500 Expectation High expectation for the price Will Going Down To the 283.3 Level if break the 2841.9 level
however can respect the yellow zone

#AMZN expectation for 30/04/2020High Probability for the #AMZN going down to "2311.5" if the price break the 2363.26 However if bread the 2380 then will going up the "2414.05"

Expectation for #AAPL 4/29/2020High Probability the Price Will Going Down To 277.15 Level If respect will back to the up side however if we have a strong BREAK for the 277.14 Level then the price for sure will down to the 274.9 maybe 274

#HOG Expectation high probability for the "Harley Davidson" Price down to the 20.40 if we have a strong break for the 21.46 level However the price can respect the 21.46 level and going up

#AAPL expectation High Expectation for the AAPL if the price respect the 282.3 Level Back down to the 278 down side .however if we have a strong break to the up side we can have the next target 286

Expectation for the #NvidiaHigh Expectation for the Nvidia going up if we have strong break for the 0.5 level
however the price can respect this level and back to the down side

#BTC Expectation i expect the price will up to 7745 if break the 0.38 level maybe back down if respect the 0.5 but if we have a strong break for this level maybe will continued to the up side

#RY Expectation for the next week Expectation for the price up to 59.66 after if break the 0.5 level will going up to 0.38 level if the price respect the 0.5 level then will back to the down

A reversal formation is possibleThe double top pattern is formed on the 1-day timeframe. At this time, the formation has not yet been confirmed. Conservatively enter the short only after its confirmation, that is, after breaking the support level of 6600-6700$.

GBPUSD - The Growing Wedge:# Technical_analysis_and_comments:
Good day, dear investors and colleagues traders!
Your attention a technical analysis of the currency pair #Gbpusd:
The currency pair has not practically changed relative to the last close, although the pair made an attempt. The contracting range creates the classic “Growing Wedge” trading figure, which suggests a decline to 1.22-1.20.
The currency pair demonstrates the normal performance of standard indicators of price and volume.
We expect a decline to the lower border, its breakthrough and fixation under it.
This week suggests a constant news flow of macroeconomic statistics for the UK, and given global trends, they will clearly be negative.
Levels of mathematical support and resistance for the current week:
a) Support: 1.2392, 1.2280 and possibly 1.2152;
b) Resistance: 1.2634, 1.2760 and possibly 1.2874;
Market participants are strained by the growing third deficit in the UK under current conditions, but 2 negative factors can immediately add to this: uncertain Brexit and the weakness of the British economy.
Manager of WMCI Asset Management Indirect Management Fund Sergey Melnikov.
Regards to subscribers,
Ltd ”Wermelgion and Partners Investment”

EURUSD - and again the triangle:# Technical_analysis_and_comments:
Good day, dear investors and colleagues traders!
In this article, we examined the technical side of the #EURUSD currency pair:
The currency pair completed the decline last week, leaving the ascending channel and forming a tapering triangle, the vertices of which you can see on the chart.
A currency pair demonstrates normal indicators of standard indicators of price and volume.
Which makes it possible to use trade both inside the triangle, and in case of breaking it.
Levels of mathematical support and resistance for the current week:
a) Support: 1.0793 and 1.0713;
b) Resistance: 1.0971, 1.1069 and possibly 1.1149;
Volatility should increase this week, as there will be very many, most likely negative statistics and all the attention of investors will be focused on the locomotive of the Eurozone - Germany.
Manager of WMCI Asset Management Indirect Management Fund Sergey Melnikov.
Regards to subscribers,
Ltd ”Wermelgion and Partners Investment”
!Attention: Trading financial instruments and (or) cryptocurrencies is fraught with high risks, including the risk of losing part or all of the investment, therefore it is not suitable for all investors. Cryptocurrency prices are extremely volatile and can change due to external factors such as financial news, legislative decisions or political events. Margin trading leads to increased financial risks.
Ltd ”Wermelgion and Partners Investment” and any provider of the data contained on this website disclaim liability for any loss or loss incurred as a result of trading transactions made with reference to the information provided.

EUR/GBP - new triangle:# Technical_analysis_and_comments:
Good day, dear investors and colleagues traders!
Your attention a technical analysis of the currency pair #Eurgbp:
All last week, the currency pair spent in a narrow trading range sandwiched between a downtrend and a new support level - 0.8685, thereby forming a new triangle.
The currency pair demonstrates the normal performance of standard indicators of price and volume.
As a result of this, we can safely say that if the downtrend persists, the next target for the bears will be - 0.8574, which is the Fibonacci support level of 76.4% of the past uptrend.
If the currency pair can break through the downtrend and gain a foothold above it, then the first target for long positions will be 0.8745, psychological mark 0.88 and possibly 0.8883 (50% Fibonacci support).
This week suggests a constant news flow of macroeconomic statistics for the UK, and given global trends, they will clearly be negative.
Market participants are strained by the growing third deficit in the UK under current conditions, but 2 negative factors can immediately add to this: uncertain Brexit and the weakness of the British economy.
Manager of WMCI Asset Management Indirect Management Fund Sergey Melnikov.
Regards to subscribers,
Ltd ”Wermelgion and Partners Investment”
!Attention: Trading financial instruments and (or) cryptocurrencies is fraught with high risks, including the risk of losing part or all of the investment, therefore it is not suitable for all investors. Cryptocurrency prices are extremely volatile and can change due to external factors such as financial news, legislative decisions or political events. Margin trading leads to increased financial risks.
Ltd ”Wermelgion and Partners Investment” and any provider of the data contained on this website disclaim liability for any loss or loss incurred as a result of trading transactions made with reference to the information provided.

Head and shoulders pattern on 4 hours The head and shoulders pattern was formed on the 4-hour timeframe. If the support level 6600-6700 will be broken, I expect the price to continue falling.

Cup with handle on the etherI expect the formation of this pattern to be completed and, if the resistance level 173.55-176.4$ is broken, I expect the price to rise.

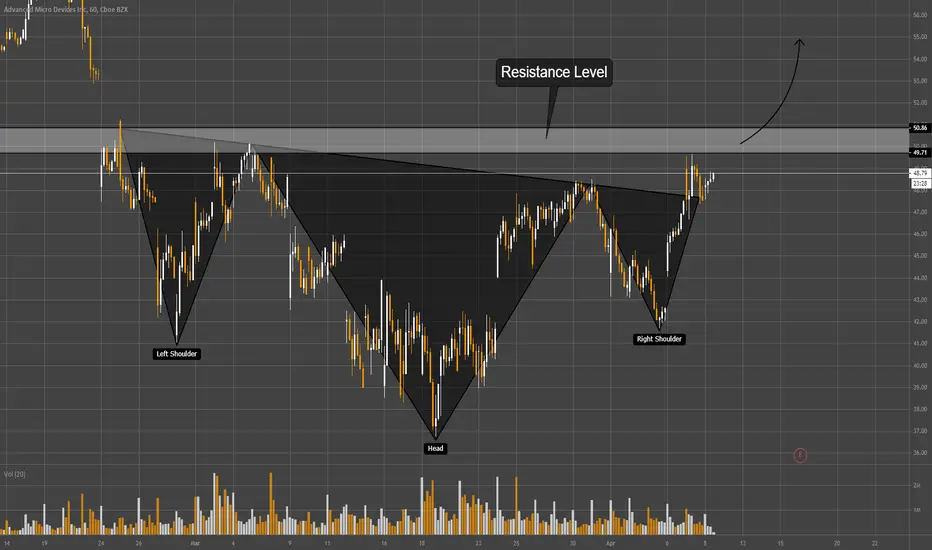
Inverse Head And Shoulders on AMDIf the resistance level 49.71-50.86 is broken, I expect growth of quotations.
Wedge on timeframe 1 dayThe wedge was formed on timeframe 1 day. I expect growth of quotes if the price breaks the upper limit of the pattern.


Triangle with a flat topGrowth will continue if the price manages to break through the resistance level of 9830-9850$.

Bitcoin - long-term longMonthly candle was closed as bullish engulfing. I expect great growth of Bitcoin for a month and beyond.

Head and Shoulders on J&JPrice consolidates below the resistance level 134.25-136.55 and the trend reversal model was formed. If bulls manage to break through this level, I expect price growth.

GBPUSD#5:---> Hold the sell:Good day, dear investors and colleagues traders!
To your attention, an analytical look at the currency pair #Gbpusd:
Comment_for_went_week:
The currency pair spent the entire trading week in the range of 1.2475-1.2231 last which is the Fibonacci support of 23.6% of the last movement.
The asset closed the trading week with a decrease of 200 points. The coefficient R also decreased to 282 points from 1046 the year before last.
Technical analysis:
Globally (D1-W1):
We are seeing a downward channel, which began in June 2016, and received confirmation in February-April 2017. The most incredible thing is that the lower border of the channel is at around 1.06, but the question is, will we reach the next 3 months?
Locally (H1-H4):
The currency pair was in the range all week, and further movement limited the Fibonacci resistance from the movement 09.03-19.03 = 1.2510 (61.8%). And most likely, we will see new declines.
Mathematical resistance and support levels for this week:
~ will be available on Monday:
a) Resistance: 0.0000, 0.0000 and 0.0000;
b) Support: 0.0000, 0.0000 and 0.0000;
Indicative_analysis:
* Leading indicators: Left the overbought zone and sank into the normalized zone.
* Price behavior indicators: Demonstrate the return of the price to a "normal state".
* Trend indicators: show a trend-down.
Final recommendations:
We continue to hold the sale from 1.2382
The positions of the WMCI Asset Management Indirect Management Fund are always available for online monitoring.
If you are interested in cooperating with us and also if you need a link to public monitoring, please contact us by email: wmci.messagecenter@gmail.com.
Regards to subscribers,
Ltd ”Wermelgion and Partners Investment”
!Attention: Trading financial instruments and (or) cryptocurrencies is fraught with high risks, including the risk of losing part or all of the investment, therefore it is not suitable for all investors. Cryptocurrency prices are extremely volatile and can change due to external factors such as financial news, legislative decisions or political events. Margin trading leads to increased financial risks.
Ltd ”Wermelgion and Partners Investment” and any provider of the data contained on this website disclaim liability for any loss or loss incurred as a result of trading transactions made with reference to the information provided.
