XRP: Bullish -IF- support holdsPossible inverted H&S ( or ascending triangle -IF- support area holds.
Stop below support.
A morning star on next weekly close would be an encouraging signal.
AND

Possible Downward Tilted Cup & Handle On Altcoin Total MarketcapNot sure how often ones that have his much downward tilt actually trigger but something worth keeping an eye on all the same. Neutral until I see confirmation fo some sort of breakout.

ETHBTC Inverse Head and ShouldersHello Traders,
New Thesis on ETHBTC
Points to consider,
- Potential Inverse head and shoulders playing out on the 1hr time frame
- 12 EMA riding as support in to strong resistance, this needs to break for the head and shoulders pattern to be confirmed
- RSI on uptrend with strong support
- Volume declining on right shoulder
- VPVR showing low volume of transactions after resistance zone
ETHBTC could have a pop to the upside, this will only happen if BTC decides on its direction, the market is dictated by BTC's action, if BTC starts to consolidate on the daily, then the chances of this head and shoulders playing out will be more probable...
what are your thoughts? please leave a like and comment,
and remember
“What seems too high and risky to the majority generally goes higher and what seems low and cheap generally goes lower.” – William O’Neil

SP 500, SPX, aka ES could go parabolic of we cross 2975 to 3000 We are coming up from a 4th wave elliot correction, this could be the start of 5 waves up complex and impuslive. or we could go down. In any instant the odds are 50/50 % that is a fact
but if we go up and cross those levels i am long.

profit on the BTT pump and dumpClassic whale accumulation on the minor downtrend. Followed by trollbump andfooling bears into what looks like the dump. However the next pump will be insane and will rival TRX's pump and dump. Over 100% profits to be made here.
Needless to say this is high risk high return. First targets above 1800

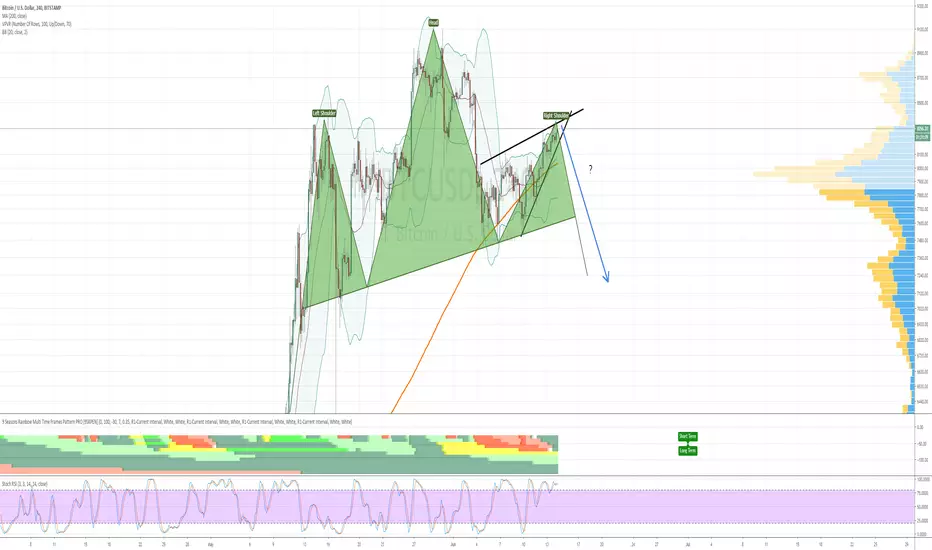
Head and shoulder plus rising wedge: Probability for correction So there's a H&S-ish looking pattern going on here. However, I am not 100% sure, as this looks a bit distorted.
Then there's also a rising wedge at the same time, which tells a higher probability for downside as well.
But as the last times BTC just wonderfully ignored any TA, I am not sure myself this time.
BTC maybe wants to make it look as if an imminent correction would occur, just to go berserk and pump to 12k.
So, I am not trading this pattern here, just observing.
The fearless among you could try to trade this pattern, by opening very slight shorts, with tight SL's at maximum 8450.
Good luck and let's see what BTC is up to :)

Litecoin making crazy gains against btc; ltcbtc forming c&hLikely due to the halving that's set to occur in August I believe.

I sure hope some whales help us out of this head and shoulders.I am seeing a head and shoulders pattern.

dabur india on upmove....bullish sentiment is on"HIGHER SIDE"ON WEEKLY CHART DABUR INDIA IS SHOWING A TREMENDOUS BULLISH SIDE WITH "W" chart formation,i have indiacted my view/personal opinion that is stock will boom up to the level as indicated by me on chart with optimal risk and reward ration.


XBT 1HR potential head and shouldersPotential head and shoulders within a few fib channels, we'll see how it plays out (just ideas)


CHFHUF Head and Shoulders Forming at Major Resistance?On the 1hr chart it looks like CHFHUF is forming a Head and Shoulder pattern, what would confirm a reversal at the resistance shown on the right daily chart .
A strong resistance on the right daily is tested with the head of this potentially H&S .
The combination of these makes this a great R:R trade to try, even if this is not forming an H&S there is still this strong resistance for backup.
Thanks for reading and feedback is welcome!
Wesley

NZDUSD buyHas broken out of a falling wedge and is forming a sort of head and shoulders, there has been a major rejection from the EMA on a 1 hour time frame which is also a trend line point.


ltcbtc chart at a cross roads.We can see LTC had a very ncie pump against btc after its ltcbtc golden cross occurred on the daily....it has since corrected and appears like it may have a chance at triggering a cup and handle pattern...however the threat of a 1 day ltcbtc death cross quickly approaches. If the death cross is to materialize this cup and handle pattern will most likely fail...and on the flipside validating this cup and handle pattern could help prevent the death cross...so for now against btc ltc is at a cross roads and could easily continue either way, For this reason this idea will remain neutral.

LTC has an opportunity to reach $179 if it confirms daily c&hLooking very bullish breakout should likely be confirmed soon enough. This is essentially just saying the same thing as my march ltcusd chart says, except now the handle of the cup and handle is not only an inv H&s but a smaller cup and handle itself as well.

TRXBTC not looking as bullish as TRXUSDIt appears we will bullishly trigger/break an adam and we've double bottom pattern on the daily on the trxbtc chart however we must keep in mind tha since we recently had a deathcross on this chart more losses against btc are anticipated after it hits its breakout target. I assume it will get rejected back down from the 1day 200ma resistance and be bounced back and forth between it and the 1 day 50ma(in orange) as support a couple times before breaking under and hopefully forming a higher low...if it ends up forming a lower low more loss against btcs value at that time will be probable. I do see it likely it can reach the breakout target in the meantime however. If somehow it continues up then we may have a deathcross fakeout on our hands which given the current overall sentiment of the crypto market in generally is much more probable than it would normally be. until we see evidence of a death cross fake out though we must put the downside as probabilities preference. My guess is a quick typical tron pump and dump due to an announcement of an announcement from Justin Sun. It can be a rewarding ride though if you time your entrance and exit right. *not financial advice* Thanks for reading.

Potential cup and handle on trx can take it to .044 centsWaiting for confirmation first of coursen but it seems like confirmation is about to arrive.
