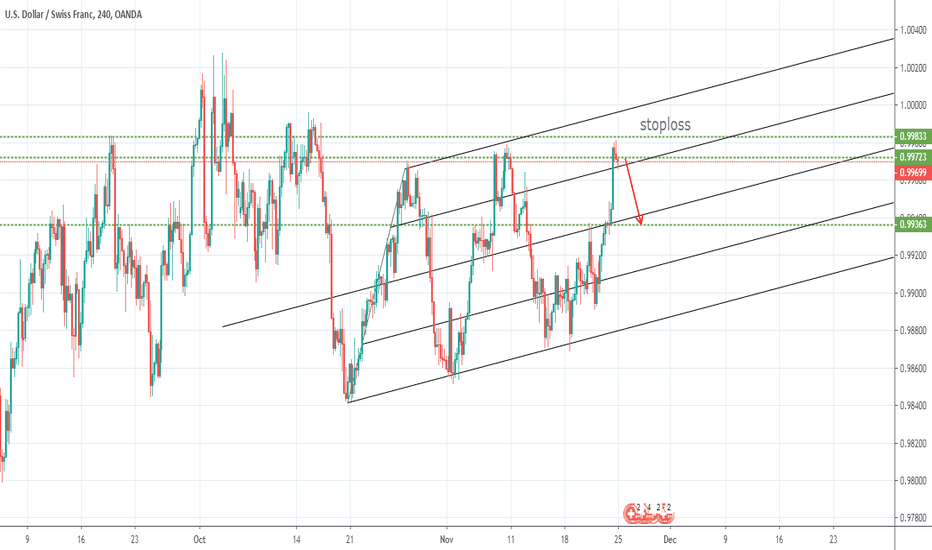
Andrew's Pitchfork
BITCOIN 🔱 Pitchfork of Hope 🕊️
Multi-year logarithmic trend line... failed. But there is a massive Pitchfork of Hope .
Pivot point is a historical wick down from parabolic move, which set the median price of Bitcoin for the years ahead.
Will we Double Bottom? Maybe once the supply of sellers are exhausted and volume fades.
Watching BTC Hash Rate for the Buy Signal if it crosses above the 21 Week Signal Line (must enable show crosses)!
A Reason For Massive BullishnessMost of my charts have been bearish on cryptos, I've been expecting a correction to $7k or so before a run back to the teens.
However this pitchfork on the total marketcap of all cryptos shows that we are hugging a long term support trend line.
The two usual targets on the pitchfork are the median line and the hagopian line. If it turns out to be bullish then the median line would explode the crypto market cap.
However if it slides off the side of the support line then it will head toward the hagopian. I actually think that's still bullish in the long term because it allows for building a stronger base to push for higher prices.
BTW on this pitchfork I did not use the very bottom of the wick on the left side of the chart because that was due to a pricing bug in one of the markets. The body of the candle is more accurate.
Looking for weakness at pitchfork extensionAt edge of pitchfork extension and poking into bottom area of prior downward pointing wicks.
This is a very good area to watch for momentum weakening and head and shoulders patterns, but plan is to take most profit off at necklines.
BTC is not especially bullish and is actually looking like it could roll over toward the center of the triangle below. That would be a good catalyst to expect trx to test the recent low.
No trade yet, waiting for it to form some upward pointing wicks to show where the rejection area is before shorting.
Ideas for path to major monthly low around .011Looking for an area to add to a swing short on this I entered using the attached chart.
Using a pitchfork seems like it might provide a framework for catching a potential head and shoulders pattern while it completes wave 4 before entering wave 5 that swings below the recent .014 low.
I think as long as BTC is flat it's going to make people get bored with alts and they'll continue to bail on them. So I think following the downward channel will be useful for finding pullbacks as long as BTC remains stuck in the giant triangle.
The reason I'm targeting the major monthly low is that there's basically nothing on the volume profile between the recent swing low and the low from the month chart. Once it's clear of the recent swing low isn't holding support it should trigger stops to the downside.
The main danger from this type of trade is short squeezes, but not major fundamental bullish strength. So I will be looking at squeeze type price action as opportunities to short.


