ankr short trade in my opinion this is a good trade with a good r/r hope hit the tp consider this is my trade not your trade and i just like to share my trades with world
Ankr

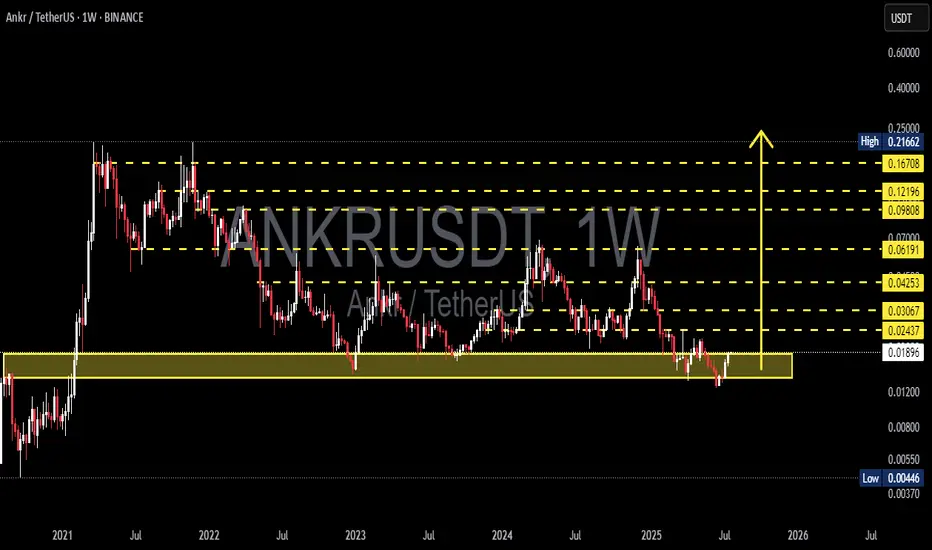
ANKR/USDT – Weekly Macro Reversal from Historical Demand Zone!🧠 Analysis Overview:
ANKR is showing strong signs of a potential macro reversal after bouncing off its historical demand zone around 0.017–0.019 USDT. This zone has proven to be a significant accumulation area in past cycles — fueling major rallies in both 2021 and 2023. The recent reaction at this level could mark the beginning of a substantial bullish leg in the mid-to-long term.
🔍 Pattern & Structure Breakdown:
✅ Demand Zone Re-Tested:
This zone has been tested multiple times over the years and continues to attract buying interest, signaling institutional accumulation.
✅ Potential Weekly Double Bottom:
Price has formed a clear double bottom with a strong bullish rejection candle, indicating buyers are stepping back in.
✅ Macro Accumulation Range:
For nearly two years, ANKR has been ranging between 0.018 – 0.21 USDT. It’s currently at the bottom of that range, providing a high risk-reward opportunity.
✅ Fibonacci Extension Targets:
Well-defined horizontal resistances (in yellow) suggest clear roadmap targets for bullish continuation — ranging from 0.024 to 0.216.
🚀 Bullish Scenario (HIGH PROBABILITY SETUP):
Ideal Entry Zone: 0.018–0.020 USDT
Initial Breakout Confirmation: Above 0.02437
Progressive Targets:
0.03067 – minor resistance
0.04253 – previous swing high
0.06191 – historical supply
0.09808 – 0.12196 – prior distribution zone
0.16708 – 0.21662 – cycle top targets
🎯 Potential Upside: 200% – 1000%+
📈 Trend Reversal Confirmed: Once weekly higher-highs are established
⚠️ Bearish Scenario (RISK MANAGEMENT):
Breakdown below 0.01800 could trigger:
0.01200 (intermediate support)
0.00700 – 0.00446 (macro-level supports)
❗️Bearish Bias Valid: On weekly close below 0.01700 with strong selling volume
🧭 Conclusion:
> ANKR is currently at a critical macro support zone with a technically sound reversal setup.
For swing traders and mid-term investors, this is a strategic area to monitor for potential trend shift.
Tight risk, massive reward.
📌 Strategy Recommendation:
Use DCA (dollar-cost averaging) in the demand zone
Place conservative stop-loss below 0.01700
Watch for breakout with volume above 0.02437 to confirm bullish reversal
#ANKR #ANKRUSDT #CryptoReversal #AltcoinSetup #WeeklyChart #SwingTrade #AccumulationZone #TechnicalAnalysis #LowCapAltcoin #FibonacciTargets
ANKRUSDT 1WANKR ~ 1W Analysis
#ANKR Buy back when testing this support with a short -term target of at least 15%+.

ANKRUSDT(Ankr) Updated till 24-03-25ANKRUSDT(Ankr) Daily timeframe range. many alts got similar pattern. pushing back from its new low. if those alts can defend their new low they got long way to go. now recent resistance at 0.02244 it will be optimal if it can get over it.

ANKRUSDT – Watching Key Support Zones!I’ve marked the blue boxes as potential strong support levels—this is where smart money might step in! But remember, just because a level looks good doesn’t mean we blindly buy.
📊 How I’m Trading This:
✅ Step 1: Watch for CDV confirmation—is volume supporting the move?
✅ Step 2: Look for LTF market structure shifts—is price breaking upwards on lower time frames?
✅ Step 3: If support holds + volume confirms = I take the trade. No confirmation? I wait.
💡 Patience Pays:
The market doesn’t care about emotions. Most traders jump in too early and get stopped out. I let the market show its hand first. That’s why I catch moves before they happen.
🔥 Final Thought:
If price suddenly breaks below without support forming, I will not insist on a long. But if we get a strong reaction + a retest? Then it’s game time.
📈 Follow for precision trades—because guessing is for amateurs. 🔥
A tiny part of my runners:
🎯 ZENUSDT.P: Patience & Profitability | %230 Reaction from the Sniper Entry
🐶 DOGEUSDT.P: Next Move
🎨 RENDERUSDT.P: Opportunity of the Month
💎 ETHUSDT.P: Where to Retrace
🟢 BNBUSDT.P: Potential Surge
📊 BTC Dominance: Reaction Zone
🌊 WAVESUSDT.P: Demand Zone Potential
🟣 UNIUSDT.P: Long-Term Trade
🔵 XRPUSDT.P: Entry Zones
🔗 LINKUSDT.P: Follow The River
📈 BTCUSDT.P: Two Key Demand Zones
🟩 POLUSDT: Bullish Momentum
🌟 PENDLEUSDT.P: Where Opportunity Meets Precision
🔥 BTCUSDT.P: Liquidation of Highly Leveraged Longs
🌊 SOLUSDT.P: SOL's Dip - Your Opportunity
🐸 1000PEPEUSDT.P: Prime Bounce Zone Unlocked
🚀 ETHUSDT.P: Set to Explode - Don't Miss This Game Changer
🤖 IQUSDT: Smart Plan
⚡️ PONDUSDT: A Trade Not Taken Is Better Than a Losing One
💼 STMXUSDT: 2 Buying Areas
🐢 TURBOUSDT: Buy Zones and Buyer Presence
🌍 ICPUSDT.P: Massive Upside Potential | Check the Trade Update For Seeing Results
🟠 IDEXUSDT: Spot Buy Area | %26 Profit if You Trade with MSB
📌 USUALUSDT: Buyers Are Active + %70 Profit in Total
🌟 FORTHUSDT: Sniper Entry +%26 Reaction
🐳 QKCUSDT: Sniper Entry +%57 Reaction
📊 BTC.D: Retest of Key Area Highly Likely
📊 XNOUSDT %80 Reaction with a Simple Blue Box!

ANKR Ready for PUMP or what ?If the price holds this support level, there is a possibility of the price increasing up to the channel ceiling.
Give me some energy !!
✨We spend hours finding potential opportunities and writing useful ideas, we would be happy if you support us.
Best regards CobraVanguard.💚
_ _ _ _ __ _ _ _ _ _ _ _ _ _ _ _ _ _ _ _ _ _ _ _ _ _ _ _ _ _ _ _
✅Thank you, and for more ideas, hit ❤️Like❤️ and 🌟Follow🌟!
⚠️Things can change...
The markets are always changing and even with all these signals, the market changes tend to be strong and fast!!

Will ANKRUSDT Finally Break Out? Key Levels to Watch Now!Yello, Paradisers! Is ANKRUSDT gearing up for a breakout, or is more downside coming? Let’s break it down.
💎ANKRUSDT has been forming a well-defined descending channel with a triple zig-zag pattern and bullish divergence, increasing the probability of an upcoming bullish move.
💎For a confirmed breakout, ANKRUSDT must show strength, break above the descending channel and resistance, and close a candle with strong volume. If that happens, the probability of a bullish move significantly increases.
💎In case of a retracement, a short-term bounce could be possible if we get a bullish Internal Change of Character (I CHoCH). However, considering the broader crypto market conditions, this remains a low-probability setup.
💎On the other hand, if we see panic selling, leading to a breakdown and candle close below the key support level, it will invalidate the bullish setup entirely. In that case, it’s best to wait for a stronger price action formation before taking any trades.
🎖 Patience and discipline are key in such setups, Paradisers. The market will always offer new opportunities—our job is to wait for the highest probability trades and execute with confidence. Stay sharp!
MyCryptoParadise
iFeel the success🌴

ANKR's gonna decrease But...!BINANCE:ANKRUSDT
last time we talked about ANKR, It was still in the triangle.
but now the price is in a bearish situation!
if you expect the price would decrease as much as it's measured movement (AB=CD) the price shall reach a support so strong that would be the ultimate comeback for ANKR!😍
If you take a look back at the chart,The last time the price was there was around 13 years ago! and afterward the price went to the moon!
IT can be the ultimate turning back point for ANKR!
⚠️ Disclaimer:
This is not financial advice. Always manage your risks and trade responsibly.
👉 Follow me for daily updates,
💬 Comment and like to share your thoughts,
📌 And check the link in my bio for even more resources!
Let’s navigate the markets together—join the journey today! 💹✨

Ankr - Real Altseason indicatorSince 2021, every mini alt season cycle has reached the red zone, forming a top. It appears that the red zone marks the top for mini-alt seasons, while the green zone serves as the floor.
In the main alt season, I anticipate the red zone breaking to the upside.

can we say what is gonna happen to ANKR?BINANCE:ANKRUSDT
ANKR is gonna have a touch time!
we can't really say what will happen cause no break out has happened yet!
when It happens the price will change according to the measured movement (AB=CD)
wait for confirmation (Break out)
⚠️ Disclaimer:
This is not financial advice. Always manage your risks and trade responsibly.
👉 Follow me for daily updates,
💬 Comment and like to share your thoughts,
📌 And check the link in my bio for even more resources!
Let’s navigate the markets together—join the journey today! 💹✨

ANKRUSDT 1WANKR ~ 1W Analysis
#ANKR So far this support block continues to be maintained in Time Frime 1W. Buy from here if you still have a Conviction on this coin with a minimum target of 20%+

ANKRUSDT 1WANKR ~ 1W
#ANKR This support block is the golden ratio. if you still have Conviction on this coin,. Buy from here with a minimum target of 20%++

Will #ANKR See Another Bullish Push From the Bulls? Key LevelsYello, Paradisers! Is #ANKRUSDT poised for a breakout, or are we heading deeper? Let’s break down this critical setup for #Ankr:
💎#ANKR has been trading within a descending channel on the 4-hour chart. The price is approaching the descending resistance of this channel and the next few candles will determine whether bulls are ready to take control.
💎For #ANKRUSD to confirm a breakout, it must decisively close above the $0.0406 resistance level. This would open the door to a rally towards the major resistance zone at $0.0485, where sellers may return in force. A strong breakout here could fuel momentum for further upside, potentially targeting even higher levels.
💎If buyers push the price above $0.0485, it will signify a major shift in market sentiment, and we could see #ANKR head toward $0.0580 or higher. To confirm this breakout, you need to watch for increased trading volume and strong bullish candles. Without these signals, any upward move risks being a fakeout.
💎On the flip side, failure to break the descending resistance could lead to a pullback toward the $0.03307 support level. If this support doesn't hold, the price may retest the demand zone at $0.02776.
💎A 4-hour candle close below $0.02776 would invalidate the bullish setup and could trigger a sharp decline toward $0.02500 or even lower. Traders should exercise caution if this scenario unfolds.
Stay focused, patient, and disciplined, Paradisers🥂
MyCryptoParadise
iFeel the success🌴

TradeCityPro | ANKR: Weekly Long-Term Box and Gradual Channel👋 Welcome to TradeCityPro!
In this analysis, I will examine the ANKR coin, which is part of the infrastructure for Web3 and other blockchain projects, with significant partners like Binance and Polygon.
📅 Weekly Timeframe: Long-Term Box with a Slight Incline Channel I will perform this analysis mainly using Fibonacci levels to identify crucial areas. In this timeframe, we can see the price movement from the previous alt season, which had significant growth followed by a decline after breaking the 0.236 Fibonacci level, correcting down to the 0.5 Fibonacci level.
🔍 The support at $0.01728, which coincides with this Fibonacci level, is currently the most crucial support on this chart. Since the price bottomed out in this area, we have seen a very gently sloping upward channel that has reacted three times and had one fake break above the ceiling before returning to the box.
📊 Given the greater ratio of buying to selling volume, I see a higher likelihood of the channel breaking upwards and the price increasing. The RSI has also risen from the 50 level, which could generate bullish momentum. The current main ceiling appears to be $0.06131, which coincides with the 0.236 Fibonacci level and represents a strong resistance.
📈 If the price rises and breaks through $0.06131, the next resistance will be at $0.19012, which is the all-time high (ATH) for the price. I will determine higher targets using Fibonacci extensions.
🔽 In a bearish scenario, the first support is the dynamic floor of the channel. If this support breaks, the primary supports at $0.02223 and $0.01728 are very important levels, and reaching any of these supports could introduce bullish momentum into the market and prevent further declines. If these supports break, the next support will be at the 0.618 Fibonacci level.
✨ Moving on to finding targets based on Fibonacci, as you've seen, the price has corrected to the 0.5 Fibonacci retracement and has good momentum for continuing the upward move. According to Fibonacci rules, when a price corrects to 0.5, the likelihood of moving to the previous high with a break increases.
🧩 The previous price peak is at $0.19418, which coincides with the 0.5 Fibonacci extension. From a market cap perspective, this coin's price could move up to $0.34361. Therefore, we can consider logical targets between $0.19418 and $0.34361. Although the target box size is large and nearly 100% different, this is a weekly trend, and this target is approximate; we must wait for the price reaction to this range to find a more precise target.
🚀 I believe this range is a logical target for this coin, but if the market cap of the project increases and it becomes one of the more significant cryptocurrencies, the price could potentially move to the 1 or even 1.272 Fibonacci points.
📝 Final Thoughts
This analysis reflects our opinions and is not financial advice.
Share your thoughts in the comments, and don’t forget to share this analysis with your friends! ❤️

ANKR LongAnkr on the daily has confirmed a partial decline and has a 70% chance of breaking out of it's range to the upside.
The weekly has everything.
- Bullish divergence
- Bullish developments on the indicators
- Above key support level
-Three rising valleys indicating accumulation
We're not using leverage on this trade but it is one of our favourite assets to hold within these defined levels. Let's see how it goes.

Ankr’s breakout target from invh&s can bring 95% gains if soonAnkr is very close to completing its right shoulder on this fairly thicc inverse head and shoulders pattern it has formed. Hard to tell exactly when it will breach the neckline but one would assume that it’s probable for it to happen soon. *not financial advice*

ankr brreaking out expecting 300% in midterm Ankr Seems Like Finally Ankr Time Has Come Same Multiyear Symmetrical Triangle Breakout Happening ( CRYPTOCAP:XRP CRYPTOCAP:XLM CRYPTOCAP:DOGE ) And Many Others Gives Massive Profit After Breakout From Ankr Expecting 300% In Midterm

ANKR is about To do a Bullish movementAs you can see, the price has broken this triangle, and if we follow the Fibonacci strategy, considering that the bullish market cycle has just started, we can expect the price to rise to 0.618.
Give me some energy !!
✨We spend hours finding potential opportunities and writing useful ideas, we would be happy if you support us.
Best regards CobraVanguard.💚
_ _ _ _ __ _ _ _ _ _ _ _ _ _ _ _ _ _ _ _ _ _ _ _ _ _ _ _ _ _ _ _
✅Thank you, and for more ideas, hit ❤️Like❤️ and 🌟Follow🌟!
⚠️Things can change...
The markets are always changing and even with all these signals, the market changes tend to be strong and fast!!

#ANKRUSDT Ready for a Major Move After the Breakout | Watch OutYello, Paradisers! Are we about to witness a game-changing move for #ANKR? Let's discuss latest analysis of #ANKRUSDT:
💎After 4-5 months of grinding through a downtrend, #Ankr has finally broken out of a descending channel, thanks to a solid push from the bullish order block (OB) at $0.023. While this could mark a potential turning point, we’re not in the clear just yet.
💎For this rally to truly gather momentum, #ANKR must break above the critical Bearish OB between $0.031-$0.033, which previously acted as support. If bulls can push it past this level, we could see a stronger move toward the next significant resistance, driven by rising volume and the support of the 20EMA, signaling bulls might be taking charge.
💎However, if this momentum stalls, watch for a pullback to retest the breakout zone around $0.023. A failure to hold this support could trigger a move back to the lower demand zone at $0.0196.
💎A break below $0.0196 would shift control back to the bears, likely leading to a deeper correction and dashing hopes of a bullish recovery in the short term.
Stay focused, patient, and disciplined, Paradisers🥂
MyCryptoParadise
iFeel the success🌴

$ANKR is about to take off!An asset in which there are no funds already, technically looks attractive, but only for speculation. My interest level is 1.618 Fibonacci.
Horban Brothers.

AnkrAnkr technical analysis is straightforward; almost. An impulse upward wave is followed by a corrective downward wave. After the corrective wave finished at Fibonacci retracement of 0.5, the price broke the downtrend line and it seems the next impulse wave has started. It is worth mentioning that Ankr has partnered with Microsoft, so there is a bright future for this coin. Let's see what happens.

#ANKR 1D: Potential 2x-5x Move. 11/27/24Ankr leverages shared resources to provide simple and affordable blockchain node hosting solutions. Founded in November 2017, it has developed a marketplace for container-based cloud services by utilizing shared resources.
The project currently has a market capitalization of about $400 million. All tokens are already in circulation with no further issuance planned, signaling potential for future growth.
I will be accumulating from current levels and adding 2-3 pending orders down to $0.03350 (if it even gets there, which I personally doubt). Targets are indicated on the chart. Potential movement ranges from 2x to 5x from current levels.

BAT and ANCHR and maybe GLM good for a run?GLM is about to breaks some long term resistance if it can break free, just a little higher as you see top of channel on the chart. Also Bat has broken out of s hort term trend and looks interesting for a potential run.
i like GLM anyway, its always easy to trade a conviction because you dont mind holding it if you need to. GLM is distributed compute, they have added GPU and they now provide hosting for language models on decentralized compute, fundamentally speaking they are in a fantastic place to me and with a <$500M market cap. I also work in AI a bit so I may be biased there as well, but keep an eye, it breaks that line, it should be a pretty good run.
Order books look great on these, lots of traders expecting the price to go up with far out of the money asks.
Also ANKR just broke out and set old resistance as support, it should be due for a good run any time now.
ANKR break out:
Bat double break out:
BTC has staged a larger scale break out:
BTC zoomed in:
This is why you need to watch for right now and how we could pull back to $95k but no big deal its still way bullish where we are right now.
Watch BTC though, it could pull back any time its at some resistance too and could pull back to $95k before moving back up. If it pulls back hard, it will take everything with it for the most part.
