ANKR/BTC Bull flag TA Update#ANKR/BTC TA Update
( follower request )
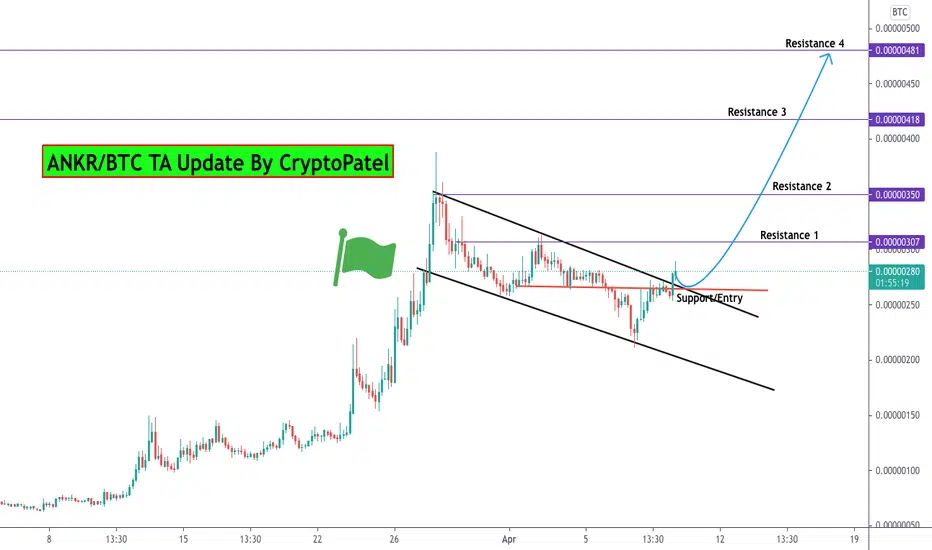
#ANKR now bullish because now broke out bull flag resistance .
So we can buy some for short term gain.
Never invest too much in this tike because already 20x up from bottom.
Entry:- 260-280 Satoshi
Targets:- 307/350/418/481 Satoshi
Stop Loss:- if any Big time frame candle close below 250 Satoshi then strictly exit.
No emotion.
Support:- 250 Satoshi
Please click LIKE button and Appreciate my hard work.
Must follow me for latest crypto reap time updates.
Thank you.
Ankrusd

ANKR USDT IdeaAlready Break out in lower timeframes
also, there is hidden bearish divergence in rsi and the price moving below Kumo clouds, so it should close some candles above the green line for more confirmation otherwise it can go lower

My first post and idea here.Maintaining Fib levels after reaching what I believe to be an inflection point.
MACD on the 4 hour crossing to what seems to be a bullish cycle, possibly converging on the daily.
Fundamental Analysis:
ANKR is a cloud computing provider that specifically focuses on hosting blockchain nodes, essentially allowing the layman to begin running an ETH Validator node for a minimal 2 ETH as an insurance deposit. I can see this becoming a gateway to what I would consider the AWS/GCP/AZURE of blockchains.
As a developer, I plan on using ANKR services and look forward to seeing more improvements to come.
Thanks for checking out my idea, if you have any thoughts, I'd love to discuss this service and token further below.
I would love to hear others thoughts and opinions, I personally think the fundamentals of ANKR are airtight.

Possible 15-40% Gains on ANKROverview
- In short would wait until price touches the triangle support(red) for lower risk but if the crypto market pumps, this could give ANKR the boost it needs to see big gains long-term. Let's start from the top!
Price Chart
- 1hr chart with 20/50/200MA's to help indicate future supports or resistances
- As of now, MA's look terrible as I don't tend to trade when the 200MA(red) is on top of the lower MA's.
- Quick note: If the 200MA is above lower MA's, this means trend is bearish
- If price breaks through the 20MA clearly may have enough momentum to break 200MA
- Bullish triangle is a possible pattern as the resistance line(green) has a larger angle and support line(red) is close to horizontal
- Break below $0.147 you don't want anything to do with it at this time
- Overall been seeing breakouts occur when the 20MA and 50MA come in contact with each other so it's possible that's the case here
- Risky trade, big profit, would wait till support(red) is touched before making an entry. But does have the possibility of breaking out before this occurs
RSI
- Showing an inverse head&shoulder pattern which is bullish and could cause a breakout to the first major resistance at $0.182, break that and could head towards the current ATH
MACD
- Not a fan of the signal line(blue) crossing MACD(orange) as this indicates it's time to sell.
- 4hr MACD looks a tad better
Stoch
- 4hr stoch value is indicating it's time for another run up
- Last time stoch was in this range, price rose 25%
4HR Chart
- Text explains chart
Extra Info
- Learn about ANKR here: www.ankr.com
- ANKR VOLUME: coinmarketcap.com
If you enjoyed this analysis or learned something new, please LIKE this idea 👍
FOLLOW for important updates for this coin and helpful trading strategies 🏆
Would also like to know your thoughts! Remember this is not financial advice , however, it is an overview of what I am seeing in this coin's price action.
-Happy Trading
MoneyGrind


Break out happening soon!!We are currently in the buy zone.
The RSI indicates we're in an area of historical support.
The stoch RSI shows we've been compressed for a few days now and this can't last forever..
We are ~35% away from the ATH meaning we've likely experienced the dip. If you're going LONG, I would not wait any longer.
FILUSD is rallying
STORJUSD is rallying
BTCUSD is doing well
SPY near ATH

ANKR buy it before it gets to 1 dollarCheap coin easy to profit x1000 %
Ez profits 2x, 4x, 10x, 100x

Is this the bottom for today?Chart lines say all.
Previous resistance is now support. RSI matches up with trend line.

ANKR USD Bubble is growing be carefull not to get burned !Hello everyone and welcome to my analysis.
Today I would like to make a note of that ANKR chart looks loot a like DOGE chart from a couple months ago and in my opinion there is a high probability of it losing at least 50% of its value. YES I can be wrong about that but lots of people were saying same about BTC in 2018 that it's not top etc. In my opinion buying ANKR at this point is very risky as it's price is more than 3000% UP in past 12 months.
This information is not a recommendation to buy or sell. It is to be used for educational purposes only.
"A is for my attitude working through the patience
Money comes and goes so the M is for motivation
Gotta stay consistent, the P is to persevere..."

ANKR made 1000% after my call !!ANKR / BTC
hi guys do you remember my call on ankr when it was around 24-26 satoshi
Today it made around 1000% in 2 months against btc pair !
And even more in usdt pair because BTC value also increased in this period
Yes it take time but now congratulations for all holders 🎉

ANKR USD update for those who took the trade and target listHello guys on an update to my ANKR analysis from yestarday.
First of all if you did take a trade from my analysis than congratulation on 20-25% profit ! But remember the most important thing about trading is taking profit so this analysis is for information where I'm planing to close my trades.
As first target and closing part of my position at 61.8 retracment which is just above 0.1 $ the next resistance I'm seeing is at 127.2 fibonnaci extension and my final target is at 161.8 fibonnaci extension from where I'm expecting price of ANKR to decline to retest 88.6 or 78.6 fibonnaci levels.
This information is not a recommendation to buy or sell. It is to be used for educational purposes only.
"A is for my attitude working through the patience
Money comes and goes so the M is for motivation
Gotta stay consistent, the P is to persevere..."

ANKR USD nice buy oportunity coming soon !Hello everyone and welcome to my analysis of ANKR.
First of all I would like to point that ANKR to BTC made a new ATH after which it found resistance at 141.8 FIB from where we had a pullback, now I will try to find where we may see a support on ANKR USD pair and where is possible good opportunity to buy. First looking at last rally I would like to point out that 61.8 fib from that is around 0.082 also at 0.08 we have fibonnaci expansion which is highly accurate when it comes to where correction may end.
So as a matter of fact I would like to point that zone between those levels 0.08-0.082 is a great zone to buy ankr. Also pullback to those levels would mean retest of previous resistance and putting this all together we have an answer to what can be a moves on this pair. "A is for my attitude working through the patience
Money comes and goes so the M is for motivation
Gotta stay consistent, the P is to persevere..."
This information is not a recommendation to buy or sell. It is to be used for educational purposes only.

ANKR/USDT : Moving into triangle BINANCE:ANKRUSDT
Hello everyone 😃
ANKR is moving into a triangle and now Indicators are showing bearish signs.
We expect a retest on triangle's lower or also a fake-out !
🔴 Be warned about BTC's short-term correction :
📌 EMA 100 could be a good support for ANKR if it's hold above it...
Attention: this isn't financial advice we are just trying to help people on their own vision.
Have a good day!
@Helical_Trades

ANKR Price in Bullish PennantANKR cryptocurrency price is now in the bullish pennant also made good bounce from the trend line support zone.
bitcoin price and chart also looks stable , bitcoin price holding the 50000 zone very well and moving level by level it can move really high in short time.
You can buy ANKR cryptocurrency here below 0.07
stop 0.060
Target : 0.077 , 0.087 , 0.1 , 0.11
bitcoin trading cryptocurrency trading is very risky so don't invest blindly and follow the trading setup with given stop loss.

ANKR/USDT is about to do a bullish movementHi every one
ANKR / TETHERUS
The ANKR/USDT has formed a symmetrical triangle which means that the price would increase or decrease as much as the measured price movement but there is a strong hidden bullish divergence (+HD) on the MACD indicator which will increase the chance of increasing the price rather than decreasing it.
Things can change...
The markets are always changing and even with all these signals, the market changes tend to be strong and fast!!
Thank you for seeing idea .
Have a nice day and Good luck

ANKR: CHEAP ALT COIN TO CONSIDERI have 2 targets on Ankr . The 2nd one would be a 200% increase from current price.
The coin has already returned 2000% since March, so be careful.

ANKR/USDT expected bullish movement!Hi every one
ANKR / TETHERUS
the ANKR/USDT shows that the price has formed a symmetrical triangle which means that the price can move either way as much as the measured price movement. but notice that the break out has already happened and It's upward! this means that the bullish movement would still continue.
Thank you for seeing idea .
Have a nice day and Good luck.

ANKRBTCif everything goes well, we hope this point looks good in any case. let's see what the market is doing

ANKR/BTC Day Chart Ascending TrianglePretty clear in this idea what is happening. Stick with this one looks like an easy 100% over next weeks. Love you guys thanks for the support.
If you agree throw me a like and follow for more unique concepts and ideas that keep you in the gains!

ANKR Breakout - Ankrusdt Ankrusd Ankrbtc ANKRBITCOIN ANKRBUSDANKR Breakout - Ankrusdt Ankrusd Ankrbtc ANKRBITCOIN ANKRBUSD

#ANKR/USDT LONG 50% PUMP IncomingWelcome to this quick ALtcoin setup.
I am opening a long on ANKR/USDT here, looks great.
Sitting on the support of the channel as well as trying hard. to break the resistance level.
ENTRY : 0.01545 TO .016200
Leverage : 5x to 10x
TARGET :
.01746
.01798
.01856
.01954
Stop Loss : .01488
If you trade on Binance futures like me try to use low leverage in order to lower your risk. Always keep. your stop Losses once you are done accumulating.
Do hit the like button and share your views in the comment section.
#PEACE

