APE LONG Once the triangle is broken and retested, it will target the levels above.
Take your risk, make some profit !
APE

Lets get into APE shitSo the coin is similar to a Meme coin but has a backing by what we call WHALES. Ape will be used in the metaverse and is used for governance to control what the future of the people who have millions of dollars to spend on pictures of apes. It has the similar potential as doge coin but as for doge coin there are not whales backing the meme coin only the lucky ones Like the millionaire who wouldnt sell at the peak. So we have a new coin to keep and eye on it has a high of nearly
$27 and it is currently at a $5 coin.
As any trader could look at the coin it has a potential for a 4x minimum gain this upcoming bull market. so keep and eye out.
we may see a crash along with BTC and ETH these upcoming months but its a good idea to have a eye out for any potential 400% gains on the sideline
Millionaires don't let their coin go to 0 so play along with the pump and dump.
good luck and have fun with it.

Broadening Bottom AMC+APEI have been following this "broadening bottom" pattern since before the December low. Finished the week on the .618 retracement to the penny! Cant make this stuff up. Very bullish! NYSE:AMC NYSE:APE

APE: Pullback in UptrendApe Coin (APE) technical analysis:
Trade setup : Pullback in Uptrend. Following a bullish breakout from Channel Down pattern, trends reversed to bullish but momentum is fading near-term (MACD crossover). However, pullback near $5 support could be an attractive swing entry in uptrend. Could revisit $7.50 next.
Trend : Neutral on Short-Term basis and Uptrend on Medium- and Long-Term basis.
Momentum is Bearish (MACD Line is below MACD Signal Line, and RSI is below 45).
Support and Resistance : Nearest Support Zone is $5.00 (previous resistance), then $4.00. The nearest Resistance Zone is $6.00, then $7.50.

Sell postipon for APEUSDTPerp BinanceUsing the Smart Money concept, I think the position of the shorts is excellent in this range.
This is my analysis and it is not a reason to use it for you to buy or sell.

$APE bullflag continuation? Final target $17-$18?The chart speaks for itself. Looks like we've been consolidating in a bull flag since the of January. I think we end up seeing a breakout to the upside and if we can break through all the resistance levels, the final target would = $17-$18.

APE to consolidate?If you find this info inspiring/helpful, please consider a boost and follow! Any questions or comments, please leave a comment! Also, check out the links in my signature to get to know me better!
Best bull case, Elliott wave style, atm.
I am wrong,
move from the low finishes as impulse,
Internal retrace before external move up and out.
…Still corrective to me, atm.
Cheers!

APE coin BULLISH very bullish diverging
Higher high in 4 hour chart
Going to be fantastic run to 7 area soon
GOOD LUCK

BBBY Bed Bath and Beyond - A High Risk Scalp Is All That's LeftBed Bath and Beyond is a classic case of why you stay the hell away from Reddit, which is partially owned by the Chinese Communist Party's Tencent, and good for very little besides indoctrinating readers with atheism, socialism, Marxist-Leninism's garbage, and a lot of pornography.
I remember during the $10+ August run seeing posts on WallStreetBets and the BBBY subs encouraging people to buy and file paperwork with their brokers for self custody because Buy Buy Baby was supposed to get split off and lead to a moon mission.
Also, RYAN F'IN COHEN!!!!
Other fun posts were propaganda like "Wow this BBBY store just opened near my house! Bullish!" and "Bought my entire family a membership for Christmas xD."
Reddit is not social media. It's a social marketing and social influencing platform where communities are organized from the ground up by professional public relations firms.
Enlighten to it, already.
If you risk your money on the basis of what some alpha-schtick avatar with slicked back hair, a suit, and sunglasses says, you really can only blame yourself when you wind up holding a 95% loser, which is what this thing has become.
Reuters reported on Jan. 5 that BBBY is on the verge of missing a $1.5 billion debt payment on Feb. 1, which will give it 30 more days before it will default, and is on the verge of bankruptcy.
And over the course of 2 days, you lost 47%.
Earnings is coming up on Jan. 10, and for those who bought $1.80 and $1.30 thinking you got a deal, the all time low isn't far away at 88 cents, which was the first month BBBY traded for all the way back in 1992.
You should absolutely expect Bed Bath and Beyond will post dumpster fire numbers with heavy warnings to investors about how things are about to get a lot worse before you buy the dip.
That being said, the only potential profitable trade on this thing before it declares bankruptcy is for it to do something like the piece of trash Upstart Holdings, another Reddit pump and dump, did on its last earnings after it reported a 200% miss on EPS, with a good old fashioned dump and squeeze before falling even farther towards the 12th Layer of Hell.
And the good news is that if you don't get stopped out, you might get lucky and get a retracement to the daily trendline at roughly $2.40 that you can sell at, if the markets go wild on a Thursday CPI miss and whatever ostensibly bullish narrative Wall Street wants to pump FOMC rate hikes with.
SPX500 / ES / SPY - Enjoy the Party While It Lasts
But what I would like to point out to you is that BBBY declaring bankruptcy means that the stock will approach $0.00 legit. In the best case scenario, you might get a buying opportunity before it gets delisted so that you can hold your bag until someone buys its assets and maybe the stock will be worth something again if they don't just liquidate the chain to pay creditors.
A good example is found in Hertz HTZ
It fell from $20 to 0.44 cents and got delisted, and stayed that way for almost 2 years. Then it was worth a lot.
This is called "gambling" not "distressed investing," however.
Another chance you have is found in the precedent of this piece of crap APE "All People Equal" (Thanks Karl Marx and Mao Zedong! Absolute egalitarianism and class struggle is sooooooooo cool!!!!) from the AMC split, which absolutely annihilated really, really bad short sellers trying to pile on to $0.00 once it fell into the 0.60s.
You might also get this kind of squeeze on BBBY if there is news that it somehow won't miss its debt payments, and then $3.50 is incoming. Maybe RYAN F'IN COHEN will Superman and cape in to save the day.
Bed Bath and Beyond is another one of those garbage-style retail outlets that existed to hustle stuff made in the Chinese Communist Party's factories to Americans and Canadians, and now that it's been replaced in usefulness by stuff like Amazon, truly has limited value as a business model.
Amazon AMZN - Manufacturing Support
But they have a lot of stores and a lot of infrastructure, so maybe someone will come along and buy them on the cheap, resurrect BBBY, split Buy Buy Baby, and you'll make a fortune.
If not, you can always complain about Ken Griffin and Citadel with the Redditor Wumao that you still think are fellow bagholders because you don't want to sober up and get off the damn computer already.
Look, if you take this trade, it's a scalp. And it's a risky scalp that might be nice. You literally need to buy the earnings crash, wait and see if Nasdaq wants to go up on Jan. 12, and get out in a profit.
This isn't something to buy and hold, no matter how some "alpha" kid with a bored apes NFT for a profile picture barks about how they "like the stock."
Good. Grief. Don't. Hold. This. Piece. Of. Crap.
Some influencer might "like the stock," but don't you "like" your money?
You can't take BBBY shitcoins to the grocery store to buy rice and you can't take them to the gas station to buy gas.
Never forget this. And never forget to ditch Reddit and the Chinese Communist Party forever.
Get off the computer and go outside more. You'll trade better and lose less/make more money, too.

APEUSDT / ETH - Long Attention Zones - Ascending WedgeAt current levels of consumption with Dookey Dash, use of Stake at Apestake.io and strong market trend in general (bullish), APEUSDT may look for past tops in the short/medium term, according to the ascending wedge on the chart.
I also recommend to take a look at the chart on the APEETH pair, where a possible pattern descending wedge is happening (continuation), reinforcing the idea of new highs.
Not a Financial Advice, DYOR.

BUYThe price of this currency will reach its resistance level in the next 9 hours.
in my opinion make a buy at this price.
this segnal with support and resistance lavel and trend lines.

APE targetsNext target is 6.40 then 6.90 we are resting on support right now. I have also marked the next major support down should we get a dump in the market

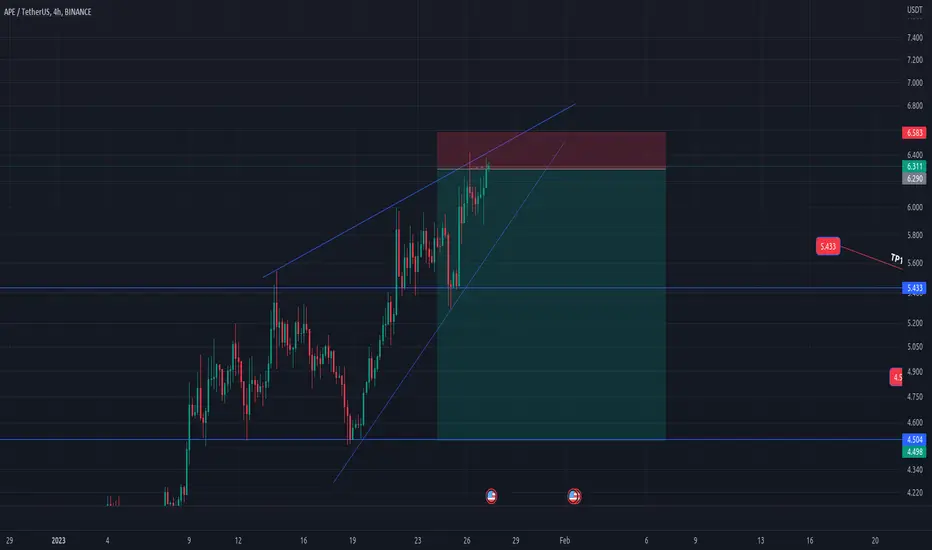
APE USDT short positionAPE/USDT is confirming Rising Wedge and after breakout it could fall.
tp1:5.433
tp2:4.50
sl:6.58
Short APE$APE is bouncing off the resistance level at 4 month high. Decline to support level at 4.5$ is possible.

APEUSDT - Aggressive MACDMACD indicator is in a very "aggressive" state, being in the positive area and continually rejecting the bear attempts.
This can also be viewed on chart showing a breakout of the down channel in red
Lets see how the apes are playing in the following weeks/months.

Might ApeCoin (APE) suddenly pump the same way as AXS did ?ApeCoin (APE) potential growth projection
Gaming and AI is now the new trend.
ApeCoin (APE) Fibonacci projection in 1D timeframe shows mid term potential growth.
Question remains will it show same type of instant boost as AXS did from 5 to 14 within few days only.
ApeCoin (APE) and Axie Infinity ( AXS ) are two my favourites for trading. AXS is not so hype project as the newer APE but has shown lately very nice boost. These two tend to move together, always one first and another soon after.
Gaming is certainly one to look into and APE is certainly very promising one.
In case the bull market lasts this scenario is only question of time, might happen suddenly. I would expect first a correction but a lot depends of the Bitcoin move and the money flow into the industry and macro economics.
APE is one of my favourite for trading in futures , high leverage can be applied easily, a bit slow but quite trustworthy in it's movement.
Good Luck!
When you like what we do give us Boost and comment!
And follow us in different socials: womenincrypto48
Join the Revolution!
Women in Crypto - WiC48
May you have more profit than you could ever wish for !

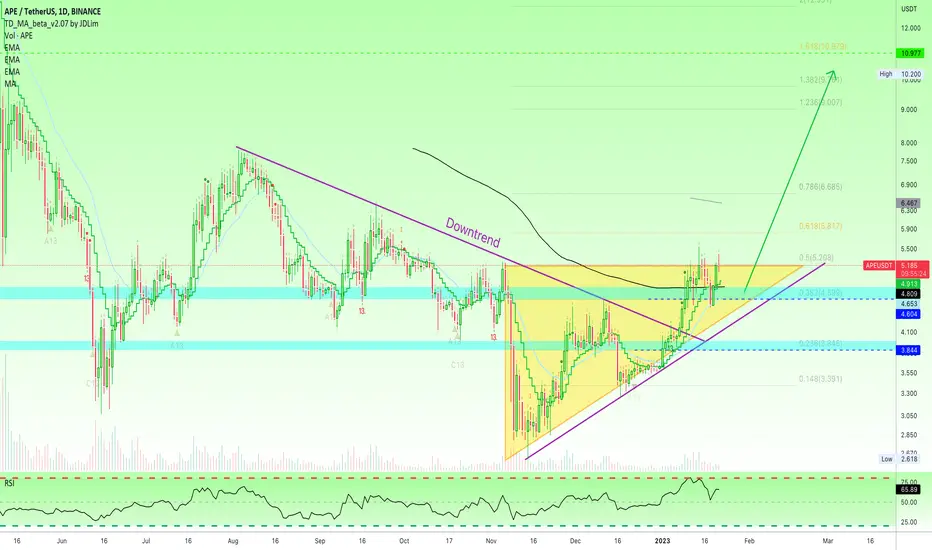
✴️ APE Aims At $10 After Triangle & Broken DowntrendAPEUSDT has come out ahead of a rising triangle and also broke free of its August 2022 downtrend.
Currently trading above MA200 with a bullish cross with EMA10 happening at the same time; EMA10 and MA200 bullish cross.
MA200 was initially conquered 10-Jan., prices moved down and this level was tested as support.
Now that APEUSDT is trading back above it, this is the confirmation that it holds.
Above MA200 = Potential for long-term growth.
As long as the current price is above this black line, we can expect additional growth.
The immediate target is set at $5.815 followed by the range $6.500 - $6.685.
Only after these levels are taken out can we see the light to $10+.
After more than a year of bear action, it is not incredible to see this and other pairs growing for a few months.
Call it a relief rally or a recovery... It doesn't matter as long as Cryptocurrency grows.
Namaste.
GME, APE, AMC Trading Data 1-19-22 to 1-19-23$GME
284,152,540 - Shares Traded Short Reported
4,433,987 - Shares Traded Short Exempt
491,230,683 - Shares Traded
Chart shows 2.8 Billion shared traded on the Yearly for 2022
--
$AMC
2,869,327,325 - Shares Traded Short Reported
73,070,781 - Shares Traded Short Exempt
5,292,793,100 - Shares Traded
Chart shows 10.4 Billion shared traded on the Yearly for 2022
--
$APE 8-22-22 to 1-19-23
1,395,763,913 Shares Traded
28,236,308 Shares Traded Short Exempt
661,931,758 Shares Traded Short
Chart shows 2.27 Billion shared traded on the Yearly for 2022
--
Data is referenced from here.
www.finra.org

APEUSDT By HesamUNTHey traders
lets take a scalp trade at APE
what u think about this swing ??
share ur chart and leave a comment

APEUSD - Up Channel Up channel for APE, the channel is rather small
Falling Wedge also that has broken out
This is the daily chart for APEUSD

APE 420? Elliott WaveIf you find this information inspiring/helpful, please consider a boost and follow! Any questions or comments, please leave a comment! Also, check out the links in my signature to get to know me better!
Seeing a couple counts, but regardless of count, a Zig Zag or 12,12 sticks out as the major ideas here. 4.20 is the larger area I will be watching to base some plays off of. Depending on retractions and and waves to levels.
Cheers!

💀ApeCoin💀Analyze (Road Map)🗺️(Update)🔁Today I updated Roadmap 💀ApeCoin💀 for you.
I suggest you carefully read my previous post about ApeCoin (according to my analysis, ApeCoin moved well).👇✅😎
ApeCoin is moving near the resistance zone on the daily time frame; also, it seems the D point of the bearish AB=CD harmonic pattern has formed in the TRZ(Time Reversal Zone).
I expect ApeCoin to decline to at least the EMA100 & support zone and the downtrend line.
Also, we can see the end of movement at the StochRSI indicator👇.
If ApeCoin can break the resistance zone upwards, we can confirm the end of the main wave Y; otherwise, the main wave X will continue.
ApeCoin Analyze ( APEUSDT ), Daily Timeframe ⏰(Log Scale).
Do not forget to put Stop loss for your positions (For every position you want to open).
Please follow your strategy, this is just my idea, and I will be glad to see your ideas in this post.
Please do not forget the ✅' like '✅ button 🙏😊 & Share it with your friends; thanks, and Trade safe.

APE Coin: We have a bearish view in short term.... 😢Hello everyone!
We are most likely wrong but at the moment we are not attracted by the ApeCoin trend, so our idea is to sell this short-term rally. Technically, we see a area around 3.80 as a potential short-term bearish target.
Next resistance area on 1h chart:
If this idea will be supported by your "Likes" we will continue to follow the crypto with updates below.
thanks for your attention and please... trade with care! 💖
