APEUSDT - Short Setup +68% TPHi Traders, Investors and Speculators 📈📉
Ev here. Been trading crypto since 2017 and later got into stocks. I have 3 board exams on financial markets and studied economics from a top tier university for a year. Daytime job - Math Teacher. 👩🏫
The entire cryptocurrency market has been trading bearish over the past 3 days and we are seeing altcoins bleed out harder than BTC. This is a short setup opportunity for Apecoin / APEUSDT with a potential upside of 68%.
Looking for some side hustle ideas to make more money ? Check out this idea 👀
Have a great weekend 🥂
_______________________
📢Follow us here on TradingView for daily updates and trade ideas on crypto , stocks and commodities 💎Hit like & Follow 👍
We thank you for your support !
CryptoCheck
APE

$APEUSDT UPDATE!!!Hi Snipers,
Please refer to the recording for the next price levels and scenarios.
Thanks
MS

APE/USDT - LONG SCALPING----- Welcome, dear followers! -----
- Here is my trading methodology. I trade with a normal system and analysis of resistance and support, as well as price reversal patterns.
- For the record, I do not place a stop loss within my trades. So that I only risk 1.5% of my total capital in order to support the loss due to a price reversal against me.
- If a price reversed against my expectation and touched the drawn line r3, then I transferred targets to the entry point and waited for the price to close at it with a loss equal to almost zero.
- Today's deal is shown in the chart, and here are the entry and exit points below.
-- Support me with numbers and follow up on my account for other deals in the future. Thank you for coming to this part. --
-------------------------------------------------------
⚡️⚡️ #APE/USDT ⚡️⚡️
Client: My-Binance Futures
Trade Type: Regular (Long)
Leverage: Cross (1X)
Entry Zone:
4.657 - 4.527
Take-Profit Targets:
1) 4.829 - 25.0%
2) 4.987 - 25.0%
3) 5.254 - 25.0%
4) 5.426 - 25.0%
Trailing Configuration:
Entry: Percentage (0.5%)
Take-Profit: Percentage (0.5%)
Stop: Breakeven -
Trigger: Target (1)

APE - Buying SignalBYBIT:APEUSDT.P
4H time frame
-
APE already broke the triangle and it's goin to retest the support so far.
Try to buy it here and add more once getting support on the downtrend.
-
Entry: 5.05
Add: 4.815
TP: 5.5, 6.02
SL: 4.5

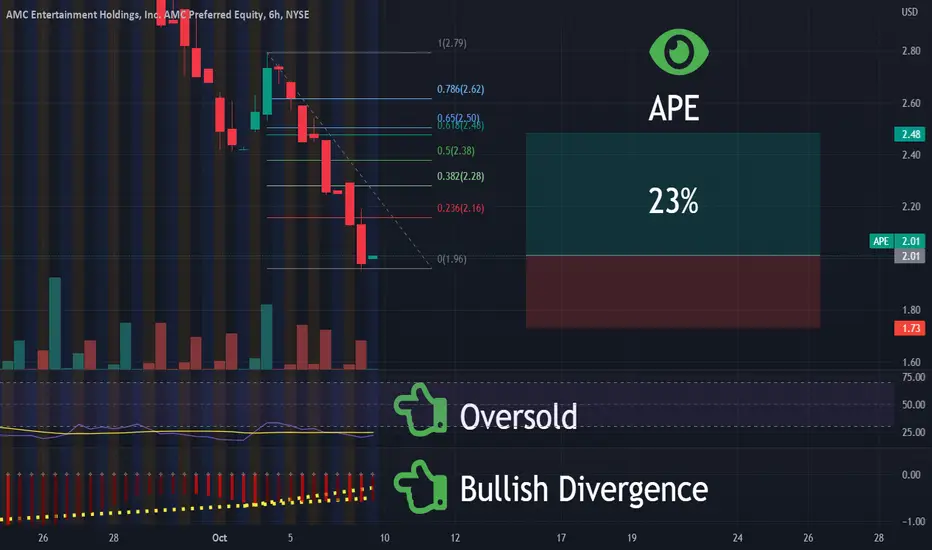
APE | Swing Trade | LongAMC Entertainment Holdings, Inc., through its subsidiaries, engages in the theatrical exhibition business. The company owns, operates, or has interests in theatres in the United States and Europe. As of March 1, 2022, it operated approximately 950 theatres and 10,600 screens. The company was founded in 1920 and is headquartered in Leawood, Kansas.

#APE/USDT 4HOUR UPDATE Hello, welcome to this APE/USDT 4hr chart update by CRYPTOSANDERS.
I have tried my best to bring the best possible outcome to this chart.
Show some support do hit the like button, follow and comment in the comment section. this motivates me to bring this kind of chart analysis on a regular basis.
CHART ANALYSIS:-
APE is trading in a falling wedge pattern. The major support is the $4.00-$4.30 area on the daily time frame and this is also the support level of the falling wedge pattern. The resistance is the $4.55-$4.60 area and the major resistance is the $4.90-$5.00 area.
This is not a piece of financial advice.
Hit the like button if you like it and share your charts in the comments section.
thank you.

APE Complete a Falling TriangleI think the upward movement was a triangle. This triangle has another wave ahead, and after completing this wave, I think this currency will fall
If you have any questions, comment
Thank You

APE | Its Going to Be Bananas | LongAMC Entertainment Holdings, Inc., through its subsidiaries, engages in the theatrical exhibition business. The company owns, operates, or has interests in theatres in the United States and Europe. As of March 1, 2022, it operated approximately 950 theatres and 10,600 screens. The company was founded in 1920 and is headquartered in Leawood, Kansas.
$APE recovery? Many people argued that $APE coin was going to $3 - and despite the Fib showing me that it would need to bottom out the fib table to get there, I believed it for a moment.
I've since slowly changed my mind as I noticed that APE was testing the ~$4.1 support line(historically and presently). That support line has been rejected for the 5th time to date. I initially wrote on this briefly in the comment section of my previous analysis of the coin
I'm setting this new analysis up because APE broke through the triangle I was previously tracking, and I can see a new trend potentially forming. The fib tool will better help track APE as it tests current and possibly new supports. The Fib should help track where those new supports may be and clean up some of the volatility I suspect may be coming too.
** Disclaimer** I'm a novice trader working to put my thoughts out there to see how they stack up against the market - please feel free to share/comment on my studies - please don't use this chart as financial advice
Technicals
The "mini-rally" we see at the moment is likely due to an exchange of 1m coins I detail further down below or some bullish sentiment being expressed, given the 5th support rejection of $4.1
Notably, the 9MA has also become support at point 1 on the fib table presently. I suspect that for the short term, we have found a solid home base for APE's bottom (no pun intended) until we better understand what BTC and ETH will do next.
I'm yet to re-enter a position as I don't yet have confidence in what BTC and ETH are doing. They have broken out of their triangles but failed to move convincingly upward leaving me bearish on their movement over the coming days. ETH and BTC have a very strong impact on the price movement of APE so I'm sitting on my hands here.
Fundamentals
Also, there are little to no details emerging from Yuga regarding staking (other than what I previously mentioned about test-net) and the utility role it will play in their upcoming game, Otherside. This means complicated sentiments remain rooted with holders while ambiguity plays with their emotions.
Looking at "Into The Block", - the sentiment for APE is still firmly with long-term holders, that is, those who have held >100k coins for longer than six months. A few big exchanges have occurred between private wallets; notably, on the 21st and 22nd of October, 1m coins were released and re-absorbed. Likely some trade took place there - it's unclear what drove the exchange; it may have just been a shift of funds from a semi-cold wallet to a warm wallet in preparation for trading. Hard to say - the movement to me would be bearish, but that remains to be proven.
Social media sentiment on APE remains unclear/neutral as many focus on the next move by BTC/ETH, so no significant comments there for now.

Keep an eye on APE! Here's a quick Look at the APE daily chart.
The best entry would be when the price breaks above 5.1$ with a good amount of volume. One to keep an eye on.
-------------------------------------------
The idea is: Buy when the price breaks above 5.1$ and take profits at the levels shown in the chart.
Targets:
1. 5.4$
2. 5.8$
3. 6.4$
-------------------------------------------
What are triangles when it comes to trading?
Key points:
"1. In technical analysis , a triangle is a continuation pattern on a chart that forms a triangle-like shape.
2. Triangles are similar to wedges and pennants and can be either a continuation pattern if validated or a powerful reversal pattern, in the event of failure.
3. three potential triangle variations can develop as price action carves out a holding pattern, namely ascending, descending, and symmetrical triangles."
-------------------------------------------
If you like the content, then make sure to comment and like the post :D
Follow me for daily profitable trading setups
BTC dictates the market. If BTC falls, then Alts will fall as well. Trade safe!

$APEUSDT UPDATE!!!Hi Snipers,
Please refer to the recording for the next price levels and scenarios.
Thanks
MS

APE falling wedge APE / USDT
APE printed falling wedge
will confirm its bullishness after breaking-out (daily close)

Short APEAPE was a highly volatile crypto. My previous experience with APE told me that it is not an easy crypto to trade.
The hype was no longer with APE and it is slowly going down. In 2D TF, we can see that a H&S pattern was formed. The prices broke the neckline and so did the RSI.
The proposed TPs (blue) and SL (red) are depicted in chart. The final target (if reached) is quite low the the price at which APE started.

APE TIME BACK And BEST INCREASE OF THE DAY?APE TIME BACK
FIRST TARGET IS 5.39 USD
Let's see how this will affect the market coming time.
There was an update from 4 USD before but saw it was not more on TV, so for this reason did add a new one.
Will Ape have a new hype coming time since a long time ago?
The only sure is to know when we follow the market.
Most coins increase only for TP and most of the time it returns.
Will APE have really a building trend in the long term? and is there a signal that NFT could come back again = Chart that will show the coming time?
IF APE has the whale building increase what it seems, then it will hold value with time.
There is a difference between trading and building positions.

APE SCALP SHORTHello, dear traders. how are you ? Today we have a setup to Sell/Short the APE symbol.
For risk management, please don't forget stop loss and capital management
When we reach the first target, save some profit and then change the stop to entry
Comment if you have any questions
Thank You

BEST AREA TO SHORT APEHello, I hope you are well, dear traders
Before anything, you should read the analysis related to this analysis.
This analysis is the entry point to the short position for the previous analysis.
Comment if you have any questions
Thank You

APE Coin potential dump into rally** Disclaimer** I'm a novice trader working to put my thoughts out there to see how the stack up against the market - please feel free to share/comment on my thoughts - please don't use this chart as financial advice
At this point, though, $APE coin sits in a precarious symmetrical triangle and has progressed quite deeply into it. It would suggest that APE is preparing for a move downward, and the predicted bottom price is ~$3. As my chart indicates, it has rejected its ATL resistance line three times. There could be a good reason for this leading to longer-term holders and speculative investors buying the coin when it hits its bottom. For the time being, I would wait to see how the coin stacks up in its triangle.
Considerations and Fundamentals;
$APE coin is a coin I've been following closely. As an artist with his own NFT collections, I enjoy looking at what influences the NFT market and how NFTS interacts with coins. For those that are not aware, NFTS, in theory, are deployed as tokens (same as coins) against a smart contract; however, their operability is adjusted slightly within the contract to do things like display an image. Many are unaware that the tokens, rather than ERC-20, are an ERC-721 standard, which is a convoluted way of stating that NFTs are non-devisable and non-fungible.
$APE coin is a relatively controversial coin. Most view it as a scam driven by a bunch of Crypto Bros who hit it big with their Bored Ape Yacht Club offering, which rocketed to price heights a year after release. I have no idea why that token, in particular, did so well. Regardless, it has enabled Yuga Labs (the brain trust of BAYC) to absorb voluminous amounts of money to invest in other projects. Projects such as Meebits, Cryptopunks (an OG NFT - close to 5 years old), and establish "Otherside", an upcoming metaverse game I'm interested in and want to play.
Two significant points of interest have had me bullish on $APE coin for much of this environment. Firstly, Otherside (the game) will utilise $APE coin as the mainstay currency. At this point, there is not enough information about the coin's utility in the universe or if people can potentially earn $APE coin through game mechanics; what it suggests is a future currency demand.
Beyond that, a staking mechanism has been on the cards for some time. The $APE Coin DAO voted and passed the concept six months ago. Company Horizen has been the key partner in establishing and delivering this mechanism. In a very lazy, low-key twitter post - the test net version of the staking mechanism has been released for public testing. The mainnet version is due "soon" - but was initially earmarked for the 31st of October - most are currently assuming with little comms that the date may be pushed back - some speculating even into December.
The short of the long is that this mechanism will allow Bored Ape collectors to stake their NFT within a pool for returns; however, there is a premium to stake your NFT. Two thousand odd Ape coins are required PER staked NFT. A prompt that will contribute to demand on the circulating supply of the coin further. With only 300m of the total supply in circulation and a good chunk of the coin being held by exchanges and early holders, I can see some short-term rallies coming.
At this point it would be safe to remain out of APE coin - but do note there are points of interest for the large community invested in the ecosystem to soak up the circulating supply coming in the future, so it may be a coin to watch.

APE - Accumulation Over Support.
This instrument can stand in the ranks for a few more days with false laws of the local accumulation boundaries. After a successful test of the buyer we will see the prospects in the long. Observe.

CRYPTO MARKET UPDATE!!!! GET READY FOR MORE BLOOD! Hi Snipers,
Please refer to the recording for the next price levels and scenarios.
Thanks
MS

Third rejection soon be ready to short, 10k on the way!Hi Traders,
We closed out some amazing profits on recent shorts yesterday (just as price began to reverse);
XRP 0.53c -> 0.45
APE 5.2-> 4.2
BTC 20.3 -> 18450
I have now closed out the hedge longs with some small profits, they served their purpose.
I have made a quick (and rough) line drawing to illustrate current price direction, we have a big break out coming soon.
Now firmly believe and will be shorting this evening depending on how the US markets open, anticipation a small upward continuation overall but closing with some rejection wicks in critical areas.
The same for BTC, anticipation a pump to the 20k area for the 3rd and final major fake-out rejection before slowly downward this weekend.
MONDAY - has the making for a market crash, if one is historically wise they would know we have major pumps in the markets (2% for the stock market is on point) to clear late shorts and entice bulls BEFORE A MAJOR SELLING EVENT. So we are anticipation Sunday to be quite bearish for BTC and the smart money beings to exit the markets/MM remove liquidity holding price up.
Tonight should be the shorting opportunity before continuing below the 18k supports.
SO we are looking to up shorts on XRP/APE/ETH/BTC
I have chosen these coins specifically for the added % return on the drop, XRP obvious given the recent rise/APE given it is breaking downward out of the massive H&S looking to hit $2 or lower/BTC and ETH for obvious reasons and they have been held up better than some alts which are already too low to short.
Price would have to hit and hold above 20.8k for us to consider the bulls a chance as preventing such a collapse - but if we are honest, the macro environment is terrible and numerous events loom and catalyst for a dump to 10-12k (and the stock market similarly).
Also KSI tweeted 21k incoming yesterday, one would say that is a prime top signal (joking) ha.
I will follow this posting for the XRP/APE/ETH/BTC daily charts to show TP points for shorts... posting this in advance as an explanation.
Goodluck,
Asset Mastery


APE head and shoulders pattern and trend lines#APE/USDT
$APE shaped a head and shoulders pattern and broke down from ascending trend line.
🐻 so price can drop more to support zone that is the same with neck line of H&S pattern.
then it will have a pullback to broken trend line and if reject from this line it will drop more to support zone around $3.
🐮 but holding the neckline as a support and break out from resistance zone will increase price toward upper ascending trend line.
#women_life_freedom

APEUSDT/ D 💁🏼♀️#APEUSDT 1D
The price is currently fluctuating.
The first scenario that can be considered is that part of the important resistance range of 5.34/5.70 starts to be corrected or we see price correction from this range.
For a positive price trend, we should stabilize the price by crossing the dynamic resistance above the 5.80 range.
what do you thin about it ?
📆✨8/10/2022✨
💁🏻✨ @MehrnaziJiTrading_crypto✨
