A CORRECTIVE 30% PROFIT POTENTIAL APEUSDT is in a downtrend but can give a 30% profit potential from its current price while in its corrective phase.
APEUSDT

APE: Major Weekly Trend Line BrokenAPE has been trading below this major trend line since May 2022. As we can see on the weekly chart, APE has finally broken through the trend line and has reached the first resistance zone between $5.00 - $5.25.
Assuming the bullish momentum continues in the coming weeks, the next major target would be $6 - $6.25.
Invalidated with a break below the trend line.

APEUSD Bullflag Above Up Trend A Bullflag has formed above up channel in white
This will lead to further up moves for APE out of this channel
Big moves coming

APE: Approaching ResistanceApe Coin (APE) technical analysis:
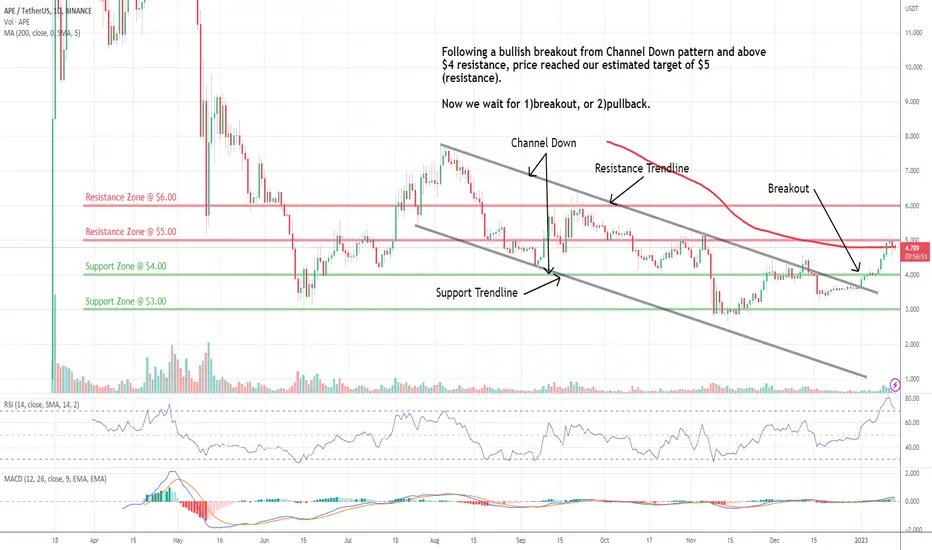
Trade setup : Following a bullish breakout from Channel Down pattern and above $4 resistance, price reached our estimated target of $5 (resistance). Now we wait for 1) breakout above $5 to indicate continued uptrend, or 2) pullback near $4 support for a swing entry.
Trend : Uptrend on Short- and Medium-Term basis and Downtrend on Long-Term basis.
Momentum is Bullish (MACD Line is above MACD Signal Line and RSI is above 55).
Support and Resistance : Nearest Support Zone is $4.00 (previous resistance), then $3.00. The nearest Resistance Zone is $5.00, then $6.00.
Bear flag or revival pattern?I've been asked to analyse APE so here it is my point of view.
This seems a lot a bear flag, I don't think it could be a revival triangle pattern because volume is lowering, because I don't think market has bottomed and because I would have expected a left side of the triangle to be created from bottom to top and here is the opposite.
My opinion is that this is going to dump, you can see my two levels where price could slow down inside the flag. As price has bottomed I used Fib extension to see what could be the next bottom: and it is around 1 USDT
If you wanna attempt a short it's likely the best two entries are gone:
you could try to enterer around 4.9 USDT if price gets back there.
Good luck
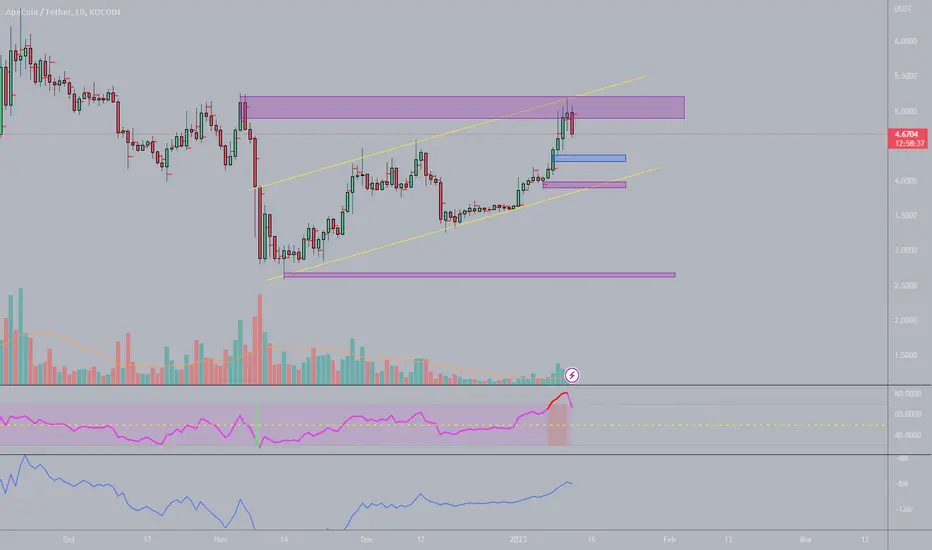
ApeCoin APE price has good potential for growthIn recent days, the APEUSDT price has started to grow quite well, but the trading volumes are far from those that were six months ago.
Now the ApeCoin price hit a fairly wide liquid zone and could not pass it the first time. Well, this is logical, because in the liquidity zone of $4.25-5.25 there will be many people willing to sell their APE.
Therefore, we believe that in the coming days the APEUSD price will slightly correct downwards to gain strength for a new breakout impulse upwards. The strength of the buyers will be confirmed if the correction is not much below $3.50
If we look at the APEUSDT price chart "globally", we can assume that an "Inverted Head and Shoulders" trend reversal pattern is probably forming now
The target of $6-6.50 for APE in the next 1-1.5 months is more than realistic.
_____________________
Did you like our analysis? Leave a comment, like, and follow to get more

APE breakout3.70 was the breakout ...although we have not confirmed the continuation of the breakout another 1 hr green candle close above 3.70
should do it

ApeCoin (NFT) is pumping thanks to Donald Trump! (massive)
APE coin looks very strong at this moment, also thanks to President Donald Trump and his NFT collection. That is also great news and an important catalyst for the NFT coins, such as the APE coin.
APE coin is currently breaking out of the falling wedge pattern on the daily chart! The main downtrend wave has been completed, and now we are looking for a bullish retracement.
How far could the APE coin go? Well, I am personally selling APE coin at the strong resistance, which is the 0.618 FIB or monthly resistance + GAP (10.5 - 11.3). My entry price is 4.112.
I share my trades privately. This analysis is not a trade setup; there is no stop-loss, entry point, profit target, expected duration of the trade, risk-to-reward ratio, or timing.
From the Elliott Wave perspective, unfortunately, this coin still looks pretty weak. We can spot two corrections: wave 2 and wave 4. This appears to be an impulse wave, implying significant selling pressure and the possibility of another major crash in the future.
APE is a great coin to trade on the futures market because it's highly liquid and there are a lot of opportunities. You can short APE at the 0.618 FIB, and this is exactly what I am going to do later!
The crypto market is very bullish at this moment, so I am not shorting anything and am only going long.
Thank you, and for more ideas, hit "Like" and "Follow"!


APE/USDT 1DAY UPDATE BY CRYPTO SANDERS !!Hello, welcome to this APE/USDT 1DAY chart update by CRYPTOSANDERS.
I have tried to bring the best possible outcome to this chart.
CHART ANALYSIS:-Apecoin (APE) was another big mover in today’s session, extending recent gains to a fifth consecutive day.
Following a low of $4.50 to start the week, APE/USD raced to an intraday peak of $4.98 earlier in the day.
The move pushed apecoin to its highest level since November 5 and came following a breakout of a price ceiling at $4.60.
As a result of today’s surge, the RSI on the APE chart is now at its strongest point on record, with a reading of 79.09.
This means that prices are now deep in overbought territory, which could mean that bears are preparing for reentry.
Despite this potential reversal, bulls are seemingly still targeting a ceiling at $5.30, which hasn’t been hit since October 11.
This is not a piece of financial advice.
Hit the like button if you like it and share your charts in the comments section.
Thank you

APE - Take Some Profit Next Week I'm not fudding $APE, its one of only 5 altcoins I own. But I think its gonna wreck late / FOMO buyers later in January or February after the mint.
High staking emissions; hype growing like repeat of Otherside when APE dropped >80% in the 5 weeks after. Yuga vesting also unlocks in March.
Be careful, take some profit.

APE (try to breakout)APE/ USDT
Another try to breakout the 8 months resistance
(5 attempts in total which increase the chance of the breakout this time )
Keep an eye

APEUSDT SHORtPrice engineered liquidity, took out liquidity, reacting to 8hr supply zone.. Short target previous swing lows

APEUSDT TO THE MOONBINANCE:APEUSDT
#is this monkey going to the moon? YES IT IS.
it will reach the 4.5 level soooooon...HOLD ON!
#STOP_BEING_POOR

APEUSDTHello dear friends
On the daily time frame, the positive divergence of the RSI with the downtrend line has created a bearish wedge pattern for us. Until the $5.584 range is fully consumed, the bullish outlook is weak.
But if the range of $2.618 is maintained, we can hope for the completion of the wedge pattern.
On lower timeframes, the drawn bearish scenario is very likely. However, if the range of $2.618 is maintained, the possibility of a bullish scenario will also be strengthened.
We would be happy to hear your comments

APE: Channel Down BreakoutTrade setup : Bullish breakout from Channel Down pattern and above $4 resistance, which confirm the channel breakout and price could revisit $5 next. (set a price alert).
Pattern : Price is trading in a Channel Down pattern. With emerging patterns, traders who believe the price is likely to remain within its channel can initiate trades when the price fluctuates within its channel trendlines. With complete patterns (i.e. a breakout) – initiate a trade when the price breaks through the channel’s trendlines, either on the upper or lower side. When this happens, the price can move rapidly in the direction of that breakout.
Trend : Uptrend on Short-Term basis and Downtrend on Medium- and Long-Term basis.
Momentum is Bullish ( MACD Line is above MACD Signal Line and RSI is above 55).
Support and Resistance : Nearest Support Zone is $3.00. The nearest Resistance Zone is $4.00, which it broke, then $5.00, and $6.00.

Short APEHello traders!
Welcome back to another episode with Analyst Aadil1000x
Today we are shorting another pair which is APEUSDT because of the reversal pattern and change of structure.
Target 4.089(+14%)
Stoploss 4.846(-1.6%)
Don't forget to hit the like button and follow to stay connected

APE falling wedge breakout?!Let's see if APE here can finally get past this resistance and have a big pumperoni! Let the zoo out!

APEUSDT Buy Setup!APEUSDT Technical analysis update
APEUSDT is breaking its resistance trend line.
Buy zone: Below 4.25
Stop loss : $3.87
Take profit 1 : $4.48
Take profit 2 : $4.80
Take profit 3 : $5.25
Take profit 4: $5.75
Always keep stop loss
Thanks
Hexa

APE coin wave count in 4H time frameHello
Since APE coin started to correct has entered in a WXY wave that has covered waves W and X and in order to fill wave Y as if it's having a double ZIGZAG
At the moment one of the zigzags has been covered we expect that after filling wave B, it'll start another ZIGZAG
This can be more accurate with your opinions
Thanks
Reza

APE USDT shortWe had a great run and APE is performing very well in this bear market, the staking news pushed the price from 2.8$ up to 4.5$ !
I do have some APE coins in spot locked in staking and i am confident in that long term , but meanwhile it s time to retrace for ape, let s give it a closer look:
-1H demand zone hitted and rejected hardly (this means that is a good zone where the is a lot of selling pressure and orders)
-Fibonacci retracement filled 0.5 i don t think we are going to fill 0.618 for now being the 0.5 level the same with the supply zone.
Entry: 4.02
StopLoss: 4.088
TakeProfit: 3.831 (for now ... , might close a 75% position here and let it run the rest towards 3.55 maybe ... i will post updates in case)
Risk reward 3 LEV 10X

#ape $ape daily#ape picking up steam on the daily breaking out of a significant bearish trend. i see upside here. but i also see 14600 on #bitcoin. how it plays out remains to be seen. could roll and see a double bottom on many alts with a fakeout here on #ape. therefore at this stage its level to level with a bullish bias until invalidation.

Ape good short swing positionhas the potential for a good drop
it can also reach below 2$
use your own stop loss
