Trading opportunity for APEUSDTBased on technical factors there is a Buy position in :
📊 APEUSDT
🔵 Buy Now or by Breakout
🪫Stop loss 1.490
🔋Target 1 1.770
🔋Target 2 2.130
🔋Target 3 2.490
💸RISK : 1%
We hope it is profitable for you ❤️
Please support our activity with your likes👍 and comments📝
APEUSDT

APE Super-Pump📉💤 Current Price Dip: APE is trending near the lower support zone.
💎🛒 Buy Zone: Strong accumulation area highlighted for potential entries.
🚀💵 Profit Target: High breakout potential towards 1100% gain!
⚠️📊 Risk Alert: Monitor for volatility near support levels.
Buy Zone (🛒): Highlight the area near 1.15 to 1.35 as the "Buy Zone" with a green rectangle or label.
Take Profit Zones (💰): Mark key levels like 2.5, 3.3, 6.4, and 15.5 as profit-taking zones with horizontal lines and dollar signs.
Stop Loss (⛔): Add a red line near 0.85 for the stop-loss level to indicate a potential exit in case of further dips.
Breakout Alert (🚀): Add a rocket symbol near 3.3 to signal a key breakout level for significant upward momentum.
Target Zone (🎯): Shade the area from 6.4 to 15.5 to indicate the long-term profit zone.

Ape out of the woods yet? not the time to ape in yet. Apecoinit seems to have finally broken out, though not very convincingly on a weekly timeframe from its down only move. It may have a pathway to an uptrend, but will need to watch next week to confirm this is not just a fakeout

Long trade idea for APEUSDTLong trade idea for APEUSDT
Falling Wedge measured from OCT 2024
Do note potential pullback according to purple line.
Potentially min 275% profit from current date. Target $6.777
Note that there are Bearish Order Blocks as shown.
Do exercise due diligence and that all trades comes with risks

APE Could RallyAPE is another one of those crypto that has been forgotten and I added more to my small bag. I believe it could rally like ICP did.
Not investment advice, please do your research and due diligence

Ape Coin: Ready to Ride the Wave of 2025Hi All, 👋
Ape Coin has been fluctuating in a descending channel but then reached cent prices. Previously, it dropped sharply but later corrected and stabilized within a channel until now!
Currently, the volume of money in Ape Coin has remained steady and hasn't been withdrawn from the whalers. 🐋💰
A new upward trend might start in the new year 2025, and I'm waiting for a stronger wave to make a second entry investment. I bought at the bottom and am ready to re-enter again in good wave! 📈🚀
If you're considering investing in this well-known NFT Ape Coin, manage your risk properly and Don't Be Greedy!!! 💡📊
Remember, capital and risk management are crucial in financial markets. 📈💼
Good luck, everyone! 🍀✨
Happy Investing All, ❤️
Armin

Trading opportunity for APEUSDTBased on technical factors there is a Buy position in :
📊 APEUSDT
🔵 Buy Now
🪫Stop loss 0.970
🔋Target 1 1.550
🔋Target 2 1.950
🔋Target 3 2.600
💸RISK : 1%
We hope it is profitable for you ❤️
Please support our activity with your likes👍 and comments📝

APEUSDT - Huge Potential LongI love this setup here for a long entry. Massive volume is coming into APE, which with the launch of Apechain has a huge amount of potential. If you haven't checked out their site www.apechain.com you will see what I'm talking about.

ApeApecoin looks primed to retest last cycle's ATH. Although BAYC is crimge, with everything going on with them this looks bottomed here
I'll close my position at $10 thoughever.

APE will be bullish againThe APE correction seems to have been a diamond diametric as we are now at the end of the G wave.
This correction was wave B. Expect a C wave for APE.
Wave C will be bullish.
Closing a daily candle below the invalidation level will violate this analysis.
For risk management, please don't forget stop loss and capital management
Comment if you have any questions
Thank You

BICO BULL RUN LIKE APEBico technical indicators show a bull run. Like Ape this is going to rip.
No more down from here. Take a small risk and make big money.
NFA

#APE (SPOT- Investing ) entry (0.60 - 0.830). SL (0.475)entry range ( 0.60 - 0.830)
SL .Daily close below (0.475)
**NOTES***
1* this coin is very heavy, it may take long time to achieve the targets and the targets is for the BULL RUN
2* collect the coin slowly in the entry range ( do not all in one time in one price )
***********************************************************
BINANCE:APEUSDT
#APE
#APEUSDT
#APEUSD
#swingtrade
#shortterminvestment
#ALTCOIN
#Cryptotading
#cryptoinvesting
#investment
##trading
#cryptocurrencytrading
#bitcoininvestments
#Investing_Coins
#Investingcoins
#Crypto_investing
#Cryptoinvesting
**** #Manta ,#OMNI, #DYM, #AI, #IO, #XAI , #ACE #NFP #RAD #WLD #ORDI #BLUR #SUI #Voxel #AEVO #VITE #APE ****
#bitcoin
#BTC
#BTCUSDT

APE, REVERSING to the upside -- HUGE RR!APE as of this posting is currently registering huge net buy volumes -- conveying longers to be positioning in anticipation of the breakout season of the market.
APE is sitting at major order block support at 3.0 levels -- the strength of this level is unquestioned.
The price range is at a very discounted level FIB wise. Best level to seed.
Spotted at 3.30
TAYOR
Safeguard capital always.

#APE/USDT#APE
The price is moving in a downward channel on the 12-hour frame upwards and is expected to continue
We have a trend to stabilize above the moving average 100 again
We have a downward trend on the RSI indicator that supports the rise by breaking it upwards
We have a support area at the lower limit of the channel at a price of 1.00
Entry price 1.095
First target 1.34
Second target 1.52
Third target 1.70

APEUSDT -1H BEARISH CROSSING of EMA 100/200APEUSDT -1H BEARISH CROSSING of EMA 100/200
BOT TRADEX NEWS:
We have carried out the first successful tests of automated order execution based on Trading View strategies and indicators.
These tests have allowed us to study the execution logic of all the BOT variables, so we have already begun to implement new functional improvements.
It will be ready very soon :)
If you like my AT, and you agree with the approaches, please FOLLOW ME and press BOOST so we can share it with more people. We are working on an automated trading tool so that everyone can apply their strategies VISUALLY and PROFESSIONALLY, as we present in the analysis.
Thank you!
_______________________________________________________
APEUSDT -1H BEARISH CROSSING of EMA 100/200
APE has corrected 78% of the previous push and should be enough to launch a new bullish impulse. However, everything points to it continuing to fall:
BEARISH CROSSING of EMA 100/200
TRIANGLE pattern with decreasing highs...
LEVELS:
TP: 1.31
SL: 0.75
______________________________________________________
Automated Cryptocurrency Trading Bots: All these strategic alternatives can be configured with TradeX BoT, as it will allow you to position in both directions without having to block any amount per position. It will only be necessary for the conditions to be met, either downward or upward, for the orders to be executed in one direction or the other, taking the necessary deposits from your portfolio.
TradeX BoT (in development): Tool to automate trading strategies designed in TradingView. It works with both indicators and technical drawing tools: parallel channels, trend lines, supports, resistances... It allows you to easily establish SL (%), TP (%), SL Trailing... multiple strategies in different values, simultaneous BUY-SELL orders, conditional orders.
This tool is in the process of development and the BETA will soon be ready for testing.
FOLLOW ME and I will keep you informed of the progress we make.
I share with you my technical analysis assessments on certain stocks that I follow as part of the strategies I design for my portfolio, but I do not recommend anyone to operate based on these indicators. Get informed, train yourself and build your own strategies when it comes to investing. I only hope that my comments help you on your own path :)

ApeCoin(APE) is Ready for Pump Again(+40%)Today, I want to analyze the ApeCoin ( BINANCE:APEUSDT ) project for you, which has increased by more than +100% in the last two or three days .
The question here is whether APE can increase again ❗️❓
The recent surge in ApeCoin (APE) price in October 2024 is due to several key factors. The most prominent is the launch of ApeChain, a new layer-3 blockchain developed by Yuga Labs, which operates on the Arbitrum network. This blockchain allows for easier management of NFTs, transactions, and decentralized applications (dApps). Additionally, the integration of cross-chain bridges for transferring assets like APE, BINANCE:ETHUSDT , and stablecoins has enhanced the token’s utility, enabling smooth interactions across multiple blockchains.
Moreover, ApeCoin upgraded its smart contracts to incorporate the LayerZero Omnichain Fungible Token (OFT) standard, allowing it to serve both as a gas and governance token within the ApeCoin ecosystem. This upgrade also enables automatic yield generation for APE holders, adding further value by allowing them to earn passive rewards without manual staking
These updates, combined with a surge in sales of Bored Ape Yacht Club (BAYC) NFTs and increased market interest, have led to a doubling of ApeCoin's value in just a few days.
---------------------------------------------------------------------
ApeCoin(APE) gained more than +100% in terms of Technical Analysis with the help of Inverted Head and Shoulders Pattern .
APE is moving near the Support zone($1.150-$0.984) and the 50% and 60% Fibonacci lines .
I expect the APE to start rising again(at least 🚀+30%🚀 ) from the Support zone($1.150-$0.984) and attack the Potential Reversal Zone(PRZ) again if the Resistance line is broken.
⚠️Note: If APE goes below the Support zone($1.150-$0.984), we have to wait for more dumps⚠️
ApeCoin Analyze (APEUSDT), Daily time frame⏰.
🔔Be sure to follow the updated ideas.🔔
Do not forget to put Stop loss for your positions (For every position you want to open).
Please follow your strategy and updates; this is just my Idea, and I will gladly see your ideas in this post.
Please do not forget the ✅' like '✅ button 🙏😊 & Share it with your friends; thanks, and Trade safe.

US Spot Bitcoin ETFs Reverse Inflow StreakMarket Update - October 25, 2024
US spot bitcoin ETFs saw $79 million in net outflows Tuesday, reversing a seven-day inflow streak that had brought in over $2.6 billion: The outflows came mainly from Ark and 21Shares' ARKB fund.
Bitcoin prices inched closer to $70,000 at the start of the week when futures open interest surged to over $40 billion: But prices subsequently pulled back mid-week as investors pared their gains.
Tether’s USDT has hit a record $120 billion market cap, which could set the stage for a bullish October finish in the crypto market: Historical trends suggest that a rise in stablecoin supply can precede rallies in bitcoin and ethereum.
Bitcoin's hashrate has reached a new peak of 703 EH/s, a 6% gain over the past week: This surge coincides with higher mining profitability as transaction fees rise and Bitcoin's price strengthens.
Binance exec leaves prison: Binance’s Tigran Gambaryan was released from Nigerian prison Wednesday so he can receive medical treatment for the numerous ailments he suffered while in captivity.
US Spot Bitcoin ETFs Record $79 Million in Outflows, Ending Seven-Day Inflow Streak
After a week-long run of positive net inflows, US spot bitcoin ETFs reported a shift back to the negative on Tuesday, with net outflows totaling $79.09 million. It was ARKB fund from Ark and 21Shares was responsible for the entirety of these outflows, losing nearly $135 million. Despite the overall outflows, some funds still recorded gains. BlackRock’s IBIT, the largest spot bitcoin ETF by net assets, attracted just under $43 million, while Fidelity’s FBTC saw $8.85 million in inflows.
The recent outflows bring the cumulative net inflows for the 12 spot bitcoin ETFs down to $21.15 billion as of Tuesday. Trading activity also slowed, with the total daily volume for these ETFs declining to $1.4 billion from $1.76 billion the day before. This reversal comes after the ETFs saw more than $2.67 billion in net inflows over the past seven trading days, a figure similar to their peak inflow levels recorded in March this year.
Spot ether ETFs saw more positive activity, with net inflows of $11.94 million on Tuesday – all from BlackRock’s ETHA. Other ether ETFs recorded no change. Trading volume for ether ETFs also noticeably dropped to roughly $118 million on Tuesday, down from around $163 million the previous day.
🕸️ Topic of the Week: Web 3.0: The Next Evolution of the Internet
🫱 Read more here

Phemex Analysis #30: APECoin Surge 138% in just 3 Days?!The crypto world was abuzz with excitement as APECoin, the NFT token associated with the iconic Bored Ape Yacht Club and Mutant Ape Yacht Club, took center stage. The recent launch of APEChain, its dedicated blockchain network, coupled with the integration of Layer Zero, a powerful interoperability protocol, ignited a frenzy among investors and traders alike.
The news sent shockwaves through the crypto community, propelling APE's price from a modest $0.736 to a staggering $1.757 in just three days – a mind-boggling 138% increase. This dramatic surge was a testament to the growing confidence in the APECoin ecosystem and the potential of its blockchain technology.
Possible Scenarios
As the dust settled, investors were left pondering the next chapter in APE's story. Could the price continue its upward trajectory, breaching the $1.81 resistance level and challenging the psychological barrier of $2.0? Or would the recent surge prove to be a temporary high, followed by a much-needed correction or consolidation phase?
1. The Bullish Case
The potential for a continued uptrend was fueled by the positive sentiment surrounding the APEChain launch and the integration of Layer Zero. These developments positioned APE as a versatile token with multiple use cases, including governance for the ApeCoin DAO and transaction fees across various blockchains.
2. The Bearish Case
However, the crypto market is notoriously volatile, and a strong resistance level at $2.0 could pose a significant challenge. If APE fails to break through this barrier, it could lead to a price correction, potentially retracing to $1.36 or even lower. Such a scenario would require careful consideration and risk management.
3. The Neutral Outlook
A more likely scenario might involve a period of consolidation around the $1.36 to $1.70 range. This would allow investors to digest the recent gains and for the market to reassess the longer-term outlook for APE. Patience would be key during this phase, as a breakout above the resistance level could signal a resumption of the uptrend.
Conclusion
APECoin's meteoric rise is a testament to the growing appeal of the project and the potential of its blockchain technology. While the future remains uncertain, the recent developments have created a strong foundation for continued growth. Investors must approach the market with caution, carefully weigh the potential risks and rewards, and be prepared for both upside and downside scenarios.
Tips:
Trade Smarter, Not Harder with Phemex. Benefit from cutting-edge features like multiple watchlists, basket orders, and real-time strategy adjustments. Our unique scaled order system and iceberg order functionality give you a competitive edge.
Disclaimer: This is NOT financial or investment advice. Please conduct your own research (DYOR). Phemex is not responsible, directly or indirectly, for any damage or loss incurred or claimed to be caused by or in association with the use of or reliance on any content, goods, or services mentioned in this article.

ApeCoin APE price gave a ray of hope, for the first time in 2.5yWhat happened in #ApeCoin that the price gained +160% in 3 days?)
In principle, OKX:APEUSDT still has the potential to rise to $2, and then "they" can draw an inverted head and shoulders. Although, it's a bit scary to "get long" before $0.85.
At the #SUIUSDT chart has clearly worked out this pattern.
Another concern is how thin the crypto market is: a little effort and you can pump the asset so much that #APE which has been in a stable downward trend for more than 2.5 years, “jumped” to 4th place in terms of trading volume, right after CRYPTOCAP:BTC , CRYPTOCAP:ETH and CRYPTOCAP:SOL
_____________________
Did you like our analysis? Leave a comment, like, and follow to get more

APEUSDT - 15min - VOLATILITY = SWING TRADINGAPEUSDT - 15min - VOLATILITY = SWING TRADING
If you like my AT, and you agree with the approaches, please FOLLOW ME and press BOOST so we can share it with more people. We are working on an automated trading tool so that everyone can apply their strategies in a VISUAL and PROFESSIONAL way, as we present in the analysis.
Thank you!
_______________________________________________________
APEUSDT - 15min - VOLATILITY = SWING TRADING
It seems that APE will continue its rise looking for the objectives of $1.88 and secondly, $2.56.
What interests us is that it is doing so with great VOLATILITY and this allows us to do both SHORT and LONG operations in very short frames.
To go short, we have to wait for it to finish rising and for decreasing highs to be configured as in the first red line. Meanwhile, successful trades will always follow the dominant trend.
This is what we see on the 15-minute charts.
If BTC increases its volatility, APE will be a sounding board and will multiply it by 10.
Whatever you do, be careful and avoid getting embarrassed. :)
______________________________________________________
Automated Cryptocurrency Trading Bots: All these strategic alternatives can be configured with TradeX BoT, since it will allow you to position in both directions without having to block any amount per position. It will only be necessary for the conditions to be met, either downward or upward, for the orders to be executed in one direction or the other, taking the necessary deposits from your portfolio.
TradeX BoT (in development): Tool to automate trading strategies designed in TradingView. It works with both indicators and technical drawing tools: parallel channels, trend lines, supports, resistances... It allows you to easily establish SL (%), TP (%), SL Trailing... multiple strategies in different values, simultaneous BUY-SELL orders, conditional orders.
This tool is in the development process and the BETA will soon be ready for testing.
FOLLOW ME and I will keep you informed of the progress we make.
I share with you my technical analysis assessments on certain values that I follow as part of the strategies I design for my portfolio, but I do not recommend anyone to operate based on these indicators. Inform yourself, train yourself and build your own strategies when investing. I only hope that my comments help you on your own path :)

APEUSDT (ApeCoin) Updated till 20-10-24APEUSDT (ApeCoin) Daily timeframe range. we can see a massive pump today got upto several level at once. 1.549 is a hold up for now. if volume stays it can break and a clean close above 1.549 can push it further. recent retrace point at 1.137.

APEUSDT - 1h Has to correct part of the riseAPEUSDT - 1h Has to correct part of the rise
If you like my AT, and you agree with the approaches, please FOLLOW ME and press BOOST so we can share it with more people. We are working on an automated trading tool so that everyone can apply their strategies in a VISUAL and PROFESSIONAL way, as we present in the analysis.
Thank you!
_______________________________________________________
APEUSDT - 1h Has to correct part of the rise
I'll be brief, it won't be easy, it won't be linear, but it seems that APE has reached its maximum at 1.70.
Correction target : 1.24 - 1.12
The waves won't be easy to ride but there is a strategy and important goals to achieve if things are done right.
_______________________________________________________
Automated Cryptocurrency Trading Bots: All these strategic alternatives can be configured with TradeX BoT, since it will allow you to position in both directions without having to block any amount per position. It will only be necessary for the conditions to be met, either downward or upward, for the orders to be executed in one direction or another, taking the necessary deposits from your portfolio.
TradeX BoT (in development): Tool to automate trading strategies designed in TradingView. It works with both indicators and technical drawing tools: parallel channels, trend lines, supports, resistances... It allows you to easily establish SL (%), TP (%), SL Trailing... multiple strategies in different values, simultaneous BUY-SELL orders, conditional orders.
This tool is in the process of development and the BETA will soon be ready for testing.
FOLLOW ME and I will keep you informed of the progress we make.
I share with you my technical analysis assessments on certain stocks that I follow as part of the strategies I design for my portfolio, but I do not recommend anyone to operate based on these indicators. Inform yourself, train yourself and build your own strategies when investing. I only hope that my comments help you on your own path :)

Why Support and Resistance Points Are Important
Hello, traders.
If you "Follow", you can always get new information quickly.
Please click "Boost".
Have a nice day today.
-------------------------------------
(APEUSDT.P 1M chart)
Usually, the arrangement of candles is used to indicate support and resistance points.
Basically, indicators are used to indicate support and resistance points.
However, I feel like support and resistance points are needed in the 1.9101-6.7780 range.
So, there is a possibility that support and resistance points are drawn near where the fingers are pointing.
The price is currently under 1.9101, so let's check it out on another time frame chart.
In any case, the point to watch is whether it can rise after receiving support in the 1.3270-1.9101 section.
-
(1W chart)
When drawing support and resistance points using indicators, it is best to draw indicators that are currently marked with candles.
This is because it means that the current point is acting as support and resistance.
Other than that, you can mark indicators that are thought to have a longer horizontal line than other horizontal lines.
If you check the chart above, I think you'll understand what I mean.
Since the important support and resistance points are indicators that are currently marked with candles, you can create a trading strategy targeting the corresponding horizontal lines.
The sections marked as Support and Resistance on the chart correspond to those.
You can think of the remaining lines as lines that can be used for detailed strategies that allow you to conduct split transactions when conducting transactions.
In that sense, the 1.4870 point can be used for detailed trading strategies, that is, response strategies.
Accordingly, you can proceed with buying or selling.
-
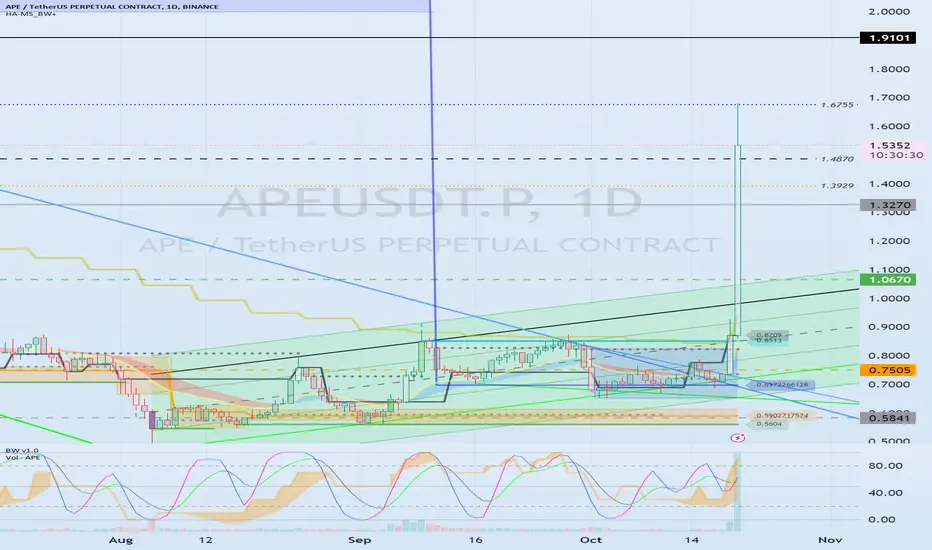
(1D chart)
The support and resistance points to be used for detailed trading strategies are indicated in the 1.320-1.9101 section.
That is, the points 1.3929 and 1.6755 are applicable.
These two points correspond to the HA-Low and HA-High indicator points.
-------------------------------------------------
If you have indicated support and resistance points on the 1M, 1W, and 1D charts as above, you can mark them according to the importance of the support and resistance points and create chart analysis or trading strategies for them.
Important support and resistance points are
1st: 0.5841-0.7505
2nd: 1.0670
3rd: 1.3270
4th: 1.9101-2.1090
You can use the points or sections above to create chart analysis or trading strategies.
When marking support and resistance points, do not draw them while thinking about chart analysis or trading strategies.
The reason is that if you do so, you will likely mark support and resistance points while reflecting your subjective thoughts and psychology.
Therefore, when marking support and resistance points, it is important to focus only on the arrangement of candles without thinking about anything else.
-
Have a good time.
Thank you.
--------------------------------------------------
- Big picture
It is expected that a full-scale uptrend will begin when it rises above 29K.
The section expected to touch the next bull market is 81K-95K.
#BTCUSD 12M
1st: 44234.54
2nd: 61383.23
3rd: 89126.41
101875.70-106275.10 (overshooting)
4th: 134018.28
151166.97-157451.83 (overshooting)
5th: 178910.15
These are points where resistance is likely to occur in the future.
We need to check if these points can be broken upward.
We need to check the movement when this section is touched because I think a new trend can be created in the overshooting section.
#BTCUSD 1M
If the major uptrend continues until 2025, it is expected to start forming a pull back pattern after rising to around 57014.33.
1st: 43833.05
2nd: 32992.55
-----------------