#APE/USDT Low Risk vs High Rewards#APE
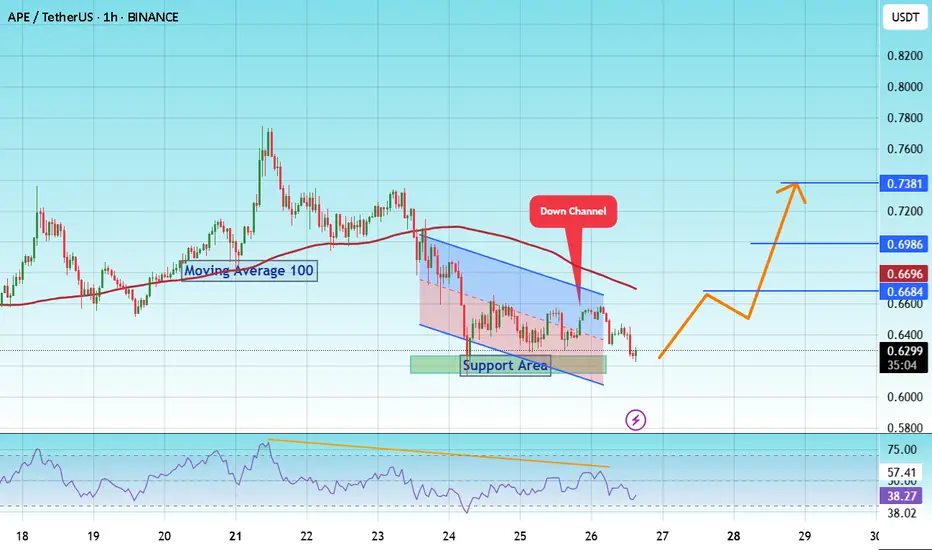
The price is moving within a descending channel on the 1-hour frame and is expected to break and continue upward.
We have a trend to stabilize above the 100 moving average once again.
We have a downtrend on the RSI indicator that supports the upward break.
We have a support area at the lower limit of the channel at 0.6080, acting as strong support from which the price can rebound.
We have a major support area in green that pushed the price upward at 0.6180.
Entry price: 0.6300
First target: 0.6633
Second target: 0.6986
Third target: 0.7380
To manage risk, don't forget stop loss and capital management.
When you reach the first target, save some profits and then change your stop order to an entry order.
For inquiries, please comment.
Thank you.
APEUSDTPERP
ApeCoin Quick Update —Moving Next#APE
The price is moving within a descending channel on the 1-hour frame, adhering well to it, and is heading for a strong breakout and retest.
We have a bounce from the lower boundary of the descending channel, this support at 0.5827.
We have a bearish trend on the RSI indicator that is about to be broken and retested, supporting the upside.
There is a major support area in green at 0.5600, which represents a strong basis for the upside.
Don't forget a simple thing: ease and capital.
When you reach the first target, save some money and then change your stop-loss order to an entry order.
For inquiries, please leave a comment.
We have a trend to hold above the 100 Moving Average.
Entry price: 0.6000.
First target: 0.6194.
Second target: 0.6378.
Third target: 0.6612.
Don't forget a simple thing: ease and capital.
When you reach the first target, save some money and then change your stop-loss order to an entry order.
For inquiries, please leave a comment.
Thank you.

APEUSDT Poised for a Breakout! Cup & Handle Pattern Forming"Classic Pattern in a Bearish Market – A Big Move is Brewing!"
🧠 Technical Analysis Summary:
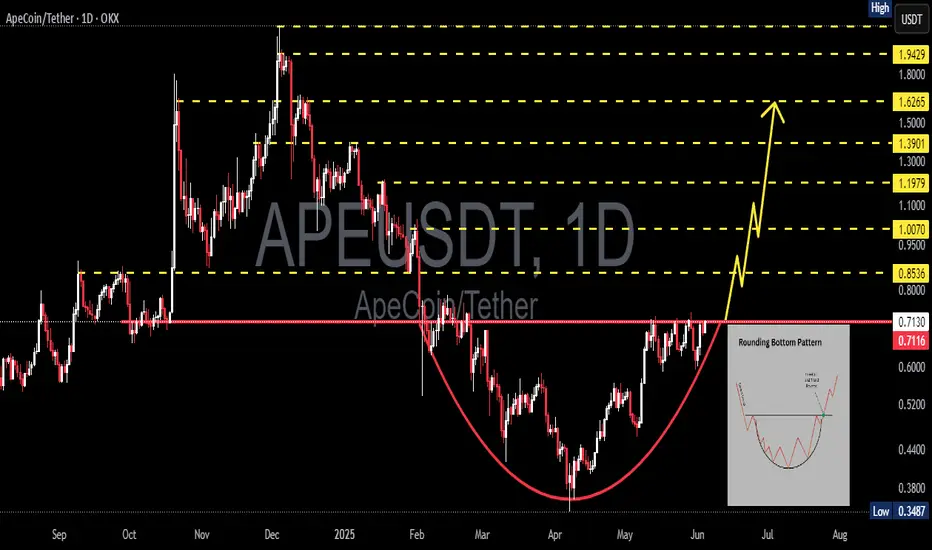
On the APE/USDT daily chart, we can clearly identify a Cup and Handle pattern, a classic bullish reversal structure that often signals the beginning of a significant rally. While many traders may be discouraged by the recent sideways movement, this formation indicates that smart money accumulation is happening quietly behind the scenes.
📌 Pattern Structure Breakdown:
🔴 The Cup:
Formed after a steep drop in late 2024, followed by a smooth rounded bottom that developed through May 2025.
The "U-shape" indicates a healthy recovery and accumulation phase, often seen before major trend reversals.
🟡 The Handle:
Currently forming a descending channel or bullish flag, representing a consolidation phase or "shakeout" before the next upward impulse.
This is typically the final dip before breakout in classic Cup & Handle formations.
📈 Key Resistance:
The yellow downward trendline is the neckline of the pattern.
A breakout above the $0.63–$0.65 zone will confirm the pattern and potentially spark a major move upward.
✅ Bullish Scenario (Upside Potential):
If a breakout is confirmed with strong volume and a daily candle closes above $0.65:
First target: $0.7452 (initial resistance)
Mid- to long-term bullish targets (measured from cup height):
🔹 $0.8658
🔹 $0.9934
🔹 $1.1931
🔹 $1.3804
🔹 $1.6171
🔹 $1.9585
🔹 $2.1669 → Main Cup & Handle Target
⏫ These targets are realistic if market sentiment turns bullish again and momentum builds.
⚠️ Bearish Scenario (Downside Risk):
If the breakout fails and price breaks down below the handle’s support zone:
Immediate support: $0.57 – $0.52
If $0.52 fails to hold:
🔻 $0.43
🔻 $0.3487 (Previous major low)
The pattern becomes invalid if the price breaks below the cup’s base at ~$0.43, suggesting bearish continuation.
📊 Additional Notes:
Volume is key. A valid breakout must be accompanied by a noticeable surge in trading volume.
Look for confirmation via RSI breakout or bullish divergence, and watch how price interacts with major moving averages.
Beware of false breakouts – a daily candle close above resistance with volume is the ideal confirmation.
💡 Final Thoughts:
APEUSDT is at a critical juncture. The nearly completed Cup and Handle pattern could be the launchpad for a major bullish rally. However, caution is advised—risk management and confirmation are essential for success in volatile crypto markets.
#APEUSDT #ApeCoin #CryptoBreakout #CupAndHandle #AltcoinAnalysis #TechnicalAnalysis #PriceAction #BullishCrypto #CryptoSetup #TradingSignal

APE/USDT – Reversal Loading Below 0.6000APE is sitting on a major multi-timeframe support zone around 0.595–0.603. Structure already shifted on the weekly — this is no longer a clean downtrend. Price has reclaimed the 0.618 Fib and is now coiling below resistance.
Entries below 0.6000 are golden.
apeing in under 0.6000 and waiting for the upside move.
Upside targets: 0.626 → 0.726 → 0.798
Risk is clear: If 0.585 fails, we could revisit 0.543 or lower.
But if it holds, the upside move is likely to be fast, sharp, and hard to catch.
This is the kind of setup where price won't give second chances once it moves.
#APE #Crypto #SwingTrade #Reversal #Altcoins
Note: Not a Finanical Advice


APEUSDT 1D AnalysisAPE ~ 1D Analysis
#APE This trade is very risky
Buy after successfully breaking this resistance line with strong volume. With a short-term target of at least 15%+.
#APE/USDT#APE
The price is moving within a descending channel on the 1-hour frame, adhering well to it, and is heading for a strong breakout and retest.
We are seeing a bounce from the lower boundary of the descending channel, which is support at 0.5060.
We have a downtrend on the RSI indicator that is about to be broken and retested, supporting the upward trend.
We are looking for stability above the 100 moving average.
Entry price: 0.5386
First target: 0.5528
Second target: 0.5720
Third target: 0.5887

#APE/USDT#APE
The price is moving within a descending channel on the 1-hour frame, adhering well to it, and is heading for a strong breakout and retest.
We are seeing a bounce from the lower boundary of the descending channel, which is support at 0.4548.
We have a downtrend on the RSI indicator that is about to be broken and retested, supporting the upward trend.
We are looking for stability above the 100 moving average.
Entry price: 0.4875
First target: 0.4718
Second target: 0.4794
Third target: 0.4875

APEUSDT 1D AnalysisAPE ~ 1D Analysis
#APE successfully broke through this resistance line, expecting a 10%+ increase from here.

#APE/USDT#APE
The price is moving within a descending channel on the 1-hour frame, adhering well to it, and is heading for a strong breakout and retest.
We are seeing a bounce from the lower boundary of the descending channel, which is support at 0.4040.
We have a downtrend on the RSI indicator that is about to be broken and retested, supporting the upward trend.
We are looking for stability above the 100 moving average.
Entry price: 0.4122
First target: 0.4223
Second target: 0.4330
Third target: 0.4464

#APE/USDT#APE
The price is moving in a descending channel on the 1-hour frame and is adhering to it well and is heading to break it strongly upwards and retest it
We have a bounce from the lower limit of the descending channel, this support is at a price of 0.4960
We have a downtrend on the RSI indicator that is about to be broken and retested, which supports the rise
We have a trend to stabilize above the moving average 100
Entry price 0.5770
First target 0.6096
Second target 0.6421
Third target 0.6856

#APE/USDT#APE
The price is moving in a descending channel on the 1-hour frame and is adhering to it well and is heading to break it strongly upwards and retest it
We have a bounce from the lower limit of the descending channel, this support is at a price of 0.534
We have a downtrend on the RSI indicator that is about to be broken and retested, which supports the rise
We have a trend to stabilize above the moving average 100
Entry price 0.580
First target 0.606
Second target 0.640
Third target 0.683

APEUSDT 6DAPE ~ 6D Analysis
#APE Buy gradually from here if you still have a Conviction on this Coin. Short -term target of at least 20%+.

#APEUSDT – Bullish Momentum DevelopingBYBIT:APEUSDT.P is trading near the local support zone around $0.7333, showing signs of potential upside movement. If the price holds above this level, a breakout towards higher resistance levels is likely. Should the bullish momentum continue, the price may reach $0.7478.
Volume remains moderate, but buyers appear to be accumulating positions. If the support at $0.7333 holds, an upward move toward the nearest resistance zones can be expected.
📊 LONG BYBIT:APEUSDT.P from $0.7333
🛡 Stop Loss: $0.7284
⏱ 1H Timeframe
✅ Overview:
➡️ BYBIT:APEUSDT.P is holding the $0.7333 support zone, which could act as a base for further upside.
➡️ A breakout above this area may lead to a stronger bullish move toward key resistance levels.
➡️ The major resistance level is at $0.7478, where profit-taking may occur.
⚡ Plan:
➡️ Enter long from $0.7333 upon confirmation of demand.
➡️ Stop-Loss at $0.7284 to minimize risks in case of a breakdown.
🎯 TP Targets:
💎 TP1: $0.7390
🔥 TP2: $0.7444
⚡ TP3: $0.7478
📢 If the price holds above $0.7333, buying pressure may increase, leading to $0.7478.
📢 However, a breakdown below $0.7284 would invalidate the bullish scenario.
🚀 BYBIT:APEUSDT.P has bullish potential – expecting a move!

#APE/USDT#APE
The price is moving in a descending channel on the 1-hour frame and is adhering to it well and is heading to break it strongly upwards
We have a bounce from the lower limit of the descending channel, this support is at a price of 0.661
We have a downtrend on the RSI indicator that is about to be broken, which supports the rise
We have a trend to stabilize above the moving average 100
Entry price 0.661
First target 0.763
Second target 0.860
Third target 0.966

#APE/USDT Ready to go higher#APE
The price is moving in a descending channel on the 1-hour frame and sticking to it well
We have a bounce from the lower limit of the descending channel, this support is at 0.950
We have a downtrend on the RSI indicator that is about to be broken, which supports the rise
We have a trend to stabilize above the 100 moving average
Entry price 1.10
First target 1.28
Second target 1.52
Third target 1.73

#APE/USDT - Ready to go up#APE
The price is moving in a descending channel on the 30-minute frame and sticking to it well
We have a bounce from the lower limit of the descending channel, this support is at 1.06
We have a downtrend, the RSI indicator is about to break, which supports the rise
We have a trend to stabilize above the moving average 100
Entry price 1.10
First target 1.16
Second target 1.23
Third target 1.30

APE planThis is my plan for APE. I will add more if the market gives me orange box. Which I think we will get.


APE Super-Pump📉💤 Current Price Dip: APE is trending near the lower support zone.
💎🛒 Buy Zone: Strong accumulation area highlighted for potential entries.
🚀💵 Profit Target: High breakout potential towards 1100% gain!
⚠️📊 Risk Alert: Monitor for volatility near support levels.
Buy Zone (🛒): Highlight the area near 1.15 to 1.35 as the "Buy Zone" with a green rectangle or label.
Take Profit Zones (💰): Mark key levels like 2.5, 3.3, 6.4, and 15.5 as profit-taking zones with horizontal lines and dollar signs.
Stop Loss (⛔): Add a red line near 0.85 for the stop-loss level to indicate a potential exit in case of further dips.
Breakout Alert (🚀): Add a rocket symbol near 3.3 to signal a key breakout level for significant upward momentum.
Target Zone (🎯): Shade the area from 6.4 to 15.5 to indicate the long-term profit zone.

#APE Ascending Triangle 📊#APE Ascending Triangle ✔️
🧠From a structural perspective, we have a big divergence after completing the goal of the head and shoulders structure. Yesterday, I was also worried that there might be extreme market conditions on Monday, so I manually reduced my position by 30% again, and I also emphasized that if the price falls to the overlapping support area again, then we can buy back the reduced position again.
➡️The result is as expected. I saw a good return again after waking up, and locked in the main profit again, which means that the band profit we have taken has reached 1000%+. Congratulations to friends who follow the wolf king to print money
➡️Currently from the perspective of the graph, we have formed an ascending triangle here, which is a bullish expectation, so we bought back the reduced position again. Will it meet expectations next?
Let's see👀
🤜If you like my analysis, please like 💖and share it💬
💕 Follow me so you don't miss out on any signals and analyze 💯
BITGET:APEUSDT.P

#APE reaches the target area📊#APE reaches the target area ✔️
🧠From a structural perspective, we have risen as expected according to the bullish head and shoulders structure. At present, the ideal target area of 1.1080-1.1433 for this structure has been fully achieved, so we should lock in major profits before looking forward to more. Congratulations to friends who followed the wolf king to print money and got rich returns. 💰🍻
➡️Friends who followed me asked where the next target area is?
This depends on the structure of market development.
➡️If we can successfully break through the previous high, it means that a larger bullish structure has appeared, and the ideal target area can be seen at 1.4198-1.5913
➡️If we first pull back and then break through the previous high, it means that the structure has changed. I will take the bullish cup and handle structure target (1.2812-1.3470) to grab profits.
We need to wait and see how it will develop👀
🤜If you like my analysis, please like 💖and share it💬
💕 Follow me so you don't miss out on any signals and analyze 💯
BITGET:APEUSDT.P

ApeCoin(APE) is Ready for Pump Again(+40%)Today, I want to analyze the ApeCoin ( BINANCE:APEUSDT ) project for you, which has increased by more than +100% in the last two or three days .
The question here is whether APE can increase again ❗️❓
The recent surge in ApeCoin (APE) price in October 2024 is due to several key factors. The most prominent is the launch of ApeChain, a new layer-3 blockchain developed by Yuga Labs, which operates on the Arbitrum network. This blockchain allows for easier management of NFTs, transactions, and decentralized applications (dApps). Additionally, the integration of cross-chain bridges for transferring assets like APE, BINANCE:ETHUSDT , and stablecoins has enhanced the token’s utility, enabling smooth interactions across multiple blockchains.
Moreover, ApeCoin upgraded its smart contracts to incorporate the LayerZero Omnichain Fungible Token (OFT) standard, allowing it to serve both as a gas and governance token within the ApeCoin ecosystem. This upgrade also enables automatic yield generation for APE holders, adding further value by allowing them to earn passive rewards without manual staking
These updates, combined with a surge in sales of Bored Ape Yacht Club (BAYC) NFTs and increased market interest, have led to a doubling of ApeCoin's value in just a few days.
---------------------------------------------------------------------
ApeCoin(APE) gained more than +100% in terms of Technical Analysis with the help of Inverted Head and Shoulders Pattern .
APE is moving near the Support zone($1.150-$0.984) and the 50% and 60% Fibonacci lines .
I expect the APE to start rising again(at least 🚀+30%🚀 ) from the Support zone($1.150-$0.984) and attack the Potential Reversal Zone(PRZ) again if the Resistance line is broken.
⚠️Note: If APE goes below the Support zone($1.150-$0.984), we have to wait for more dumps⚠️
ApeCoin Analyze (APEUSDT), Daily time frame⏰.
🔔Be sure to follow the updated ideas.🔔
Do not forget to put Stop loss for your positions (For every position you want to open).
Please follow your strategy and updates; this is just my Idea, and I will gladly see your ideas in this post.
Please do not forget the ✅' like '✅ button 🙏😊 & Share it with your friends; thanks, and Trade safe.
