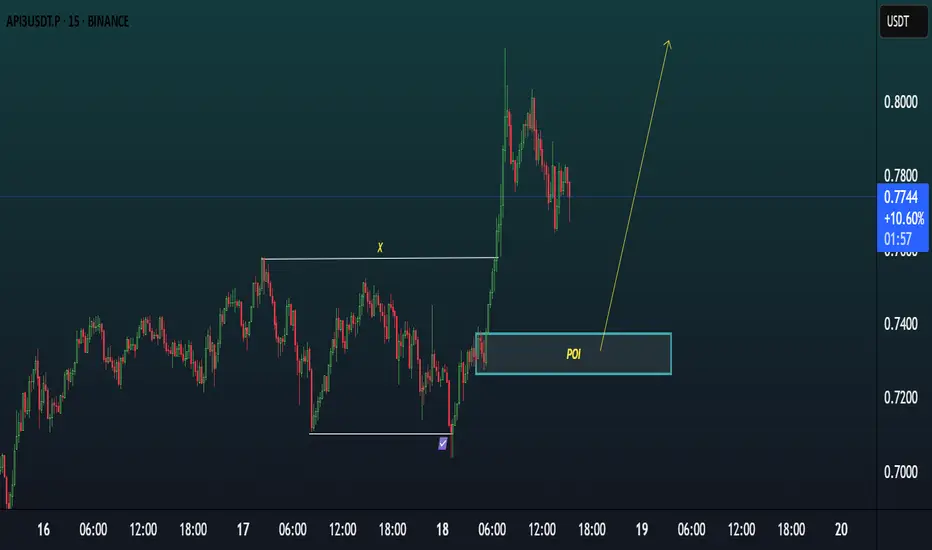
CHART OVERVIEW OF API3USDTChart Overview
Pair: API3/USDT.P
Timeframe: 15 Minutes
Current Price: 0.7728
Market Bias: Bullish (expecting a pullback into demand before continuation)
📌
Setup Summary
Strategy: Smart Money Concept (SMC) + POI (Point of Interest) + Break of Structure
POI Zone: 0.7350 – 0.7425 approx (marked with blue rectangle)
Anticipated Move: Price to retrace into the POI (Demand Zone), then bounce up towards previous highs around 0.8200+
🧠
Detailed Breakdown
1.
Break of Structure (BoS)
There’s a clear bullish Break of Structure, as price made a higher high after breaking the previous internal structure (“X”).
This confirms that buyers are in control.
2.
POI (Point of Interest)
The marked blue zone is a Bullish Order Block or Demand Zone, where institutions or smart money last pushed price upward.
This zone is expected to act as support if price revisits it.
3.
Price Action
After the impulsive move up, price is now retracing with corrective candles (seen as red bearish candles).
The expectation is that it will dip into the POI and then reverse upward.
4.
Entry Plan
Entry: Inside the POI zone (between 0.7350 and 0.7425)
Confirmation: Look for bullish engulfing candle or internal structure shift in lower timeframes (1m/5m) inside the POI.
Stop Loss: Below the POI (around 0.7300)
Take Profit: Previous high around 0.82 or higher (approx. 1:3 RR)
API3USDT
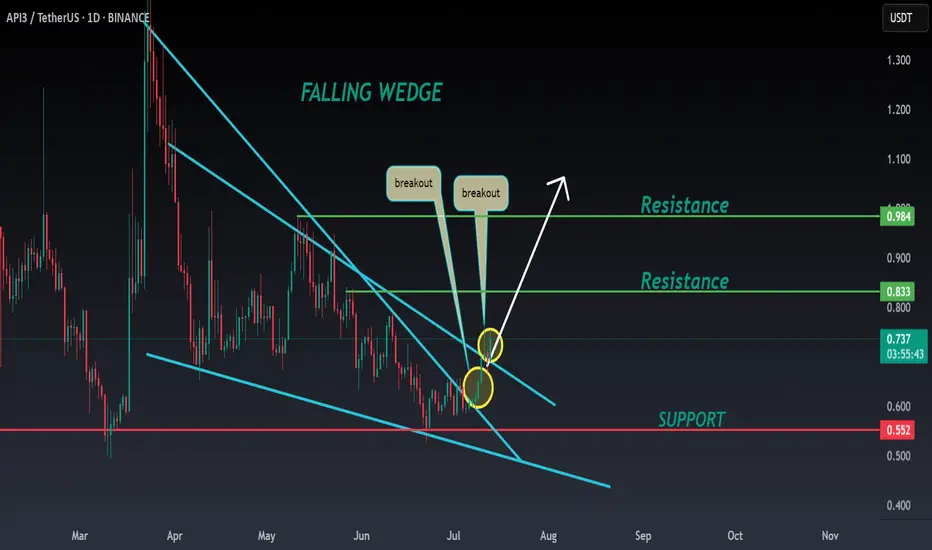
API3 ANALYSIS🚀#API3 Analysis :
🔮As we can see in the chart of #API3 that there is a formation of "Falling Wedge Pattern". In a daily timeframe #API3 broke out the pattern. Expecting a bullish move in few days if #API3 retest the levels
⚡️What to do ?
👀Keep an eye on #API3 price action. We can trade according to the chart and make some profits⚡️⚡️
#API3 #Cryptocurrency #TechnicalAnalysis #DYOR
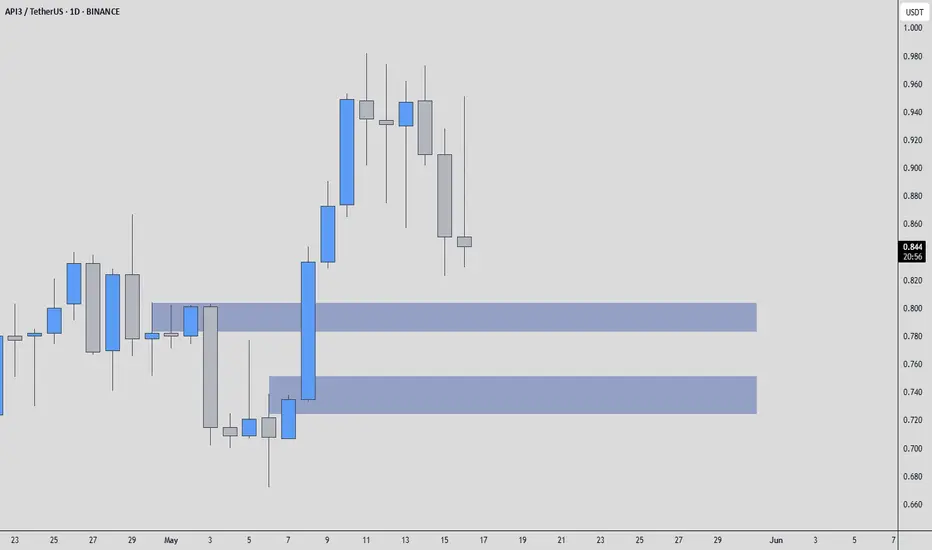
API3USDT - Looks Good!When most traders are looking at flashy pumps, I’m watching structure, confirmation, and where real buyers are hiding. In this case, the blue boxes are not just drawn for aesthetics, they represent potential accumulation zones, places where price might find its footing if approached with the right momentum and volume context.
We’ve seen this behavior before: strong drops into support, followed by subtle CDV divergence, an uptick in volume, and then a quick reclaim. That’s the kind of move that gives traders an edge, if they’re patient enough to wait for it.
But let’s be real, trading without confirmation is gambling. I say this every time: I will never insist on my long idea if the levels don’t react. If there’s no reclaim or strength in the low timeframe, I step back.
Volume, CDV, and reaction around these levels are everything. The market has been unforgiving lately, and API3 is no exception. However, these blue box zones still carry potential, if buyers show up.
📌 Stay sharp, stay flexible. This is how the highest win-rate traders operate, not by chasing, but by setting traps and waiting for price to walk in.
📌I keep my charts clean and simple because I believe clarity leads to better decisions.
📌My approach is built on years of experience and a solid track record. I don’t claim to know it all but I’m confident in my ability to spot high-probability setups.
📌If you would like to learn how to use the heatmap, cumulative volume delta and volume footprint techniques that I use below to determine very accurate demand regions, you can send me a private message. I help anyone who wants it completely free of charge.
🔑I have a long list of my proven technique below:
🎯 ZENUSDT.P: Patience & Profitability | %230 Reaction from the Sniper Entry
🐶 DOGEUSDT.P: Next Move
🎨 RENDERUSDT.P: Opportunity of the Month
💎 ETHUSDT.P: Where to Retrace
🟢 BNBUSDT.P: Potential Surge
📊 BTC Dominance: Reaction Zone
🌊 WAVESUSDT.P: Demand Zone Potential
🟣 UNIUSDT.P: Long-Term Trade
🔵 XRPUSDT.P: Entry Zones
🔗 LINKUSDT.P: Follow The River
📈 BTCUSDT.P: Two Key Demand Zones
🟩 POLUSDT: Bullish Momentum
🌟 PENDLEUSDT.P: Where Opportunity Meets Precision
🔥 BTCUSDT.P: Liquidation of Highly Leveraged Longs
🌊 SOLUSDT.P: SOL's Dip - Your Opportunity
🐸 1000PEPEUSDT.P: Prime Bounce Zone Unlocked
🚀 ETHUSDT.P: Set to Explode - Don't Miss This Game Changer
🤖 IQUSDT: Smart Plan
⚡️ PONDUSDT: A Trade Not Taken Is Better Than a Losing One
💼 STMXUSDT: 2 Buying Areas
🐢 TURBOUSDT: Buy Zones and Buyer Presence
🌍 ICPUSDT.P: Massive Upside Potential | Check the Trade Update For Seeing Results
🟠 IDEXUSDT: Spot Buy Area | %26 Profit if You Trade with MSB
📌 USUALUSDT: Buyers Are Active + %70 Profit in Total
🌟 FORTHUSDT: Sniper Entry +%26 Reaction
🐳 QKCUSDT: Sniper Entry +%57 Reaction
📊 BTC.D: Retest of Key Area Highly Likely
📊 XNOUSDT %80 Reaction with a Simple Blue Box!
📊 BELUSDT Amazing %120 Reaction!
📊 Simple Red Box, Extraordinary Results
I stopped adding to the list because it's kinda tiring to add 5-10 charts in every move but you can check my profile and see that it goes on..
API3: The Perfect Short-Term Trade Setup (174% & 289% Profits)Let me explain why this is the "perfect short-term trade setup."
You know all these Altcoins we've been tracking together they hit bottom last month, 7-April. Here API3USDT hit bottom 11-March 2025 and produced a very strong reaction. It is as if buyers were really ready to rock this one-up.
The initial bullish breakout went into retrace which is normal and this retrace ended in a higher low. So 9-April we have a higher low rather than a lower low and this support zone was found above the 3-Feb. low. Which is the session with the long lower shadow on the left.
So API3USDT went sideways after the April low—consolidation—and is now turning green. Any bullish action can result in a strong bullish jump. This is why this is the perfect chart setup. The strong reaction in March shows that interest is big for this pair. The higher low in April shows that support has been established and confirmed. Current price action opens the door for an advance any day.
The trick is to be patient. Even though it is a perfect chart setup for the short-term it can always take time before the market decides to move. Sometimes, people find a chart like this one and buy up. Prices start to grow naturally but the bots suppress the growth. Excitement dies down and people sell at a loss, but, suppression doesn't mean the end. If you wait patiently after the rush and buy FOMO crow gets out, the pair will still grow anyway. So we buy and hold and let the market take care of the rest. If you are ready to wait 1 week, prepare to wait for 1-2 months. It might sound like a lot but it is good money when you sell high after buying low. The alternative is pocketing a loss and that's a big no-no! It is better to wait and let it ride because the easiest way to win with Crypto is by knowing that the market is wild.
It can produce strong swings, it is volatile, it can shake, but, if you hold while you wait strong, profits can be great. No other market pays as much as the Cryptocurrency market, but you have to be able to detach and ignore the inevitable drops that happen. Yes prices drop, but they recover and then the recovery translates into growth. We are now facing the strongest growth phase in many years.
Thanks a lot for your support.
Namaste.

Trading opportunity for API3USDTBased on technical factors there is a Sell position in :
📊 API3USDT
🔴 Sell Now
🪫Stop loss 1.250
🔋Target 0.820
📏 R/R 1,5
💸RISK : 1%
We hope it is profitable for you ❤️
Please support our activity with your likes👍 and comments📝

#API3USDT is showing signs of recovery📉 LONG BYBIT:API3USDT.P from $1.1236
⚡️ Stop loss $1.1030
🕒 Timeframe: 1H
✅ Overview BYBIT:API3USDT.P :
➡️ The chart shows a gradual shift from a downtrend to possible reversal after forming strong support around $1.0680.
➡️ Price is currently attempting to break above the key resistance zone $1.1234–$1.1236, which also marks the potential LONG entry point.
➡️ Volume Profile indicates high trading activity above, with the Point of Control (POC) at $1.2541 — suggesting room for upside movement if breakout holds.
➡️ Bullish volume spikes suggest growing buyer interest.
➡️ Stop loss set at $1.1030, just below recent consolidation lows.
📍 Important Note:
Do not rush the entry!
Wait for a clear hold above $1.1236 before entering the LONG — entering too early may expose you to fakeouts.
🎯 Take Profit Targets:
💎 TP 1: $1.1362
💎 TP 2: $1.1544
💎 TP 3: $1.1707
⚡ Plan:
➡️ Watch for breakout confirmation above $1.1236
➡️ Enter LONG after volume or candle confirmation
📢 Consider partial profit at TP1 and move SL to breakeven for risk-free management.
🚀 BYBIT:API3USDT.P is showing signs of recovery — if the price holds above the entry zone, further upside is expected!

API3 looks bearish (2H)API3 has not issued a bearish trigger yet, but considering that it has hit a key resistance level, formed a base, and the base has been broken, it is expected that the price will be rejected downward during the pullback.
We anticipate a drop from the red zone downward.
Targets are marked on the chart.
A 4-hour candle closing above the Invalidation Level will invalidate this analysis.
For risk management, please don't forget stop loss and capital management
When we reach the first target, save some profit and then change the stop to entry
Comment if you have any questions
Thank You

API3USDT(Api3) Updated till 22-03-25API3USDT(Api3) Daily timeframe range. PA having a continuous pullback from its new low. 1.252 is recent resistance if it can get valid close above it, it got long way to go. local support at 0.815 if it dont breaks it will push back.

#API3USDT is setting up for a breakout📉 Long BYBIT:API3USDT.P from $0,8985
🛡 Stop loss $0,8543
1h Timeframe
⚡ Plan:
➡️ POC is 0,8185
➡️ Waiting for consolidation near resistance and increased buying activity before the breakout.
➡️ Expecting an impulsive upward move as buy orders accumulate.
🎯 TP Targets:
💎 TP 1: $0,9300
💎 TP 2: $0,9630
💎 TP 2: $0,9900
🚀 BYBIT:API3USDT.P is setting up for a breakout—preparing for an upward move!

API3 2025 Cycle Profit TargetsMy Bull case for API3 (oracle play) in 2025. FIBs line up for Profit taking in three zones, and if late in the game, there is a Profit target in the lower range.
Stunted market = less profit

API3USDT 6DAPI3 ~ 6D
#API3 If you still have Conviction on this coin,. This support block would be a very good buying spot for now with a target of at least 20%

#API3 (SPOT) entry range ( 1.270- 1.480) T.(3.259) SL(1.238)BINANCE:API3USDT
entry range ( 1.270- 1.480)
Target (3.259)
SL .1D close below (1.238)
Golden Advices.
**********************
* collect the coin slowly in the entry range.
* Please calculate your losses before the entry.
* Do not enter any trade you find it not suitable for you.
* No FOMO - No Rush , it is a long journey.
Useful Tags.
**********************
My total posts
( www.tradingview.com )
1Million Journey
( www.tradingview.com )
( www.tradingview.com )
********************************************************************************************************************** #Manta ,#OMNI, #DYM, #AI, #IO, #XAI , #ACE #NFP #RAD #WLD #ORDI #BLUR #SUI #Voxel #AEVO #VITE #APE #RDNT #FLUX #NMR #VANRY #TRB #HBAR #DGB #XEC #ERN #ALT #IO #ACA #HIVE #ASTR #ARDR #PIXEL #LTO #AERGO #SCRT #ATA #HOOK #FLOW #KSM #HFT #MINA #DATA #SC #JOE #RDNT #IQ #CFX #BICO #CTSI #KMD #FXS #DEGO #FORTH # AST #PORTAL #CYBER #RIF #ENJ #ZIL #APT #GALA #STEEM #ONE #LINK #NTRN #COTI #RENDER #ICX #IMX #ALICE #PYR #PORTAL #GRT #GMT # IDEX #NEAR #ICP #ETH #QTUM #VET #QNT #API3 .

API3 Bullish Gartley.An oracle project whose price has been under pressure for a long time.
* What i share here is not an investment advice. Please do your own research before investing in any digital asset.
* Never take my personal opinions as investment advice, you may lose all your money.

#API3USDT: Could Bull Sustain the Current Bullish Momentum? Yello, Paradisers! Can #API3USDT really sustain its bullish momentum or is a downturn ahead? Let’s break down the critical levels and key scenarios for #API3:
💎After breaking through the descending resistance of its falling wedge pattern, #API3USDT is showing promising bullish momentum. However, it’s now approaching a high supply zone between $2.13 and $2.30—a significant resistance level that could act as a hurdle. Should it successfully rally beyond this zone, we could see a shift in market structure, opening up the potential for #API3 to target higher resistance levels.
💎But let’s also consider the downside risks. If #API3 fails to sustain its position near the demand zone around $1.22, it may slip down further to test the major support between $0.98 and $1.04. This support range, aligned with a previous low, serves as a crucial price floor. For the bullish momentum to hold, the price must reclaim the demand zone with strength; otherwise, a sustained move below could hint at a breakdown.
💎Now, here’s the game-changer: If we see a daily close under the $0.98 support level, the bullish outlook would be invalidated, putting #API3 at risk of forming a new lower low. This scenario would likely trigger further declines and could shift market sentiment to a bearish stance.
Always aim for precision and keep a close eye on the critical zones to maximize your trading edge.
MyCryptoParadise
iFeel the success🌴

API3USDTAPI3 ~ 3D
#API3 currently forming a descending channel pattern. If you still have Conviction on this coin,. Wait for this pattern to be successfully broken and buy gradually. with a minimum target of 20%++

API3 Are you ready for 4$ Pump Don't miss the API3 move after breaking that accumulation phase , many fakeout breakout touching 2 $ area but without successful flipping it to support , Whales will Pump that Coin very hard as expected after BTC moves sideways , Long and Chill without leverage

$API3 all unlocked!The manipulation market never ceases to amaze and works from the same script. There was no distribution in this asset, most of the issue is concentrated in the hands of the team, DWF Labs and hedge funds.
Horban Brothers!

Bullish on API31. We have bodies closing above the OB+ Wick in H4 (Bodies telling the story)
2. We have an MSS and CISD
3. We have good draws the buyside liquidity
4. Sell program is already over hence repricing should be higher

API3 - Will it retrace ?#API3/USDT #Analysis
Description
---------------------------------------------------------------
+ Price had significant retracement from 4.8 to 1.08 with -76% crash from recent high
+ it is trading around the local support zone and we are seeing significant retrace from the crash.
+ If this support holds then we can expect a sharp bounce back from the support zone.
---------------------------------------------------------------
VectorAlgo Trade Details
------------------------------
Entry Price: 1.415620298
Stop Loss: 1.009165284
------------------------------
Target 1: 1.7841
Target 2: 2.3682
Target 3: 3.3682
Target 4: 4.9078
Target 5: 9.1698
------------------------------
Timeframe: 1W
Capital Risk: 1-2% of trading amount
Leverage: 5-10x
---------------------------------------------------------------
Enhance, Trade, Grow
---------------------------------------------------------------
Feel free to share your thoughts and insights.
Don't forget to like and follow us for more trading ideas and discussions.
Best Regards,
VectorAlgo

API3USDT - LONG [Daily Signal] [UPDATE]Long is getting better and better. Buy. Buy. Buy.
Circles are price magnets ;D

API3 Analysis: Possible Scenario for Bull-RunAPI3 is on the verge of breaking through a long-term resistance level. I expect the price to make another low before starting a move from the support level at $1.53. The targets I have in mind are $14 and $27

Trade Idea for API3 (API3) - Accumulation StrategyAPI3 is currently trading around $2.28, having seen a decline of approximately 3.46% in the last 24 hours and a 6.28% decline over the past week. The market cap is roughly $262 million, with a circulating supply of 110 million API3 tokens.
Initiate a position at the current price level of $2.28. This price provides a strategic entry point considering the recent downturn and potential for rebound.
If the price drops further, plan to accumulate additional API3 tokens at the following levels: $2.25, $2.00, and $1.50. This strategy allows for averaging down the entry price and capitalizing on market dips.
Establish a series of take-profit targets to maximize returns. The initial targets are $3.50 and $4.25, followed by higher targets at $5.75 and $7.00. These levels are chosen based on psychological resistance points and potential for substantial upside as the market recovers.
API3 aims to provide decentralized versions of APIs, solving the connectivity issues faced by smart contracts. Its unique approach to the oracle problem, through Airnode, enhances transparency and reduces costs. The project has gained significant traction and has a clear roadmap for future developments.
The current market sentiment around API3 is neutral, with a Fear & Greed Index indicating "Greed." This could suggest a good buying opportunity as investor sentiment remains positive despite recent price declines.
Accumulating API3 at strategic price points leverages market volatility and the potential for future growth. The phased profit-taking strategy is designed to capture gains as the market potentially appreciates, driven by API3’s innovative solutions in the blockchain space.
This trade idea is based on current market data and API3’s strategic positioning as of May 2024. Cryptocurrency investments carry inherent risks, including the loss of principal. Investors should conduct their own research and consider their financial circumstances and risk appetite before engaging in cryptocurrency trading. This analysis is not financial advice.

API3 Weekly Accumulation - Entering MarkupAPI3 is taking off on the weekly as it finishes up this macro accumulation and enters the markup phase. Most altcoins are in a similar position - about to go vertical. If you don't already have your bags filled, last call!
