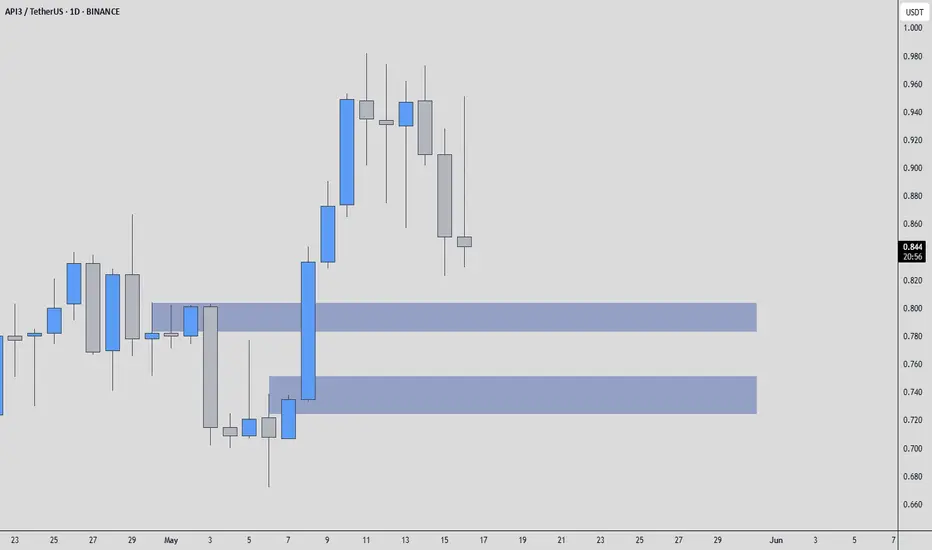
API3USDT - Looks Good!When most traders are looking at flashy pumps, I’m watching structure, confirmation, and where real buyers are hiding. In this case, the blue boxes are not just drawn for aesthetics, they represent potential accumulation zones, places where price might find its footing if approached with the right momentum and volume context.
We’ve seen this behavior before: strong drops into support, followed by subtle CDV divergence, an uptick in volume, and then a quick reclaim. That’s the kind of move that gives traders an edge, if they’re patient enough to wait for it.
But let’s be real, trading without confirmation is gambling. I say this every time: I will never insist on my long idea if the levels don’t react. If there’s no reclaim or strength in the low timeframe, I step back.
Volume, CDV, and reaction around these levels are everything. The market has been unforgiving lately, and API3 is no exception. However, these blue box zones still carry potential, if buyers show up.
📌 Stay sharp, stay flexible. This is how the highest win-rate traders operate, not by chasing, but by setting traps and waiting for price to walk in.
📌I keep my charts clean and simple because I believe clarity leads to better decisions.
📌My approach is built on years of experience and a solid track record. I don’t claim to know it all but I’m confident in my ability to spot high-probability setups.
📌If you would like to learn how to use the heatmap, cumulative volume delta and volume footprint techniques that I use below to determine very accurate demand regions, you can send me a private message. I help anyone who wants it completely free of charge.
🔑I have a long list of my proven technique below:
🎯 ZENUSDT.P: Patience & Profitability | %230 Reaction from the Sniper Entry
🐶 DOGEUSDT.P: Next Move
🎨 RENDERUSDT.P: Opportunity of the Month
💎 ETHUSDT.P: Where to Retrace
🟢 BNBUSDT.P: Potential Surge
📊 BTC Dominance: Reaction Zone
🌊 WAVESUSDT.P: Demand Zone Potential
🟣 UNIUSDT.P: Long-Term Trade
🔵 XRPUSDT.P: Entry Zones
🔗 LINKUSDT.P: Follow The River
📈 BTCUSDT.P: Two Key Demand Zones
🟩 POLUSDT: Bullish Momentum
🌟 PENDLEUSDT.P: Where Opportunity Meets Precision
🔥 BTCUSDT.P: Liquidation of Highly Leveraged Longs
🌊 SOLUSDT.P: SOL's Dip - Your Opportunity
🐸 1000PEPEUSDT.P: Prime Bounce Zone Unlocked
🚀 ETHUSDT.P: Set to Explode - Don't Miss This Game Changer
🤖 IQUSDT: Smart Plan
⚡️ PONDUSDT: A Trade Not Taken Is Better Than a Losing One
💼 STMXUSDT: 2 Buying Areas
🐢 TURBOUSDT: Buy Zones and Buyer Presence
🌍 ICPUSDT.P: Massive Upside Potential | Check the Trade Update For Seeing Results
🟠 IDEXUSDT: Spot Buy Area | %26 Profit if You Trade with MSB
📌 USUALUSDT: Buyers Are Active + %70 Profit in Total
🌟 FORTHUSDT: Sniper Entry +%26 Reaction
🐳 QKCUSDT: Sniper Entry +%57 Reaction
📊 BTC.D: Retest of Key Area Highly Likely
📊 XNOUSDT %80 Reaction with a Simple Blue Box!
📊 BELUSDT Amazing %120 Reaction!
📊 Simple Red Box, Extraordinary Results
I stopped adding to the list because it's kinda tiring to add 5-10 charts in every move but you can check my profile and see that it goes on..
API3USDTPERP
#API3USDT is showing signs of recovery📉 LONG BYBIT:API3USDT.P from $1.1236
⚡️ Stop loss $1.1030
🕒 Timeframe: 1H
✅ Overview BYBIT:API3USDT.P :
➡️ The chart shows a gradual shift from a downtrend to possible reversal after forming strong support around $1.0680.
➡️ Price is currently attempting to break above the key resistance zone $1.1234–$1.1236, which also marks the potential LONG entry point.
➡️ Volume Profile indicates high trading activity above, with the Point of Control (POC) at $1.2541 — suggesting room for upside movement if breakout holds.
➡️ Bullish volume spikes suggest growing buyer interest.
➡️ Stop loss set at $1.1030, just below recent consolidation lows.
📍 Important Note:
Do not rush the entry!
Wait for a clear hold above $1.1236 before entering the LONG — entering too early may expose you to fakeouts.
🎯 Take Profit Targets:
💎 TP 1: $1.1362
💎 TP 2: $1.1544
💎 TP 3: $1.1707
⚡ Plan:
➡️ Watch for breakout confirmation above $1.1236
➡️ Enter LONG after volume or candle confirmation
📢 Consider partial profit at TP1 and move SL to breakeven for risk-free management.
🚀 BYBIT:API3USDT.P is showing signs of recovery — if the price holds above the entry zone, further upside is expected!

#API3USDT is setting up for a breakout📉 Long BYBIT:API3USDT.P from $0,8985
🛡 Stop loss $0,8543
1h Timeframe
⚡ Plan:
➡️ POC is 0,8185
➡️ Waiting for consolidation near resistance and increased buying activity before the breakout.
➡️ Expecting an impulsive upward move as buy orders accumulate.
🎯 TP Targets:
💎 TP 1: $0,9300
💎 TP 2: $0,9630
💎 TP 2: $0,9900
🚀 BYBIT:API3USDT.P is setting up for a breakout—preparing for an upward move!

API3USDT 6DAPI3 ~ 6D
#API3 If you still have Conviction on this coin,. This support block would be a very good buying spot for now with a target of at least 20%

API3USDTAPI3 ~ 3D
#API3 currently forming a descending channel pattern. If you still have Conviction on this coin,. Wait for this pattern to be successfully broken and buy gradually. with a minimum target of 20%++

Api3 New HighCan we get a straight forth leg correct?(maybe not) but if it holds here it can go to 6.
Took some risk on longs api3 from below 4.08.
Stoploss at 4.
Note: Not a Financial Advice

API3/USDTBINANCE:API3USDT.P
This idea has a medium-term profit target.
All targets are indicated on the graph.
- Risk 1% on deposit
- R/R 1/2
P.S (This is not an investment recommendation, this is my personal opinion.)

#API3 Forming ascending triangle pattern!#API3 BINANCE:API3USDT is forming an ascending triangle. it has support of MA 50, trendline, and the Ichimoku cloud support.
A solid breakout of the triangle would be the bullish confirmation, while a rejection would be a sign of further movement inside the triangle.
Entry Point: CMP and add more up to $3
Targets: $3.6, $4, $4.5,$4.7,$5.5,$6.9 estimated profits of 120%.
Stop Loss (SL): Set at $2.86 manage risk effectively.
It's crucial to have a stop loss in place to manage risk. Always be cautious and consider risk management strategies.
#DYOR

API3 Flush?Already in a low leverage swing short from 2.8.
Was Targeting 1.9 at least didn't hit the target yet.
Adding leveraged margin from here around 2.4100.
Because expecting a quick flush from here towards 2.
Will close if the whole position if breaks this level.
Note: Not a Financial Advice.

Api3 longDCA longing api3 with tight stoploss.
The 2hr closed above very important area indicating a higher run.
Longing 1.56 and below.
Targeting 2
Closing if doesn't hold 1.52.
Note: Not a Financial Advice.

API3 LongAlready in a swing long on this one idea from here.
But longed here with leverage and margin again from here(1.7550) with tight sl.
Sl at recent low.
Risk Reward good from here and already up on my position so taking risk here is good for me.
Expecting it to send sooner.
Targeting 2 and 2.2
Note: Not a Financial Advice.
DYOR

#api3 will explode someday?- Very well accumulated.
- Trend support for 4 times
- Falling wedge and rested RSI
These are good signs. Breaking down the wedge is the invalidation and road to Magma.
NOT FINANCIAL ADVICE.

API3 LONG SIGNAL 30MINHello dear traders
In api3 currency, we can look for long positions in 15 and 30 minute time frames.
The formed pivot has good credibility and even though the trade is in the opposite direction, there is a possibility that the price will grow.
Thank you for your support
Be profitable and happy

API3 retest below 0.9?Hello friends, I don't know what the condition of BTC will be and whether we will really test lower levels and GAP around 22-20k, however if so I expect something similar with API3.
It's clean, SL above breakout and profit in two parts + be patient.
Of course, I'll explain the situation you described in English.
An ascending triangle is a technical analysis pattern used in trading various assets, including cryptocurrencies. It consists of two trendlines: one is a diagonal trendline connecting the highs of price points, and the other is a horizontal level representing a certain resistance or support.
The drop in the price of the API3 cryptocurrency from the ascending triangle and the subsequent testing of the ascending trendline can have a few implications:
Breakout of the Ascending Triangle: A drop in price outside the triangle pattern can signal weakening demand or a change in trend. If the price of the API3 cryptocurrency fell below the lower diagonal line of the triangle, some traders might believe that the ascending trend has been disrupted and a price decline might follow.
Testing the Ascending Trendline: After breaking out of the ascending triangle, the price might attempt to test the previously diagonal trendline as a new resistance level. This is a common scenario; if the price doesn't stay above this line, it could confirm that the earlier upward trend has been broken.
Expectation of Price Decline: From your explanation, it seems you expect the value of the API3 cryptocurrency to decrease. This expectation could be based on technical analysis, where you observed the breakout from the ascending triangle and the subsequent testing of the ascending trendline. This might suggest that the market lacks the strength to sustain the price at a higher level and a decline could follow.

API3 might follow LPTHello Traders,
As you can see, API3 is so similar to LPT and might follow LPT in the next few days.
Funding rate is still negative and we can see short squeeze like LPT.
Please hit the boost button and follow me for more ideas.
Thanks.

Api3/usdt One More Bullish move loading Api3usdt
I think the price of Api3/USDT will break out of the triangle shape it's in and go up by around 20-30%. This is because, if you're someone who trades actively, you've probably noticed that on Sundays, the value of a certain coin goes up a lot. This weekend, I believe this will happen to both Api3 and Lpt. Lpt has already gone up by over 30%, so now I think it's Api3's turn. Just remember, this trading idea is only for the weekend.
Important: I'm not giving financial advice. Before you make any decisions, please do your own research. Good luck! If you like what we're saying, please support us.

Shorting API3USDTShoring API3USDT from 1.26
its long term bearish trend going on, sudden big hike of 50% is looking fake, I am in short with initial target 1.2 then 1.15 and 1 with extension
Good luck, Happy Shorting Weak Coins

API3 token formed bullish Gartley for upto 165% pumpHi dear friends, hope you are well and welcome to the new trade setup of API3 token with BTC pair.
In the previous trade we had almost 41% pump, and the priceline was very close to hit the sell zone, but drpped down just before reaching the target as below:
Now on a 4-hr time frame, API3 is about to complete the final leg of a bullish Cypher pattern.
Note: Above idea is for educational purpose only. It is advised to diversify and strictly follow the stop loss, and don't get stuck with trade

API3 token forming bullish Cypher for upto 12% pumpHi dear friends, hope you are well and welcome to the new trade setup of API3 token with BTC pair.
In the previous trade we had almost 41% pump, and the priceline was very close to hit the sell zone, but drpped down just before reaching the target as below:
Now on a 4-hr time frame, API3 is about to complete the final leg of a bullish Cypher pattern.
Note: Above idea is for educational purpose only. It is advised to diversify and strictly follow the stop loss, and don't get stuck with trade

API3 TO £260- Circulating Supply - 56,547,601
- Market Cap - £80,520,432 (17/10/22)
- Current price - £1.42
- ROI Potential - 185 X
- Market cap goes from £80,520,432 to: £14,896,279,920

API3 BUY THE BREAKOUT 20221002Buy when breaking through the resistance
API3, API3USD , API3USDT , API3USDTPERP , API3BUSDPERP, CRYPTO, CRYPTOCURRENCY
DISCLAIMER
This is only a personal opinion and does NOT serve as investing NOR trading advice.
Please make your own decisions and be responsible for your own investing and trading Activities.

API3USDT Falling Wedge!API3USDT Technical analysis update
Buy zone : $1.610 - $1.64
Stop loss : $1.49
TP 1 : $1.737
TP 2 : $1.855
TP 3 : $2.05
Always keep stop loss
Thanks
Hexa

Buying API3 for +330% profitHello traders!
Welcome back to another episode with analyst Aadil1000x.
Today is a great day as we have caught the trade of the month and it's now in a great position to go long.
The strength of the bullish pattern in API3 is so strong that it will pull up at least +30%.
We can use 10x leverage in this trade and with this leverage, we will gain +330% profit at the target.
Stoploss 1.461(-5.6%)
Target 1, 1.832(+17.5%)
Target 2.069(+33.66%)
