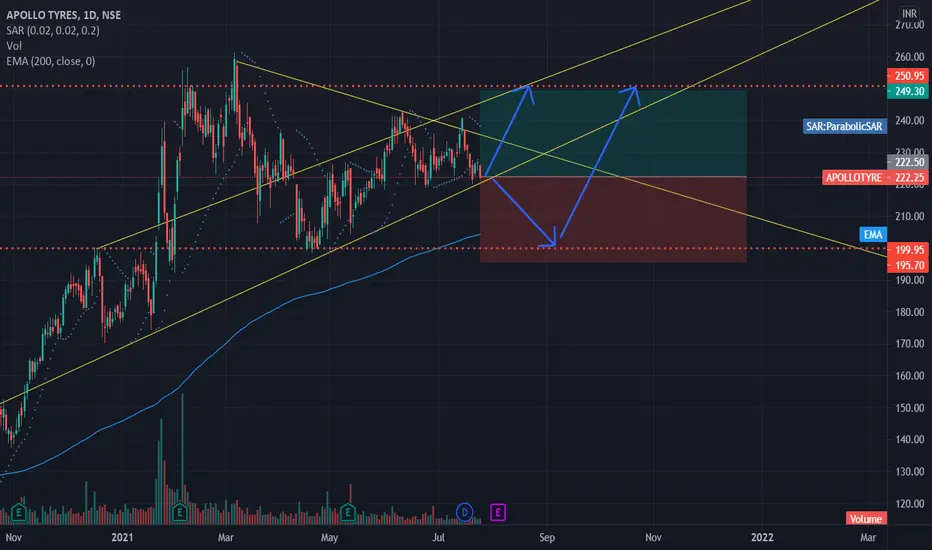
APOLLO TYRES - 240 MINS CHARTThe Structure looks good to us, waiting for this instrument to correct and then give us these opportunities as shown on this instrument (Price Chart).
Note: its my view only and its for educational purpose only. only who has got knowledge about this strategy, will understand what to be done on this setup. its purely based on my technical analysis only (strategies). we don't focus on the short term moves, we look for only for Bullish or Bearish Impulsive moves on the setups after a good price action is formed as per the strategy. we never get into corrective moves. because it will test our patience and also it will be a bullish or a bearish trap. and try trade the big moves.
we do not get into bullish or bearish traps. we anticipate and get into only big bullish or bearish moves (Impulsive moves).
Just ride the bullish or bearish impulsive move. Learn & Know the Complete Market Cycle.
buy low and sell high concept. buy at cheaper price and sell at expensive price.
Keep it simple, keep it Unique.
please keep your comments useful & respectful.
Thanks for your support....
Apollotyres

ApolloTyre on Weekly TimeFrameBreakout expected on Apollo Tyre. Hence expecting a breakout and then confirmation on Weekly Timeframe. NSE:APOLLOTYRE

APOLLO TYRES- 12% Target
Using Super Trend Indicator, Buying Signal is ON, Waiting for a Retest.
Targets will be pivots.
Proper Risk: Reward is necessary.
This is for Educational purposes only.
Kindly take this idea as learning.

Apollo Tyres Long Term Bearish Movement Expected 145.95 Is Where Apollo Settle In The next Few Years


Apollo tyresTrading in up trend.
Earnings days on the ways . Once cross the 200 ma it's easy to go up.
Good for swing trade. 😎

#Apollo Tyre #Flag Apollo Tyre 1W: Nice flag formation appears to be complete. Prolonged consolidation helped to form a copy book flag. RSI is at support. EMAs stacking well. Good to accumulate between 215 - 205 SL 195 for price tgt 275 - 300.

ApolloTyer long position TradeApolloTyer long position for Cash/Futures
ApolloTyer into Demand Zone now, you can take the entry from 209.30-210 with the Stop loss if a daily candle close below 202 then exit with a loss
Stay Tuned with us on social media as well as Trading View for future updates.
What we believe in:-
°Trade With Logic
°Take Time Before Investment
Saving Your Capital 🙂
I'm not responsible for your profit or loss.
Mainly Stock & Crypto Investor 🕵️
| The Indus Trader 📊
DISCLAIMER:- This Channel Is For ( EDUCATIONAL PURPOSE )

apollo tyre if are are breaking weekly - 252 rs , resistance then stop atleast --- 30 to 40% up side

Apollotyre- 15 Min (Intraday)- LongEntry is subjective when conditions are fulfilled.
All levels are mentioned in the chart.
Follow proper risk management.
Happy Trading!:-)

APOLLOTYRE triangle patternAnalysis on APOLLOTYRE triangle pattern bullish breakout and retest done.

Apollo Tyre 1hr Chart Symmetric Triangle 08 Oct 2021Apollo Tyre 1hr Chart formed Symmetric Triangle 08 Oct 2021. Watch out for Breakout. Need to cross the resistance zone 239-244 for the Target 260. Let me know what do you guys think.

ApolloTyre 1hr Chart Asending Triangle Retest 29 Sept 2021ApolloTyre 1hr Chart Asending Triangle Breakout. Retest with Descending Triangle. Wait for Breakout. 29 Sept 2021

Enter after the breakout - Apollo tyreEnter after the breakout or at the Retesting. Can also hold till November 1st week if there is a breakout.

APOLLOTYRE LONGapollotyre giving breakout from symetrical triangle can buy at cmp with sl of 219
for education purpose Do your own research

APOLLO TYRES*B/O of a channel in Apollo Tyre.
Stop below the last swing-high ≈ 220
Target ≈ 255
*Only for education purpose.


ApolloTyre Short Term ReversalThe stock has reached lower trend line and took support and is ready for a reversal rally provided the breakout of the triangle pattern nearing its end. Trade is supported by brokerage calls and major supports before SL levels. Target is placed near all time high with a risk reward ratio of 1:1. In case of a breakdown of the current triangle pattern it may take the major support and bounce back.
APOLLOTYRE LONGApollo tyre looks for for short/long term swing based on PAT.
SL below 219.
Gap up can be a huge factor for breakout.


Apollo at attractive levelsAnother stock that came on my radar is apollo tyre.
The stock has been moving in a range for the past 4 months.
Last week its closed well near its highs.
Now if the stock sustains 190 levels on the weekly basis, the stock might test its upper range 240- 255.
And if the range breaks on the upside, the stock could test its all-time highs i.e. 307.25.

APOLLOTYRE LONG INTRADAY 14 MAY, 2021Dear trader,
If u look at the chart of APOLLOTYRE (analysis based intraday only) the APOLLOTYRE Buy at 222 and
Target at 232
Best Buy at 218.
Our Best Buy is based on high quality research and when the instrument reaches this level , it’s a jackpot trade.
Best Buy level might be executed or might not be executed.
The chart clearly indicates Bullish Trend you can also see the candle stick patters for more indepth analysis.
In Intraday most important thing is to enter and exit points.
Our signals are based on analytics, algorithms, mathematical derivatives.
Always be a responsible trader, kindly trade only when you have maximum opportunity in the market with minimum risk and with keynotes like data, analysis and proper strategies.
Kindly message us for strategies and analysis.

#Apollo Tubes LONG - High returnsPrice action and trend is solid, daily + weekly! Bought today.
Trade idea inspired from my homie: Akul Bansal
