$AMC squeeeeze!!!took a small position on AMC because i believe a short squeeze is coming and this stock is a company that I like. its a strong hold imo
PT in green.
this is not an analysis play this is a company That I believe in long term with many things in favor of a long idea. including relative strength in poor market conditions.
this is not financial advice. just an opinion of an average investor.
APPL

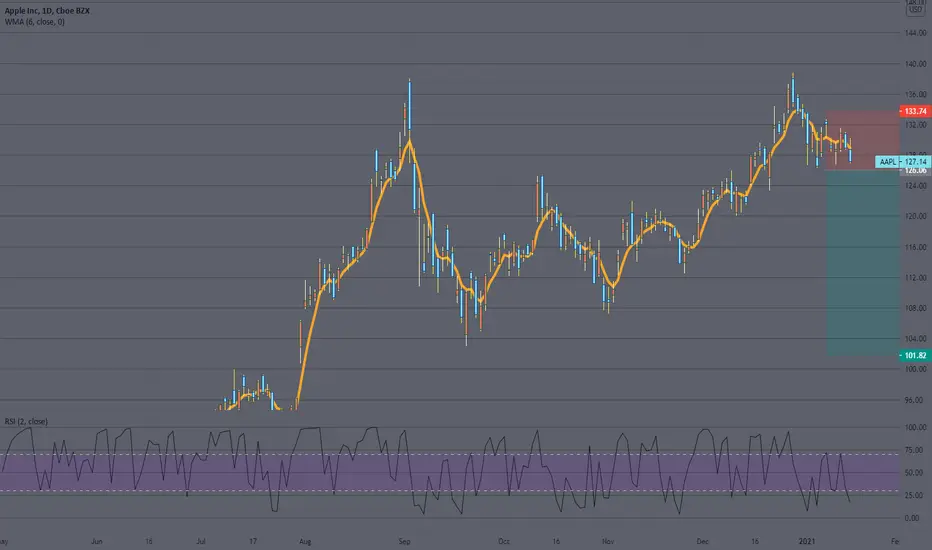
APPL Falls after Earnings. Here is the Recovery.Lets get to this bag.
APPL falls from all time price of 145 after the release of a "great" earnings report.
I consider myself a swing trader and typically hold option positions anywhere from 1 to 60 days max.
Most of my option plays have an expiration date of no less then 30 days from the time open the position.
I want to draw your attention to the yellow highlighted circles on the chart. Circle 1 indicates the support forming between the prices of 126 and 129. I expect price to come down to test these areas and bounce off the upward "black" trendline as my first signal of a buy confirmation.
In the event that the "black" trendline has been compromised and does not hold the "blue" Support line has been tested several times this month and respectively held its own in support. A bounce off of the "blue" support line acts as my 2nd signal of a buy confirmation.
As the 3rd signal of a buy confirmation see the highlighted yellow circle towards the bottom. This is the RSI indicator. It is clearly in the oversold area which means this could be a text book buy. I don't necessarily see any divergence between the price and the RSI which would of been a strong 4th confirmation.
If these support levels hold strong i see APPL going back up to test the 145 all time high sometime during late February.
If you like this analysis please like and follow. This will encourage me to do more.
Good luck trading.

God loves trinity!Hmm, i've seen very interesting situation by Apple graph... Do you think this growth is endless?
I don`t know how long it to go up else, but i would be find point to open short.
Good Luck Have Fun!

APPLE: perfect reaction from the Blue BoxApple bounced form the Blue Box as expected.Will the trend resume or not?

Buy Apple 4/1/2021Apple stock is moving in a short-term upward trend
The stock is testing the moving average of 13
So, you can buy with a target of 146, a stop loss of 120.88 good luck

APPLE making new up trend.Apple broke previous resistance (136) and I think it can retest this resistance before continue its uptrend my target is next resistance (150).
See my previous analysis.
If you agree then like and support me.
Mention your thought in comments :)

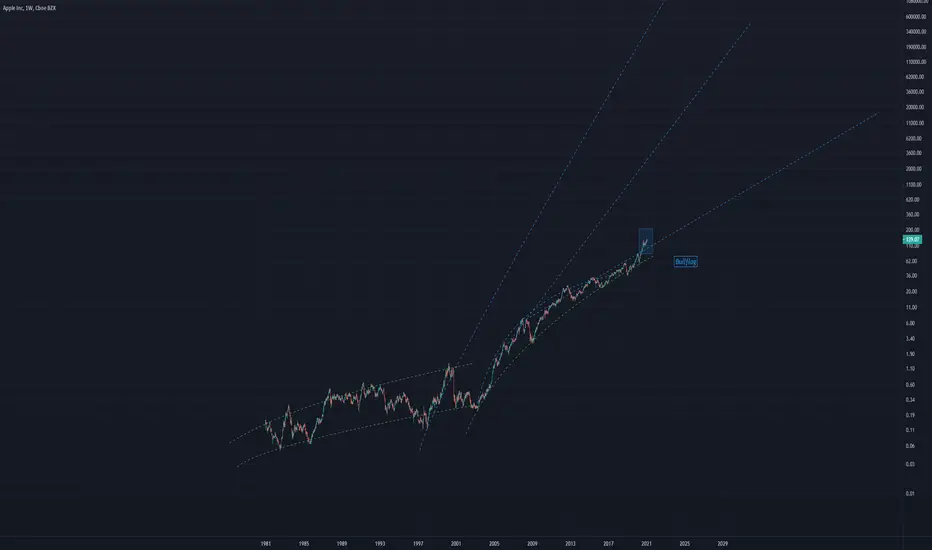
APPLE LongApple showing signs of a bullflag
this is the weekly chart so going long would be necessary
very bullish
Apple doing what Apple doesApple is breaking multiple top resistance and 1 day MACD has ticked bullish... big pop coming and this Apple rally is not over... keep buying it and I hope you been buying it like I been saying... Apple going to make me money this week like it been doing


Will Apple be able to break its key resistance level?AAPL looks great! Currently sitting in an ascending triangle with a key resistance level at ~$137.60. AAPL tried to break that resistance twice and might be able to finally break it on the third attempt. Best to hold on for now and long the breakout or wait for confirmation and long the retest.

Apple to New Heights 🚀 - Ascending Triangle in Bullish MarketLooking like Apple is about to make a new high. Bullish market, ascending triangle pattern, more likely than not to continue.

APPL stock - DOUBLE HIGH for APPLEApple has made a double high formation at $140, which leads to a price drop. I see it as a little bit risky to short APPL, so I am inclined to open LONG positions at $113 and $101.
If we cross the double high, let's enter the LONG positions during the pullback from the top of $140.

$AAPL Long via 134 calls see chart, jan 08 21 expiry looking to get long after 3 red days in a row. will update early next week


$TWTR Long idea.looking to take $TWTR if it decides to head north out of the pattern. the weekly shows old resistance levels being used as new support over the last few days. the trend is your friend!

$BTC Long 1D TF Sup/Res Fib. ExtUpdate from my last published idea.
My target of ~$26,000 hit and I exited half of my long there. As this is new ATH territory for $BTC there is no chart history to find the next resistance. That being said, I'm utilizing the Fibonacci extension from my 1W chart on a previously published idea and psychological resistance levels for my next targets.
$30,000 is the obvious resistance.
If there is a back test of $26,000 and a failed attempt at support I will exit the rest of my position. Otherwise, I will hold until $30,000 is hit and reevaluate.

$BTC Long 1D TF Sup/Res Fib. ExtOpened a long trade on $BTC at a price of ~$17,950 after some consolidation and a technical bounce at ~$17,800, the 0.786 Fibonacci retracement from my previous charts (titled Bitcoin Long 1W TF Sup/Res Fib. Ext.).
After opening the trade, I had an exit strategy if $BTC rejected resistance at ~$20,000 again. This time, we broke through the res.
Zooming out to a 1W timeframe, we find the next resistance to be the golden ratio Fibonacci extension (1.618) at ~$26,000.

Retest of Apple highs soon?With the recent breakout I believe we may see a breakout that could push us towards the previous highs, my timeline would be January - February.

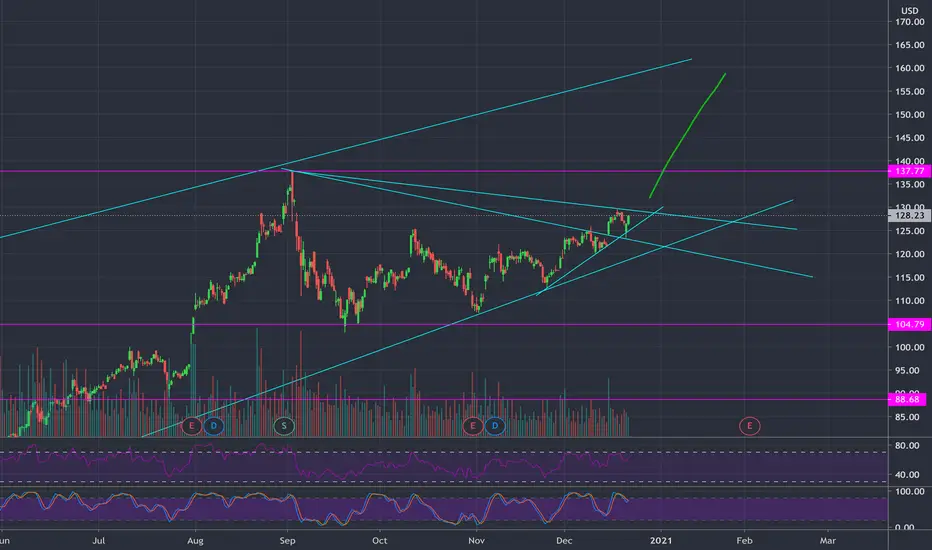
Apple begins its push upwards towards $160 goal priceApple broke out of key resistance and has retested the support line and has begun it's trajectory towards 160.