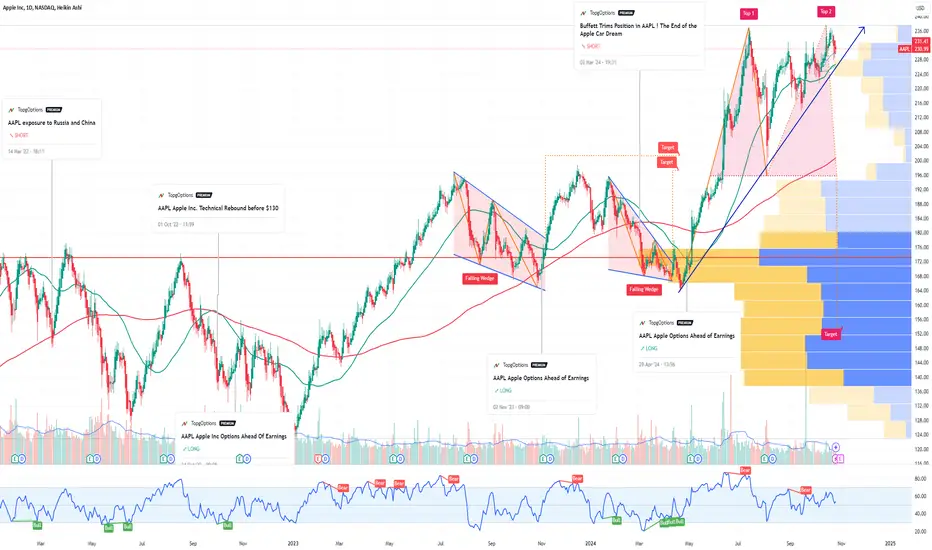
AAPL SHORT TRADE OUTLOOK ON EARNINGS REPORT DAY OCT.31, 2024NASDAQ:AAPL SHORT TRADE IDEA:
WEEKLY FUNDAMENTAL ANALYSIS:
>P/E Ratio (Quarterly Lookback): Apple's P/E is currently at 35.6, signaling overvaluation (typically anything above 25 is considered overvalued).
>Correlation: Both Apple's P/E ratio and value compared to Treasury bonds are flashing overvalued signals.
DAILY OUTLOOK:
>Short-term and long-term value correlations vs T-bonds and P/E ratios suggest the stock may remain overbought until the upcoming earnings report, which could act as a catalyst.
>Election Year Seasonality is strongly bearish as well.
TECHNICAL INSIGHT:
>AAPL may pull back to fill a previous price gap before slowing down.
Stay sharp, traders! 🎯 #AAPL #ShortTrade #MarketAnalysis #Investing
Disclaimer: This post is for informational and educational purposes only and should not be considered financial advice. It reflects general market fundamentals and personal speculation. Always do your own research and consult with a professional before making any financial decisions. Trade at your own risk.
Apple

Exploring Apple's Latest AI: What Does the Future Hold? Apple's recent announcement of Apple Intelligence, coupled with the launch of a new iMac, has sent ripples through the tech industry and the financial markets. While the long-term impact of these innovations on Apple's stock price remains to be seen, initial market reactions suggest a positive outlook.
Apple Intelligence: A Game-Changer?
Apple's foray into artificial intelligence (AI) with Apple Intelligence marks a significant milestone for the company. This new AI framework is designed to enhance various Apple products and services, from the iPhone to the Mac. By integrating AI capabilities into its ecosystem, Apple aims to provide a more personalized, efficient, and intuitive user experience.
Key features of Apple Intelligence include:
• Enhanced Siri: A more intelligent and capable virtual assistant.
• Advanced Image Processing: Improved photo and video editing capabilities.
• Natural Language Processing: More sophisticated text analysis and generation.
While the full potential of Apple Intelligence is yet to be realized, the initial response from analysts and investors has been cautiously optimistic. Many believe that AI could be a significant growth driver for Apple, particularly in areas such as augmented reality, virtual reality, and autonomous vehicles.
The New iMac: A Refreshing Update
The new iMac, powered by the M4 chip, represents a significant upgrade over its predecessor. With improved performance, stunning visuals, and a sleek design, the new iMac is poised to attract both consumers and professionals. However, the impact of this product launch on Apple's stock price is likely to be more modest compared to the introduction of Apple Intelligence.
Market Reaction and Future Outlook
In the immediate aftermath of the announcement, Apple's stock price experienced a modest increase. While this initial positive reaction is encouraging, it is important to note that the long-term impact of these innovations will depend on various factors, including:
• Consumer Adoption: The success of Apple Intelligence and the new iMac will ultimately depend on consumer adoption.
• Competitive Landscape: The intense competition from other tech giants, such as Google, Microsoft, and Samsung, could impact Apple's market share and profitability.
• Global Economic Conditions: Economic factors, such as interest rates, inflation, and geopolitical tensions, can influence investor sentiment and stock prices.
While Apple has a strong track record of innovation and financial performance, it is crucial to approach the company's future with a balanced perspective. While Apple Intelligence and the new iMac represent exciting developments, it is too early to predict their full impact on the company's bottom line.
In conclusion, Apple's recent announcements have generated significant buzz and positive sentiment among investors. However, the long-term trajectory of Apple's stock price will depend on a variety of factors, including the successful execution of its AI strategy and the overall health of the global economy. As Apple continues to push the boundaries of technology, investors will be closely watching to see how these innovations translate into sustainable growth and shareholder value.

Apple is at231 could bounce back from 230 and 228 to 233 and 235Apple is at 231 and it could fall and bounce back from 230 and 228 to 233 and 235 levels,
Note: This is not a buy / sell call, Trade at your own risk.

AAPL POTENTIAL UPSIDE RUNNASDAQ:AAPL - Sellers halted at a Daily Buy Liquidity Level (Major Level) with the 4h showing Potential change in 4h trend narrative due to the Broken structure to the upside. If price can break above and hold 232.20 I will look for buy opportunities througout the week as long as the 4h can continue to show healthy bullish price action fueled by market anticipation leading up to Earnings on Thursday.

AAPL Apple Options Ahead of Earnings If you haven`t bought AAPL before this major breakout:
Now analyzing the options chain and the chart patterns of AAPL Apple prior to the earnings report this week,
I would consider purchasing the 232.5usd strike price Calls with
an expiration date of 2024-11-1,
for a premium of approximately $4.05.
If these options prove to be profitable prior to the earnings release, I would sell at least half of them.
APPLE Under Pressure! SELL!
My dear friends,
APPLE looks like it will make a good move, and here are the details:
The market is trading on 234.99 pivot level.
Bias - Bearish
Technical Indicators: Supper Trend generates a clear short signal while Pivot Point HL is currently determining the overall Bearish trend of the market.
Goal - 229.05
Recommended Stop Loss - 238.19
About Used Indicators:
Pivot points are a great way to identify areas of support and resistance, but they work best when combined with other kinds of technical analysis
———————————
WISH YOU ALL LUCK

APPLE Long From Rising Support! Buy!
Hello,Traders!
APPLE is trading in an
Uptrend along the rising
Support line and the stocks
Is now retesting it so we are
Locally bullish biased and
We will be expecting a
Further move up
Buy!
Like, comment and subscribe to help us grow!
Check out other forecasts below too!

S&P 500 Is Higher Than Ever. Can Earnings Support the Growth?Tech giants are in the waiting room, prepping their financial updates while investors drool over prospects of AI-fueled revenues. The season kicked off with Wall Street banks posting some convincing numbers for the September quarter, painting an optimistic outlook for Corporate America’s biggest and brightest players.
The S&P 500 is hot, hot, hot. Investors just can’t get enough of the 500-strong index and last Friday they pushed it to its 47th record closing high of the year. And they did it with finesse — on the eve of the 37th anniversary of the “Black Monday” market crash. (On Oct. 19, 1987, the S&P 500 wiped out a record 20% and the Nasdaq shed 12%.) Broadly, US indexes are having a bumper year, with most of them up double digits or more.
With no time to waste, markets are shifting their attention to the looming slate of big tech earnings reports . Here’s what’s going to be turning heads this week:
📌 On Wednesday , EV maker Tesla TSLA will be the main character in the world of corporate updates. Wall Street is eyeballing earnings north of $25.4 billion, up from $23.4 billion in the year-ago quarter. Besides Elon Musk’s EV giant, Wednesday will bring earnings from Coca Cola KO , Boeing BA , IBM IBM and telecoms mainstays T-Mobile TMUS and AT&T T .
📌 On Thursday , the earnings roll keeps rolling in with e-commerce and cloud computing juggernaut Amazon AMZN reporting after the closing bell.
But all that earnings action looks fairly light — wait till you see what’s cooking for next week. *drumroll please* … 🥁
The Magnificent Seven club of tech highflyers will be represented by four of its members. (Tesla and Amazon report the prior week and Nvidia NVDA reports in about a month from now.)
📌 On October 29 , Google parent Alphabet GOOGL is scheduled to report earnings figures. Shares of the tech heavyweight are up about 18% on the year but got stuck recently after the Department of Justice filed a range of possible changes aimed at reducing Google’s search dominance.
📌 On October 30 , Facebook parent Meta META and Microsoft MSFT will reveal how they fared in the three months through September. Mark Zuckerberg’s Meta flaunts a massive 65% year-to-date increase (and some new glow-up for its loose-shirt-wearing tech bro founder.) Microsoft, on the other hand, is up by a more modest clip of 12%.
📌 On October 31 , Apple AAPL will release its highly-anticipated earnings data that will include a glimpse into how well the new iPhone 16 is selling . Shares of Apple are up roughly 27% for the year.
These seven mega-cap corporate giants are expected to show an 18% rise in third-quarter profits, according to Bloomberg Intelligence. If materialized, that would be substantially slower than the 36% seen in the second quarter. The sheer size of the pack accounts for about 30% of the total market cap of the S&P 500 (which not long ago celebrated its $50 trillion milestone .) Nvidia and Apple alone are worth more than $7 trillion combined.
What’s on your radar for this earnings season? Are you waiting for a tech giant to dip or maybe you're after a bank stock or a car conglomerate? Share your comments below!

APPLE: Bearish Continuation & Short Trade
APPLE
- Classic bearish setup
- Our team expects bearish continuation
SUGGESTED TRADE:
Swing Trade
Short APPLE
Entry Point - 234.99
Stop Loss - 238.93
Take Profit - 227.89
Our Risk - 1%
Start protection of your profits from lower levels
❤️ Please, support our work with like & comment! ❤️

The Sandbox | SAND The price of The Sandbox is $0.60 today with a 24hour trading volume of 244 million dollars. This represents a 6% price increase in the last 24 hours and a 11% price increase in the past 7 days.
but what is Sand? well Sandbox is a decentralized community owned virtual world. Creators can host custom games and events on the virtual world. Analysts like to compare Sandbox with Roblox due to their similarity in concepts. However the key difference with Sandbox is that players have true ownership of the virtual world assets in the form of NFTs. By doing so, LAND owners can host contests and events, stake SAND to earn and customize assets, monetize assets and experiences, vote in the metaverse governance, play games.
Saudi Arabia partners with The Sandbox for future metaverse plans.this year is an important year for crypto AR/VR projects and today many of them will pump thanks to Apple WWDC
next targets for sand are 0.63 , 0.65 and 0.69 $

Apple at a Crossroad – Surfing to 238 or Wiping Out to 226?Alright, trading family, AAPL is catching some chop, and it’s make-or-break time. If we dip, we could slide to 229.25 or even 226.90 before the bulls try paddling back. But if buyers show up, we might ride the wave to 234.79—and if we break through there, 238.56 is the next stop.
Key Levels:
Support: 229.25 – If this breaks, 226.90 could be the next target.
Bounce Zone: 2 34.79 – Bulls need to reclaim this for more upside.
Breakout Level: 238.56 – Pushing above this opens the door for higher moves.
It’s one of those moments—either we ride the wave higher, or we get dragged under and wait for the next set. Keep your eyes peeled; this one’s gonna get interesting.
What do you think—are we riding this one up or taking a dip first? Drop your thoughts, follow, and share if this chart got you prepped for the next move.
Mindbloome trader

Apple: Upside Potential! Currently, we are dealing with the final part of the turquoise wave B and expect a high just below the resistance level at $254.30. Afterward, we anticipate a pullback that will bring the price down with the turquoise wave C into our magenta Target Zone (coordinates: $192.02 – $172.34), where the larger wave (2) is expected to complete. This Target Zone offers another opportunity for long positions, as the bullish trend should continue from there. We assign a 34% probability that the magenta wave alt.(2) has already completed, leading to a direct break above the $254.30 resistance without entering our Target Zone.

APPLE Soars! Long Trade Achieves Key Targets – Bulls in ControlApple has displayed a strong uptrend since the long entry at 184.92 on 7th May, 2024, reaching multiple profit targets as the bullish momentum continued.
Key Levels
Entry: 184.92 – The long position was initiated as the price broke above this level, indicating bullish strength.
Stop-Loss (SL): 174.50 – Positioned below recent support to manage risk and protect against a downside move.
Take Profit 1 (TP1): 197.80 – The first target was achieved, confirming the continuation of the uptrend.
Take Profit 2 (TP2): 218.65 – Bullish momentum carried the price to this level.
Take Profit 3 (TP3): 239.50 – A further extension of the rally will bring the price to this target which looks very likely.
Take Profit 4 (TP4): 252.38 – The final profit target, indicating a significant uptrend since the entry.
Trend Analysis
Apple's price is well above the Risological Dotted trendline, affirming the strength of the uptrend. The sustained upward movement suggests strong market sentiment, with the potential for further gains beyond the final target.
The long trade on Apple has performed exceptionally well, with multiple targets reached. The final target at 252.38 reflects a robust rally, supported by the Risological Dotted trendline and consistent buying interest.

AAPL: Momentum Brewing – What's Next?▋Observation & Meanings:
▪The downside breakout from the ranging zone failed, and the price even took out the high of the range, reversing into an uptrend, followed by minor congestion.
▪After reversing the trend, the bulls showed their further intent by breaking above the congestion high.
▋What to expect next?
▪The price has retested the high of the congestion zone, and this level should hold if the bulls intend to maintain momentum.
▋The big 3 zones:
▪The continuation zone:
▫ The next major resistance will be level X.
▫ Although the resistance is significant, this is the third attempt, and with plenty of fuel (position) accumulated below during this period, a breakout is likely.
▫ Additionally, an ascending triangle pattern has formed on the 4-hour chart, reinforcing the potential for an upward breakout.
▫ If the key resistance at X is broken, a short squeeze could occur as sellers are forced to cover their positions, driving the price to the next level.
▪The unclear zone:
▫ If the price falls back into the congestion zone, wait for clearer signals before making a move.
▪The defending zone:
▫ If the price breaks below the defending level, the low of the congestion, the trend will likely shift back to the downside.
▋Don’t predict the price, trade the price.
▋Note: These zones adjust in real time based on price movements and evolving market conditions.
▋Not Financial Advice
The information contained in this article is not intended as, and should not be understood as financial advice. You should take independent financial advice from a professional who is aware of the facts and circumstances of your individual situation.

AAPLTrigger for Calls is over 230.
Levels above are 233, 237.
Trade Idea: 232.5C Oct 25
**Earnings are on Thursday Oct 31.

AAPLContinuation of growth towards the 262.52 area and higher within wave C of 3 of the diagonal.
The growth will be canceled if the price consolidates below the accumulation zone of 210-214

RIVIAN 25 COMING.... 🎉 Why Rivian's Stock Price Could Hit $25 🎉
Innovation and Product Appeal: Rivian has been making waves with its innovative electric vehicles like the R1T and R1S. The anticipation around new models and features, like the Gear Guard live cam and Tri-zone climate control, keeps the brand's allure strong among tech-savvy consumers and environmental enthusiasts. The unique selling points of these vehicles could drive demand, positively impacting stock value.
Strategic Partnerships and Market Positioning: The relationship with Amazon for electric delivery vehicles positions Rivian as a key player in not just the consumer EV market but also in commercial applications. This could lead to steady order flows and visibility, crucial for investor confidence.
Production Scale and Cost Reduction: Rivian's focus on scaling production, especially with the introduction of its in-house Enduro drive unit, aims to reduce costs significantly. As production ramps up, achieving economies of scale could lead to better margins, making the stock more attractive.
Investor Sentiment and Analyst Predictions: Despite variations, there's a notable optimism among analysts with a mix of hold and buy ratings, suggesting that many see potential for growth. The consensus price targets around $17.68 with highs up to $28 indicate that reaching $25 isn't far-fetched, especially if Rivian meets its production and innovation goals.
Market Expansion and Brand Loyalty: Initiatives like The Good Project, where Rivian vehicles are used for community service, not only enhance brand image but also foster loyalty. Exclusive offers for existing customers to upgrade to newer models could retain and grow the customer base, indirectly supporting stock price through sustained demand.
Technological Advancements: Rivian's development of proprietary technology, including its own chips and operating system, could insulate it from supply chain issues and offer competitive advantages. Innovation in software updates like dynamic headlamp leveling shows a commitment to continuous improvement, which could excite investors.
Market Sentiment Towards EVs: The broader trend towards electric vehicles continues to gain momentum. As more regions implement policies favoring EVs, companies like Rivian, which are pure-play EV manufacturers, stand to benefit from this shift, potentially driving up stock prices.
Financial Health and Investment: While Rivian has significant cash reserves, managing these effectively for growth without excessive dilution could reassure investors. The strategic use of funds for R&D and scaling could pave the way for profitability, a significant milestone for stock valuation.

Apple - How I'm Looking to Trade Apple This Week Monthly & Weekly MAC strategy suggests dips into the Weekly &/or Monthly MAC low are good setup areas for going long. Essentially, I'm looking to buy the dip if we get a price move into the levels noted in the video. I would not just be buying the MAC lows. I would be looking for entry triggers on my entry timeframes in those areas.
I also point out that there are some Monthly/Quarterly bearish divergences forming, but nowhere near confirmation, so bulls need not worry.
In short, I'm looking to buy the dip on Apple.
Have a great weekend.

AAPL: 25% Correction / Liquidity Gap at $175🔸Hello traders, today let's review 12H price chart for AAPL/Apple.
This is advanced technical trade setup based on historic price fractal.
🔸AAPL currently entering distribution at the top stage with
distribution defined by the ABCD fractal. Same price fractal
was observed in the market in Dec21/Jan22 before a subsequent 25%
market correction in AAPL.
🔸ABCD ongoing distribution defined by range highs at 230 USD
and range lows at 205 USD. Once we complete the ABCD structure
expect a sharp mark-down in price / correction from point D into
point E near 175 USD liquidity gap / open gap will drag price down.
🔸Recommended strategy AAPL traders: Advanced traders may
short AAPL / buy May 2025 LEAP put options. No valid strategy
currently for the bulls, it's best to wait until liquidity gap gets filled
later in Q1/Q2 2025 before buying low at/near 175 usd.
🎁Please hit the like button and
🎁Leave a comment to support our team!
RISK DISCLAIMER:
Trading Futures , Forex, CFDs and Stocks involves a risk of loss.
Please consider carefully if such trading is appropriate for you.
Past performance is not indicative of future results.
Always limit your leverage and use tight stop loss.

MAGS (Roundhill Magnificent Seven ETF)... Time to BUY? YES!!The Roundhill Magnificent Seven ETF offers equal weight exposure to the “Magnificent Seven” stocks – Alphabet, Amazon, Apple, Meta, Microsoft, Nvidia, and Tesla. MAGS is the first-ever ETF to track the Magnificent Seven.
Enjoy!
May profits be upon you.
Leave any questions or comments in the comment section.
I appreciate any feedback from my viewers!
Like and/or subscribe if you want more accurate analysis.
Thank you so much!
Disclaimer:
I do not provide personal investment advice and I am not a qualified licensed investment advisor.
All information found here, including any ideas, opinions, views, predictions, forecasts, commentaries, suggestions, expressed or implied herein, are for informational, entertainment or educational purposes only and should not be construed as personal investment advice. While the information provided is believed to be accurate, it may include errors or inaccuracies.
I will not and cannot be held liable for any actions you take as a result of anything you read here.
Conduct your own due diligence, or consult a licensed financial advisor or broker before making any and all investment decisions. Any investments, trades, speculations, or decisions made on the basis of any information found on this channel, expressed or implied herein, are committed at your own risk, financial or otherwise.

Apple Breakout!!! Alert1. Apple has always had poor sales in comparison to other devices...But who cares? Everybody to your left and right owns an iPhone.
2. Apple's AI is not 100% priced into the stock right now. Therefore, the drop is currently a discount.
3. Android OS already is lagging behind Apple.

APPLE Massive Short! SELL!
My dear subscribers,
This is my opinion on the APPLE next move:
The instrument tests an important psychological level 228.20
Bias - Bearish
Technical Indicators: Supper Trend gives a precise Bearish signal, while Pivot Point HL predicts price changes and potential reversals in the market.
Target - 224.49
About Used Indicators:
On the subsequent day, trading above the pivot point is thought to indicate ongoing bullish sentiment, while trading below the pivot point indicates bearish sentiment.
———————————
WISH YOU ALL LUCK

Apple: This May Be Your Last Chance Before Exploding to UpsideAPPLE is in a ascending triangle now which means the price will increase and also It is expected that the price would at least grow as good as the measured price movement(AB=CD)
Note: we should wait for the breaking of the triangle and than make a move!
✨We spend hours finding potential opportunities and writing useful ideas, we would be happy if you support us.
Best regards CobraVanguard.💚
_ _ _ _ __ _ _ _ _ _ _ _ _ _ _ _ _ _ _ _ _ _ _ _ _ _ _ _ _ _ _ _
✅Thank you, and for more ideas, hit ❤️Like❤️ and 🌟Follow🌟!
⚠️Things can change...
The markets are always changing and even with all these signals, the market changes tend to be strong and fast!!
