APPLE: Short Trade Explained
APPLE
- Classic bearish setup
- Our team expects bearish continuation
SUGGESTED TRADE:
Swing Trade
Short APPLE
Entry Point - 189.93
Stop Loss - 195.31
Take Profit - 180.47
Our Risk - 1%
Start protection of your profits from lower levels
❤️ Please, support our work with like & comment! ❤️
Apple

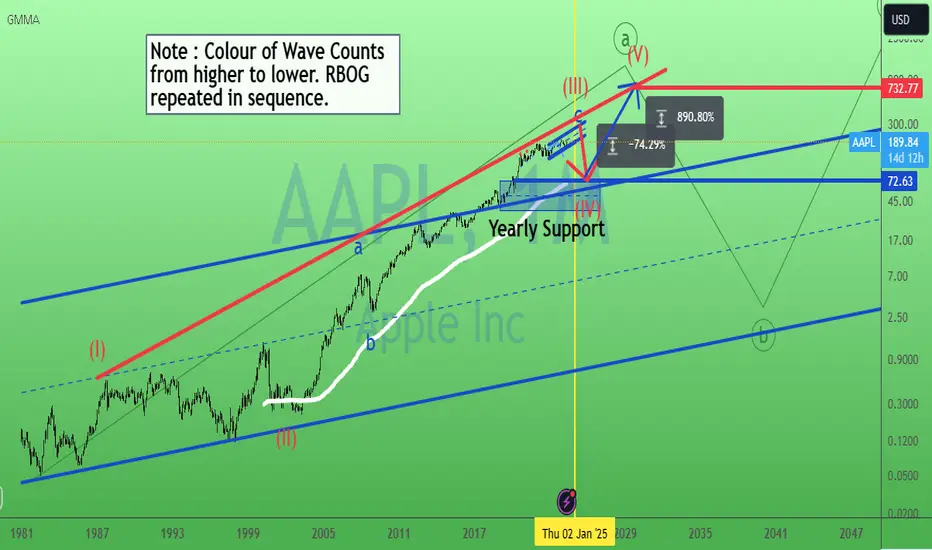
Apple bigger pic. 17/May/24AAPL bigger picture on monthly chart, possible a more than 70% (-74.29&) drop on year 2025 toward 72.63 +/- which is multi confluence zone of 1) Monthly 233 EMA ( thick white MA line) 2)Upper Support of parallel channel ( blue line) 3) Yearly Support Zone.
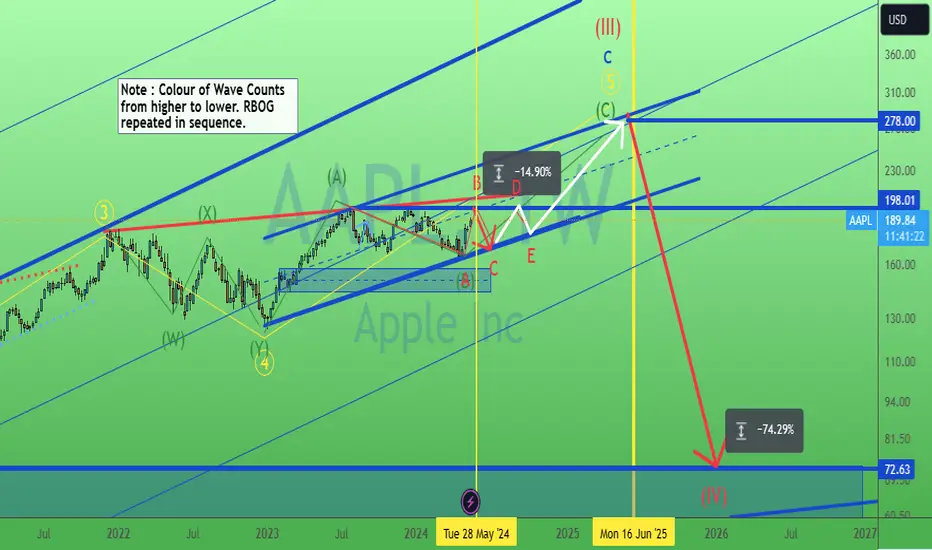
Apple still not out of wood (triangle). 17/May/24AAPL still forming a triangle pattern. Probably a -14.90% drop by end of May ( so sell in May still working") or early June.
$AAPL Bearish To Bullish Reversal NASDAQ:AAPL Bearish To Bullish Reversal, parallel down trend break out to the upside.

The idea of a bull marketEsteemed analysts and traders,
I hope this correspondence finds you in good health and high spirits, prepared to tackle the upcoming week with renewed energy. I extend my best wishes for your continued success in all your business endeavors. It is worth noting that success in trading is largely dependent on the consistent definition and adherence to one's own rules.
As a supporter of the Elliott Wave Principle, I consider this methodology an invaluable tool for market analysis. After three years of personal experience, I have developed my approach by combining this principle with meticulous consideration of different market scenarios. I strive to avoid market surprises by maintaining a range of market prospects, which enables me to recognize the market structure forming with 100% accuracy.
I am pleased to share my analysis with you, with the caveat that I do not provide buy or sell signals. My perspective on idea analysis is entirely impartial, and if my analysis meets your standards, it may serve as a guide to making an informed decision.
For your reference and comparison, I have attached my previous analysis of the same market. All the details of my analysis are clearly labeled for ease of comprehension. Nonetheless, familiarity with the Elliott Wave Principle theory would facilitate an understanding of the analytical idea.
My study of the Elliott Wave Principle took nearly three years, during which my understanding and experience with this invaluable tool have grown. My progress thus far is a testament to the legacy of Ralph Nelson Eliot, whose genius has provided the foundation for my achievements. May he rest in peace.
I express my gratitude for your continued support and kindness, and welcome your comments and critiques.
May my analysis be a valuable asset to your business journey, and I remain sincerely yours,
Mr. Nobody

Apple Nears Deal with OpenAI to Bring ChatGPT to iPhoneApple is reportedly close to finalizing a deal with OpenAI to integrate the popular large language model ChatGPT into its iPhone devices, marking a significant step in the company's efforts to bolster artificial intelligence (AI) features. This move comes as Apple strives to stay competitive in the rapidly evolving AI landscape and enhance user experience through advanced functionalities.
According to Bloomberg's sources, Apple and OpenAI are finalizing the terms of an agreement that would see ChatGPT capabilities incorporated into iOS 18, the upcoming iPhone operating system. This integration of ChatGPT has the potential to transform how users interact with their iPhones, potentially enabling more intuitive and interactive experiences across various applications.
ChatGPT, developed by OpenAI, has garnered considerable attention for its ability to generate realistic and coherent chat conversations. By leveraging ChatGPT's capabilities, Apple could introduce features that allow users to have more natural conversations with their virtual assistants, like Siri. Imagine being able to ask Siri complex questions and receive comprehensive answers instead of basic responses. Additionally, ChatGPT could be integrated into messaging apps like iMessage, facilitating an AI-powered chat experience that feels more human-like and engaging.
Apple's interest in incorporating ChatGPT aligns with its broader strategy of prioritizing AI development. The company has been steadily investing in AI research and development, recognizing its potential to revolutionize how users interact with technology. This focus on AI is evident in Apple's existing features like Face ID and Animoji, which utilize machine learning for facial recognition and creation of animated emojis.
The potential deal with OpenAI comes after Apple reportedly held discussions with Google regarding its rival AI model, Gemini. While those talks haven't materialized into a concrete agreement, they highlight Apple's commitment to exploring and implementing cutting-edge AI solutions.
Integrating a powerful language model like ChatGPT into iPhones could offer numerous advantages. Here are some potential benefits:
• Enhanced User Experience: ChatGPT's conversational capabilities could significantly improve user experience by enabling more natural and intuitive interactions with devices. Imagine voice assistants that can engage in fluid conversations, understanding context and responding accordingly.
• Increased Productivity: AI-powered features could streamline tasks and boost productivity. For instance, ChatGPT could be integrated with email or calendar applications, allowing users to compose emails or schedule meetings through voice commands or chat conversations.
• Accessibility Improvements: AI can potentially improve accessibility features for users with disabilities. Features powered by large language models like ChatGPT could offer more advanced ways for users to interact with their devices, catering to a wider range of needs.
However, some potential challenges also need to be considered:
• Privacy Concerns: The use of large language models raises privacy concerns as these models require vast amounts of data to function. Apple will need to ensure that user data is collected and used responsibly in accordance with user privacy.
• Security Risks: Integrating AI features introduces new security considerations. Apple will need to address potential vulnerabilities to ensure the integrity and security of user data and device functionalities.
• Ethical Biases: Large language models can perpetuate existing biases if trained on biased data. Apple will need to implement measures to mitigate potential biases within the AI model to ensure fair and ethical treatment of users.
Apple's move to potentially incorporate ChatGPT signifies a pivotal moment in the company's AI strategy. If successfully implemented, this integration has the potential to redefine user experience on iPhones and establish Apple as a frontrunner in AI innovation. However, Apple must navigate the challenges associated with privacy, security, and ethical considerations to ensure responsible and successful integration of powerful AI features.
It's important to note that the deal with OpenAI is not finalized yet. We'll likely learn more details about the agreement and how ChatGPT might be integrated into iPhones during Apple's upcoming Worldwide Developers Conference in June. This will be a significant event to watch, potentially unveiling a new chapter in human-computer interaction facilitated by advanced AI.

Dividends Are Coming. S&P500 Annual Dividend Index FuturesA few months ago I started this research, research of Equity Index Dividend futures, provided by CME Group.
Well, sounds good. Let's continue..
Were you ready or not, but in February, 2024 Meta platforms (META) announced its first-ever in history cash dividend of $0.50 per share to be paid out on quarterly basis.
“We intend to pay a cash dividend on a quarterly basis going forward,” the company said in a release .
Meta stock surged for 20% after that amid other huge reasons.
Alphabet (GOOG) also issued first-ever dividend of 20 cents per share in April, 2024.
The news, announced alongside first-quarter earnings, helped to send the Google parent’s shares up 15%.
Dividend Market as well as Dividend futures trading shines bright.
Understanding Dividends and Dividend Market Futures
👉 A dividend is the distribution of corporate earnings to eligible shareholders.
👉 Dividend payments and amounts are determined by a company's board of directors. Dividends must be approved by the shareholders by voting rights. Although cash dividends are common, dividends can also be issued as shares of stock.
👉 The dividend yield is the dividend per share, and expressed as a percentage of a company's share price.
👉 Many companies - constituents of S&P500 Index still DO NOT PAY dividends and instead retain earnings to be invested back into the company.
👉 The S&P500 Dividend Points Index (Annual) tracks the total dividends from the constituents of the S&P 500 Index. The index provides investors the opportunity to hedge or take a view on dividends for U.S. stocks, independent of price movement, as S&P500 Dividend Index Futures is a market expectation of how many points Dividends Index will collect by the end of year.
👉 Using the S&P500 Dividend Index as the underlying in financial products, investors can hedge or gain exposure to the dividend performance of the S&P500 Index.
Understanding S&P500 Annual Dividend Index Futures
👉 The S&P500 Annual Dividend Index futures (main technical graph is for 2025 S&P500 Annual Dividend Index Futures) calculates the accumulation of all ordinary gross dividends paid on the S&P500 index constituent stocks that have gone ex-dividend over a 12-month period. The amounts are expressed as dividend index points.
👉 The underlying index for S&P500 Annual Dividend Index futures is the S&P500 Dividend Index. The methodology for the index can be found here at S&P Global website.
👉 Dividend index points specifically refer to the level of index points that are directly attributable to the dividends of index constituents. They typically only capture regular dividends and calculate this on the ex-date of the respective constituents within each index.
👉 In general, “special” or “extraordinary” dividends are not included as dividend points in the respective annual dividend indices.
👉 Futures contract Unit is $ 250 x S&P 500 Annual Dividends Index.
Technical considerations
🤝 Main technical graph (S&P500 Annual Dividend Index Futures 2025) indicates on strong bullish bias. Who knows, maybe at one sunny day even Tesla King, Elon Musk will unleash his E-pocket 😂
🤝 Happy Dividend Market Trading to Everyone! Enjoy!

COSTCO 820 Costco’s stock price has seen a significant increase recently, and there are several reasons behind this rise to $820:
Strong Sales Performance: Costco posted net sales of $19.8 billion for April, up 7.1% from $18.48 billion in the year-earlier period1. Net sales for the fiscal 35 weeks were $166.44 billion, up 7% from $155.62 billion a year earlier.
Shift in Consumer Behavior: Due to rising restaurant prices, many consumers are opting to buy groceries and cook at home instead. This shift in consumer behavior is benefiting grocery businesses like Costco.
Membership Model: Costco’s membership model is also a significant contributor to its success.
The warehouse club’s members pay $60 a year for a basic Gold membership or $120 for an Executive membership, which comes with 2% cash back up to $1,000.
Analyst Upgrades: After reviewing Costco’s strong April sales data, analysts have raised their price targets for the company. For instance, TheStreet Pro’s Chris Versace raised his price target on Costco to $830 from $800. Similarly, Loop Capital analysts raised the firm’s price target on Costco to $840 from $820.
Earnings Expectations: Costco is expected to report earnings on May 30, 2024, for the fiscal quarter ending May 2024. The consensus EPS forecast for the quarter is $3.69, which is higher than the reported EPS for the same quarter last year ($3.43). This positive earnings expectation could also be driving the stock price up.

BABA GO UP AFTER EARNINGS ? $89.94Unpacking Alibaba’s Stock Rise to $89.94
Alibaba, the multinational conglomerate specializing in e-commerce, retail, internet, and technology, has seen its stock price climb to $89.94. This significant increase is a result of a multitude of factors that have positively influenced the company’s valuation.
Earnings Performance: Alibaba has been reporting solid earnings, which have exceeded market expectations. This strong financial performance has been a key driver in boosting investor confidence and, consequently, the stock price.
Market Position: Alibaba’s dominant position in the Chinese and global e-commerce market has played a crucial role in its stock performance. The company’s vast user base and extensive product offerings have made it a formidable player in the industry.
Diversification: Alibaba’s diversification into various sectors such as cloud computing, digital media, and entertainment has opened up new revenue streams, contributing to its financial growth and stock price increase.
Innovation: The company’s continuous investment in innovation and technology has kept it at the forefront of the digital economy. This commitment to innovation has not only enhanced its product offerings but also improved operational efficiency.
Regulatory Environment: Despite the regulatory challenges, Alibaba has managed to navigate the landscape effectively. The company’s ability to adapt to regulatory changes has been viewed positively by investors.
In conclusion, Alibaba’s rise to a stock price of $89.94 can be attributed to its strong earnings performance, dominant market position, diversification strategy, commitment to innovation, and effective navigation of the regulatory environment. These factors collectively contribute to the company’s robust financial health and promising growth prospects. As Alibaba continues to build on these strengths, it is well-positioned for future success.

Salesforce’s Stock Surge to $298.14 AFTER EARNINGS ?NYSE:CRM
Analyzing Salesforce’s Stock Surge to $298.14
Salesforce, a global leader in cloud-based software, has recently seen its stock price soar to an impressive $298.14. This significant increase is not a random occurrence but the result of a combination of factors that have played out in favor of the company.
Strong Earnings Reports: Salesforce has consistently reported strong earnings, demonstrating robust financial performance. These positive reports have instilled confidence in investors, leading to increased demand for the stock.
Innovative Product Portfolio: Salesforce’s diverse and innovative product portfolio has been a key driver of its success. The company’s offerings, ranging from sales and service automation to marketing and analytics, have kept it at the forefront of the industry.
Market Leadership: Salesforce’s position as a market leader in the Customer Relationship Management (CRM) space has contributed to its strong stock performance.
The company’s dominance in this sector has made it a preferred choice for investors looking for stable returns.
Strategic Acquisitions: Salesforce’s strategic acquisitions have also played a role in boosting its stock price. These acquisitions have not only expanded the company’s product offerings but also opened up new markets, contributing to revenue growth.

NAS100 A Great Selling Opportunity 🤨👌Trade Proposal:
There is a probability of first tp to the proposed ( 10,800.42 ) Direction line. So, Traders can set orders based on Price Action and expect to reach short-term goals.
Technical analysis:
MAS100 is in Downtrend and It is Expected to Continue Downtrend.
By the end of this quarter and at 10,800.42 in one year

AAPL Long Term: A Bite Out of Innovation Still Worth Chewing OnThe tech giants of yesterday aren't always the titans of tomorrow. Ask any BlackBerry or Myspace user. But Apple (AAPL) seems different. It's a brand synonymous with sleek design, intuitive interfaces, and a rabidly loyal fanbase. Yet, whispers abound that Apple's best days are behind it. Is this a reason to abandon AAPL? Not necessarily. Here's why a long position on Apple might still be a juicy investment.
Peak Influence, Peak Products Not Synonymous
There's a valid argument to be made that Apple's cultural influence has peaked. The days of revolutionary product launches that sent shockwaves through the tech world might be over. The iPhone, for instance, forever changed the mobile landscape, but incremental updates might not hold the same groundbreaking appeal.
However, strong influence doesn't guarantee a stagnant product line. Apple's design language and user experience (UX) philosophy remain best-in-class. While competitors scramble to mimic features like multi-touch interfaces, Apple continues to refine and innovate within its established ecosystem. The upcoming AR/VR headset, rumored for release in the coming years, is a prime example. It has the potential to be a game-changer, much like the iPhone was in its time.
The Loyal Legion: A Moat Wider Than Ever
One of Apple's greatest strengths is its fervent user base. Apple users are notoriously loyal, often deeply entrenched within the company's ecosystem of devices and services. Switching from iPhone to Android, for instance, can be a significant hurdle due to factors like iMessage integration and a user interface many have grown accustomed to. This loyalty translates to recurring revenue streams through things like App Store purchases and iCloud subscriptions.
Furthermore, Apple isn't resting on its laurels when it comes to user loyalty. Services like Apple Music and Apple TV+ are constantly improving, offering compelling reasons for users to stay within the Apple fold.
The Maturing Tech Landscape: A Friend, Not a Foe
It's true, America's tech dominance isn't what it once was. But that doesn't spell doom for Apple. The rise of other tech powerhouses like China shouldn't be seen as an existential threat, but rather as a sign of a maturing tech landscape. This fosters healthy competition, pushing companies to constantly innovate and improve their offerings.
Apple, with its immense resources and proven track record, is well-positioned to thrive in this environment. The company has a global presence, a strong brand image, and a loyal user base – all of which are assets that can't be easily replicated.
A Bite-Sized Conclusion
Apple might not be the revolutionary force it once was, but that doesn't mean its best days are over. The company continues to produce high-quality products with a focus on design and user experience. Its loyal user base and focus on services provide strong foundations for continued growth. While the broader tech landscape is evolving, Apple's position within it remains secure. So, for investors seeking a long-term play in the tech sector, AAPL might still be a bite worth taking.
Disclaimer: This article is for informational purposes only and should not be considered financial advice. Please consult with a financial professional before making any investment decisions.

AAPL POTENTIAL REVISIT ON MAJOR RESISTANCE ZONEAAPL has verified a bullish breakout from the formed channel. The false breakout on the identified support suggests a robust rebound from recent lows. Anticipating a rally continuation, aiming to reclaim the resistance before a potential sell-off. However, as the resistance stands as a formidable sell zone, a downward price shift is expected upon reaching the highlighted region.

iPads Expected at Apple Event, But Hold On For the AI ChipsApple enthusiasts can finally breathe a sigh of relief. The wait for new iPads is nearly over, with a splashy Apple event titled "Let Loose" scheduled for today. This comes after an unusually long gap between iPad releases.
New iPads Take Center Stage
According to reliable sources, the spotlight will be on the latest iPad lineup. Rumors suggest the unveiling of a new iPad Pro boasting a cutting-edge OLED display, potentially accompanied by a larger 13-inch version. An upgraded iPad Air with a similar display technology might also be part of the show.
M4 Chip: A Surprise Guest?
While the focus is firmly on the iPads, whispers suggest a surprise appearance by the next-generation M4 chip. This unveiling would be a mere six months after the launch of the M3 series, prompting speculation about Apple's strategic direction.
A.I. Chip Development: A Side Story
An article from Wall Street Journal also touches upon Apple's development of a custom-designed chip for artificial intelligence applications within data centers. However, the Wall Street Journal report casts doubt on whether this chip will ever see real-world deployment.
wsj.com/tech/ai/apple-is-developing-ai-chips-for-data-centers-seeking-edge-in-arms-race-0bedd2b2
Investor Takeaway
The "Let Loose" event holds significant promise for Apple investors. The launch of new iPads, particularly the potentially premium iPad Pro models, could generate a surge in sales. The M4 chip, if confirmed, could further solidify Apple's position as a leader in chip technology. While the A.I. chip development is intriguing, investors should likely focus on the more immediate impact of the upcoming iPad releases.

AAPL Apple Options Ahead of EarningsIf you haven`t bought AAPL before reaching all time high:
or sold the beginning of the retracement:
Then analyzing the options chain and the chart patterns of AAPL Apple prior to the earnings report this week,
I would consider purchasing the 177.5usd strike price Calls with
an expiration date of 2024-5-3,
for a premium of approximately $2.36.
If these options prove to be profitable prior to the earnings release, I would sell at least half of them.

ROBLOX 46 AFTER EARNINGS ? Q1 2024 Performance:
On February 7th, 2024, Roblox Corporation reported its first-quarter 2024 financial results.
The company’s earnings per share (EPS) for the quarter were -$0.52, surpassing the consensus estimate of -$0.57 by $0.05.
Roblox’s revenue during the quarter was $1.13 billion, exceeding analysts’ expectations of $1.05 billion.
The company’s revenue growth was impressive, showing a 25.3% increase year-over-year1.
User Engagement and Growth:
Roblox’s success is driven by its strong user base and developer community.
The platform witnessed significant growth in average daily active users (DAUs), which surged by 79% to 42.1 million.
Hours engaged on the platform reached 16 billion, reflecting a 20% year-over-year increase.
Bookings grew by an impressive 161% year-over-year.
Analyst Expectations:
Analysts at Roth MKM maintain a buy rating on Roblox shares and have set a price target of $554.
JP Morgan analyst Cory Carpenter upgraded Roblox from Neutral to Overweight, raising the price target from $41 to $48. Carpenter highlighted the company’s consistent bookings growth over the past four quarters and projected first-quarter bookings of $927 million5.
Market Confidence and Future Prospects
Roblox’s innovative platform, expanding user base, and strong financial performance have instilled confidence in investors. As the company continues to enhance its offerings and attract more users, its stock price may continue to rise.

Can AI Be the iPhone's New Ace in the Hole?Apple, the tech giant synonymous with innovation, has faced a slump in iPhone sales. A recent report showed a 10.5% year-over-year decline, raising concerns among investors and analysts. However, a glimmer of hope emerges with Apple's growing focus on Artificial Intelligence (AI). Analysts are increasingly optimistic that these "nascent" AI offerings could be the key to reigniting iPhone sales.
The smartphone market has become increasingly saturated. Consumers are holding onto their devices for longer periods, with incremental upgrades failing to excite. Apple needs a game-changer, a feature so compelling that it compels users to upgrade. AI has the potential to be that difference-maker.
Here's how AI could breathe new life into iPhone sales:
• Personalized Experiences: AI can personalize the iPhone experience to an unprecedented level. Imagine an intelligent assistant that anticipates your needs, proactively adjusts settings, and curates content based on your preferences. This level of customization could make the iPhone feel like an extension of yourself, fostering a stronger connection with the device.
• Smarter Camera Features: AI can revolutionize smartphone photography. Advanced image recognition could remove unwanted objects from photos in real-time, suggest optimal composition based on the scene, and even enhance low-light shots. Such features would not only elevate photo quality but also simplify the process, making professional-looking photos accessible to everyone.
• Enhanced Security and Privacy: Security breaches and privacy concerns are major pain points for smartphone users. AI can play a crucial role in safeguarding user data. Imagine facial recognition that adapts to changes in your appearance or voice recognition that discerns between authorized and unauthorized users. Coupled with on-device processing of sensitive data, AI could make iPhones the most secure smartphones on the market.
• Voice Assistant Revolution: Siri, Apple's current voice assistant, faces stiff competition from Google Assistant and Amazon Alexa. AI advancements could transform Siri into a truly intelligent companion. Imagine a voice assistant that understands complex questions, engages in natural conversations, and seamlessly integrates with other smart home devices. This would not only boost user convenience but also position the iPhone as the central hub of the smart home ecosystem.
• Augmented Reality (AR) Applications: AI can be the driving force behind innovative AR experiences. Imagine using your iPhone to overlay furniture virtually in your living room to see how it looks before you buy it. Or, perhaps utilizing AI-powered translations in real-time during conversations abroad. Such AR applications, powered by AI, could unlock a whole new realm of possibilities for iPhone users.
Of course, challenges remain. Integrating complex AI features requires significant processing power, which could strain battery life. Additionally, ensuring user privacy while leveraging AI capabilities is paramount. Apple must strike a delicate balance between innovation and user trust.
Despite these challenges, the potential benefits are undeniable. By harnessing the power of AI, Apple can create a truly intelligent and personalized iPhone experience. This, in turn, could reignite consumer interest and propel iPhone sales back to new heights.
The success of this strategy hinges on Apple's ability to execute. They must develop robust AI features that are not just gimmicks but genuinely enhance the user experience. If Apple can achieve this, the iPhone might just reclaim its position as the most coveted smartphone on the market, breathing life back into sales and solidifying Apple's reputation as a leader in cutting-edge technology.

Apple: "Buy the dip " in short term?Hi Traders!
On the daily time frame NASDAQ:AAPL has completed an important bullish structure and it is currently working on a corrective structure on the intraday chart. That said, in our view, Apple will trigger a bullish corrective structure in the near term, with ABC Pattern or a harmonic structure. With this in mind, our view is bullish with “Buy The Dip” with Target 1 around 180 area.
Trade with care
Like | Share | Comment

Apple's Q2 Earnings: Mixed Bag with Share Buyback Boost
Apple's fiscal second-quarter earnings report presented a mixed picture for investors. While earnings per share (EPS) surpassed Wall Street expectations, overall revenue and iPhone sales experienced a decline. However, the company's massive share buyback announcement signaled confidence in its future.
Earnings Beat Expectations, Revenue and iPhone Sales Fall
Apple reported earnings per share of $1.52, exceeding analyst estimates of $1.48. This indicates that the company remained profitable, with each share of Apple stock generating slightly more income than anticipated.
However, the news wasn't entirely positive. Total revenue for the quarter dropped 4% year-over-year to $89.5 billion. This decline highlights a slowdown in overall business compared to the same period last year.
Further dampening investor sentiment was a 10% year-over-year decline in iPhone sales. This, Apple's flagship product, is a crucial source of revenue for the company. The decrease suggests a potential softening of demand or increased competition in the smartphone market.
Tim Cook Cites Difficult Comparisons
Apple CEO Tim Cook offered some context for the declining revenue and iPhone sales. He attributed the figures to a "difficult comparison" to the stellar performance of the same quarter in 2023. Last year's Q2 saw a surge in demand for Apple products due to factors like pandemic-driven remote work and learning.
Share Repurchase Announcement: A Confidence Signal
Despite the decline in revenue and iPhone sales, Apple made a bold move by announcing a staggering $110 billion share repurchase program. This is the largest such program in the company's history.
Share repurchases, also known as stock buybacks, involve a company buying back its own shares from the market. This can have several implications:
• Boosting Stock Price: By reducing the number of shares outstanding, buybacks can increase the earnings per share (EPS) ratio, potentially making the stock more attractive to investors.
• Signaling Confidence: A large buyback program can be interpreted as a sign of management's confidence in the company's future prospects. They are essentially using excess cash to invest back into the company itself.
• Returning Value to Shareholders: Buybacks are a way for companies to return excess cash to shareholders. This can be particularly appealing to investors seeking to generate income from their holdings.
Looking Ahead: A Balancing Act
Apple's Q2 earnings report presents a company navigating a dynamic market landscape. While EPS exceeded expectations, declines in revenue and iPhone sales raise questions about future growth. The massive share repurchase program indicates a commitment to shareholder value, but the effectiveness of this strategy hinges on Apple's ability to reignite revenue growth.
Investors will be closely monitoring upcoming reports and developments to assess Apple's ability to overcome these challenges and maintain its position as a tech industry leader.

Apple sees drop in revenue and net incomeApple delivered its financial results for the second quarter of fiscal year 2024. According to the report, the company generated revenue worth $90.753 billion, down 4.3% YoY, and net income of $23.636 billion, representing a decrease of 2.16% YoY. Operating income amounted to $27.9 billion for the same period, falling 1.5% YoY. In addition to that, Apple announced the largest share buyback program in the company’s history, amounting to $110 billion.
Net revenue = $90.7 billion (-4.3% YoY) vs. $94.8 billion in FY2Q23
Net income = $23.6 billion (-2.16% YoY) vs. $24.1 billion in FY2Q23
Operating income = $27.9 billion (-1.5% YoY) vs. $28.3 billion in FY2Q23
Earnings per share = $1.53 (0% YoY) vs. $1.53 in FY2Q23
Illustration 1.01
The illustration above shows Apple's price action in the aftermarket, with shares soaring more than 7%.
Additional information
Operating costs rose 5.2% YoY to $14.3 billion.
iPhone sales fell 10.4% YoY.
Mac sales increased nearly 4% YoY.
iPad sales went down 16.6% YoY.
Sales in the wearable, home, and accessories category dropped 9.6% YoY.
Revenue from services grew by 14.1%
The company’s liabilities declined by about 9.4% YoY.
Apple increased its dividend to $0.25 per share.
Forward guidance
Apple did not provide any forward guidance. However, its CEO, Tim Cook, said the company plans to announce in regard to artificial intelligence. On top of that, he expressed optimism about the company’s operations in China.
Please feel free to express your ideas and thoughts in the comment section.
DISCLAIMER: This analysis is not intended to encourage any buying or selling of any particular securities. Furthermore, it should not be a basis for taking any trade action by an individual investor or any other entity. Therefore, your own due diligence is highly advised before entering a trade.

APPLE This is why you should not miss this buy opportunity.Apple (AAPL) dived by -18% from the December 14 2023 High and following yet another rejection on its 1D MA50 this week, many turned increasingly skeptical over the stocks future. On this chart however, we examine Apple's ratio against Nasdaq (NDX) and gives a very clear answer.
As you can see, the ratio is about to form a Death Cross on the 1W time-frame, with the price attempting a rebound after having been hammered below the 1W MA200 (orange trend-line). In the past 11 years, every time the ratio was below its 1W MA200 (green arc) and on a 1W Death Cross in particular, that was the market bottom and Apple largely outperformed the rest of the index.
In fact the minimum it rose by until the next large correction was +53.54% and the maximum +95.31%. In 1W RSI terms, this bottom is very similar to January 2013, when the RSI also got extremely oversold at 20.00.
Bottom-line: Apple is most likely expected to outperform the index in the coming years, thus presenting a very rare long-term buy opportunity.
-------------------------------------------------------------------------------
** Please LIKE 👍, FOLLOW ✅, SHARE 🙌 and COMMENT ✍ if you enjoy this idea! Also share your ideas and charts in the comments section below! This is best way to keep it relevant, support us, keep the content here free and allow the idea to reach as many people as possible. **
-------------------------------------------------------------------------------
💸💸💸💸💸💸
👇 👇 👇 👇 👇 👇

The Best Months of The Year to Invest in US Stock to Make Money This video will show you the best months of the year you should be investing in US stock market.
In the video, I showed proof that this method works almost every time.
But if you feel you need me to guide you further on how to manage your investment portfolio, feel free to send me a DM now.
If you find this video helpful, give it a like, drop comments, and share it with your friends.

AMAZON 189 AFTER OR BEFORE EARNINGS ?Reasons Why !!
Key Financial Insights:
Stock Price: Amazon’s stock reached a peak of $189.77 on April 11, 2024, showcasing a remarkable uptrend1.
Market Performance: The company’s strong market performance is evident as the stock price hovers close to its 52-week high.
Behind the Surge:
Amazon continues to dominate the e-commerce space with innovative strategies and a customer-centric approach.
The company’s expansion into new markets and consistent investment in technology and infrastructure contribute to its financial health.
Investor Confidence:
The rise to $189 signifies a vote of confidence from investors who are optimistic about Amazon’s direction and leadership.
Analysts remain bullish on the stock, with projections of further growth and a positive outlook for the company’s profitability
