APPLE A FRESH APPLE TO BITEThe chart for Apple (NASDAQ: AAPL) shows the following key elements:
Rejection Trends: Marked in red, indicating levels where the price has faced resistance and reversed.
Support Levels: Marked in green, with horizontal support indicated by dotted lines, showing price levels where the stock has historically found buying interest.
Price Targets: Marked with specific values, suggesting potential future price levels based on the analysis.
Guideline: Represented by a dashed line, likely indicating a trend or channel guideline.
RSI and Trends: Displayed at the bottom, with the Relative Strength Index (RSI) and additional trend indicators in colorful lines.
Earnings: Marked with purple dashed lines, highlighting significant earnings dates or periods.
The chart covers a timeframe from mid-2023 to June 20, 2025, with the latest data point at 12:07 AM EDT on June 20, 2025.
Watch out, because there is a price target to 169. Meaning, we need to be careful.
There is also a price target to 280+ which has support of indicators.
Heading into earnings we might see the 215 mark which could see a slight drop to around 205, and then could see a climb over months to 280. Even 300+
Watch the trends, and price targets, if at trend, look to sell or buy depending on if support or resistance.
Apple

Apple Near Key Support — Long Setup DevelopingIntroduction:
Apple NASDAQ:AAPL is approaching a critical support zone that has consistently held over the past two months. As price retraces toward this level, it presents a potential long opportunity for traders looking to position ahead of the next bullish leg.
Technical Setup:
Support Zone: $193 – $196
This area has acted as a strong demand zone, providing multiple bounce points since April.
Price is now pulling back into this region, offering a potential entry for a long trade.
Trade Idea:
Entry: $193 – $196 (on confirmation of support holding)
Take Profit Targets:
First Target: $210 – $215
Second Target: $225 – $233
Stop Loss: Just below $184 (to protect against a breakdown from support)
#AAPL #Apple #Stocks #TechnicalAnalysis #SupportZone #LongSetup #TradingStrategy #NASDAQ #TechStocks #RiskReward

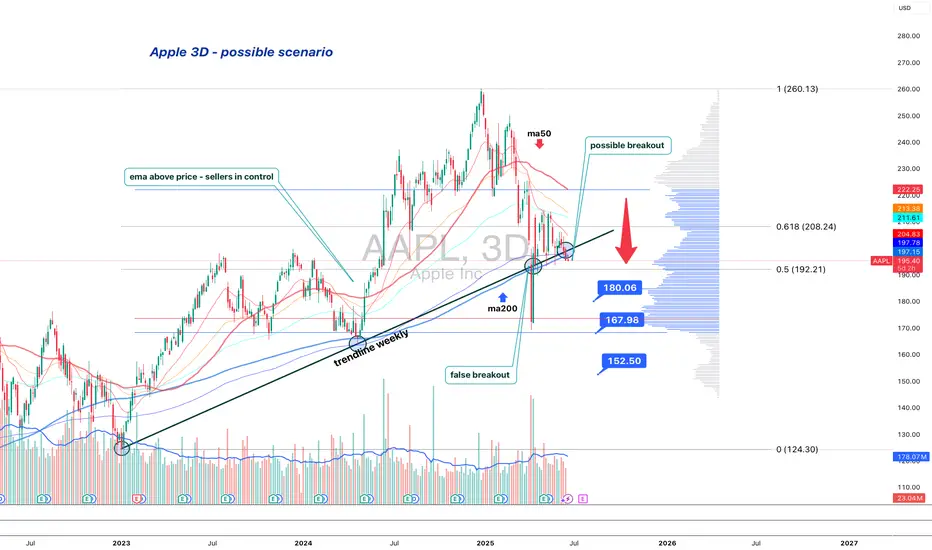
Apple is standing at the edgeApple (AAPL) is losing its long-term structure — second retest of the broken trendline suggests a bearish setup
On the 3D chart, Apple shows signs of structural breakdown. The weekly trendline from 2023 was broken and retested — twice. The price failed to regain it and now trades below, with candles showing weakness: low body closes, upper wicks, and no upside follow-through.
MA200 is now above price, and all EMAs are turning down. Volume Profile shows a heavy resistance block near $197. If the price remains below, sellers are in control.
Key levels:
— $192.20 = 0.5 Fibo support.
— Breakdown ➝ targets: $180 → $167 → $152.
Fundamentals:
Apple's recent reports show decelerating growth, weak China demand, and compressed margins. While AI buzz supports sentiment, institutional flow suggests distribution. BigTech may be topping out, and Apple is positioned for pullback.
Strategy:
Short below $196 with confirmation. Stop: $198. Targets: $180 / $167 / $152.
Failure to reclaim $192–197 = broken trend confirmed.
This is not a growth setup. This is where trends end — and profit-taking begins.
APPLE WILL GO UP!Right now, 4th of April I'm standing in APPLE STORE THE GROVE LOS ANGELES
and I'm telling you - the price will turn around ASAP!
That's not financial advice

APPLE: Long Signal with Entry/SL/TP
APPLE
- Classic bullish pattern
- Our team expects retracement
SUGGESTED TRADE:
Swing Trade
Buy APPLE
Entry - 196.46
Stop - 192.63
Take - 203.97
Our Risk - 1%
Start protection of your profits from lower levels
Disclosure: I am part of Trade Nation's Influencer program and receive a monthly fee for using their TradingView charts in my analysis.
❤️ Please, support our work with like & comment! ❤️

APPLE: 3 year Channel Up targets $285.Apple is marginally bearish on its 1D technical outlook (RSI = 43.788, MACD = -0.260, ADX = 30.978) as the recent weakness impeded the price from making the decisive bullish break-out above it. The 1W RSI structure though indicates that this is a bottom formation and it is evident on the Channel Up that the April 7th low has been the start of the new bullish wave. The first bullish wave which also started after a -32% correction, made a first peak on the 1.236 Fibonacci extension. We are bullish on Apple long term, TP = 285.00.
## If you like our free content follow our profile to get more daily ideas. ##
## Comments and likes are greatly appreciated. ##

APPLE over 206.35 , 211 ?Apple looks good. WWDC next week could see a pop into the event , anything unexpected could help the stock

AAPL Monthly Support and Resistance Lines for June 2025AAPL Monthly Support and Resistance Lines for June 2025, valid only until the end of June.
Overview:
These purple lines serve as support and resistance levels when the price approaches these lines from either the bottom or top direction. Depending on the price movement direction, traders can enter long or short positions.
Trading Timeframes
I typically utilize 30-minute candlesticks for swing trading options, with a holding period of up to 2-3 days. Additionally, 3-hour or 4-hour timeframes can also be used for swing trades lasting up to 2 weeks to capture significant upward or downward movements.
I post these at the beginning of each month, and they remain valid until the end of that month.

APPLE The Target Is DOWN! SELL!
My dear subscribers,
This is my opinion on the APPLE next move:
The instrument tests an important psychological level 203.93
Bias - Bearish
Technical Indicators: Supper Trend gives a precise Bearish signal, while Pivot Point HL predicts price changes and potential reversals in the market.
Target - 201.90
About Used Indicators:
On the subsequent day, trading above the pivot point is thought to indicate ongoing bullish sentiment, while trading below the pivot point indicates bearish sentiment.
Disclosure: I am part of Trade Nation's Influencer program and receive a monthly fee for using their TradingView charts in my analysis.
———————————
WISH YOU ALL LUCK

Apple Stock Drops: Is Slow AI Development to Blame?The tech world was abuzz on Monday as Apple, a titan of industry and a beacon of innovation, experienced a sudden and significant dip in its stock value, shedding approximately $75 billion in market capitalization. This abrupt decline sent ripples through the investment community, prompting a closer examination of the underlying factors contributing to what many perceive as a rare moment of vulnerability for the Cupertino giant. While market fluctuations are a normal part of the financial landscape, this particular downturn has been widely attributed to growing investor apprehension regarding Apple's perceived slow progress in the burgeoning field of generative artificial intelligence (AI). In an era where competitors are aggressively pushing the boundaries of AI capabilities, Apple's more measured approach appears to be raising questions about its future competitive edge and its ability to maintain its unparalleled ecosystem.
The $75 Billion Question: Unpacking Apple's Stock Drop
Apple's stock drop on Monday was not an isolated incident but rather a culmination of mounting concerns among investors. While the immediate trigger for such a sharp decline can often be a specific news event or analyst downgrade, the broader context points to a deeper anxiety: the pace and direction of Apple's generative AI development. For a company that has historically set the pace in consumer technology, a perception of lagging in a critical emerging technology like generative AI is a significant red flag for the market.
The $75 billion loss in market value represents a substantial sum, even for a company of Apple's immense size. It signifies that a considerable portion of investor confidence, particularly concerning future growth prospects, has been eroded. This erosion stems from the understanding that generative AI is not just another feature; it is poised to revolutionize how users interact with technology, from personal assistants to content creation and productivity tools. Companies that fail to innovate rapidly and effectively in this space risk being left behind, potentially losing market share and, more importantly, mindshare among consumers.
Investors are keenly aware that the tech landscape is unforgiving. Past leaders, even those with seemingly unassailable positions, have faltered when they failed to adapt to paradigm shifts. The market's reaction to Apple's AI progress, or lack thereof, is a testament to the perceived urgency and transformative potential of generative AI. It suggests that the market is valuing future AI capabilities heavily, and any perceived deficit in this area translates directly into a discounted valuation. The stock drop, therefore, serves as a stark reminder that even for Apple, continued dominance is not guaranteed without aggressive innovation in key technological frontiers.
Apple's Generative AI Journey: A Work in Progress
Apple's approach to AI has historically been characterized by a focus on integration, privacy, and user experience. Features like Siri, Face ID, and computational photography are all powered by sophisticated AI algorithms, seamlessly woven into the Apple ecosystem. However, these applications typically fall under the umbrella of discriminative AI, which is designed to make predictions or classifications based on input data. Generative AI, on the other hand, is about creating new content—text, images, audio, video—that is often indistinguishable from human-created output. This is where Apple's "work in progress" status becomes a point of contention.
For years, Apple has been quietly investing in AI research, acquiring smaller AI companies, and hiring top talent. Its chips, particularly the A-series and M-series, are designed with powerful Neural Engines specifically optimized for on-device AI processing. This emphasis on on-device AI aligns with Apple's core philosophy of privacy, allowing many AI computations to occur directly on the device without sending user data to the cloud. While this approach offers significant privacy benefits and can lead to faster, more responsive experiences, it may also present challenges in scaling the massive computational power required for large language models (LLMs) and other complex generative AI applications that often rely on vast cloud infrastructures.
The challenge for Apple lies in translating its existing AI prowess and privacy-centric philosophy into compelling generative AI experiences that can compete with the rapid advancements seen elsewhere. While there have been reports and rumors of Apple developing its own LLMs and generative AI tools, concrete product announcements or widespread public demonstrations have been notably absent. This silence, coupled with the aggressive public releases from competitors, has fueled the narrative that Apple is behind the curve. The market is looking for tangible evidence of Apple's generative AI capabilities, not just promises of future integration. The "work in progress" status, while a natural part of any complex technological development, is being scrutinized under a microscope, especially given the high stakes of the generative AI race.
The AI Race: Contrasting Apple with OpenAI, Google, and Microsoft
The generative AI landscape is currently dominated by a few key players who have made significant strides, setting a high bar for innovation and public perception. The contrast between these leaders and Apple's perceived pace is stark and forms the crux of investor concerns.
OpenAI, with its groundbreaking ChatGPT, DALL-E, and Sora models, has arguably ignited the current generative AI boom. Its strategy has been one of rapid iteration, public release, and collaborative development, often prioritizing innovation and accessibility over immediate commercialization. This approach has allowed OpenAI to capture significant public attention and demonstrate the immense potential of generative AI, effectively becoming the face of the movement.
Google, a long-standing leader in AI research, has been quick to integrate generative AI into its vast ecosystem. Its Gemini models are designed to be multimodal and highly capable, powering features across Google Search, Workspace, and Android. Google's advantage lies in its immense data reserves, vast computational infrastructure, and decades of AI expertise. While it initially faced criticism for being slow to respond to ChatGPT, Google has since demonstrated its commitment to integrating generative AI deeply into its core products and services, showcasing a comprehensive and aggressive strategy.
Microsoft, through its strategic partnership and substantial investment in OpenAI, has positioned itself as a formidable force in the generative AI space. By integrating OpenAI's models into its Azure cloud services, Microsoft 365 suite (Copilot), and Bing search engine, Microsoft has rapidly brought generative AI capabilities to millions of enterprise and consumer users. This partnership has allowed Microsoft to leverage cutting-edge AI research without having to build every component from scratch, accelerating its time to market and providing a significant competitive advantage.
In contrast, Apple has historically preferred to develop its core technologies in-house, maintaining tight control over its hardware and software integration. While this approach has resulted in highly optimized and secure products, it may be a slower path when it comes to rapidly evolving, data-intensive fields like generative AI. The lack of a public-facing, widely accessible generative AI product from Apple, akin to ChatGPT or Gemini, creates a perception that it is not participating in the same league as its rivals. This perception, whether entirely accurate or not, is what is currently impacting investor confidence and contributing to the stock's recent performance. The market is looking for Apple to demonstrate its unique value proposition in generative AI, beyond its traditional strengths.
Challenges and Implications for Apple
Apple's perceived lag in generative AI development presents several significant challenges and implications for its future.
Firstly, there's the risk of falling behind in core product experiences. As generative AI becomes increasingly integrated into operating systems, productivity suites, and creative tools, devices and platforms that lack these capabilities may appear less competitive. Imagine a future where intelligent agents seamlessly manage tasks, generate content, and provide hyper-personalized experiences. If Apple's ecosystem doesn't offer comparable features, it could erode its premium appeal and lead users to platforms that do.
Secondly, developer mindshare is crucial. The most innovative applications and services often gravitate towards platforms that offer the best tools and capabilities. If generative AI developers perceive Apple's platform as less capable or slower to adopt cutting-edge AI models, they might prioritize other ecosystems, potentially leading to a stagnation in the breadth and quality of third-party applications within the Apple App Store.
Thirdly, ecosystem lock-in, a traditional Apple strength, could be challenged. While Apple's integrated hardware and software create a powerful ecosystem, the allure of superior AI capabilities on other platforms could tempt users to switch. For instance, if Google's AI-powered features on Android become significantly more advanced and useful than what Apple offers on iOS, even loyal Apple users might consider alternatives.
Finally, there's the impact on brand perception and innovation narrative. Apple has built its brand on innovation and pushing technological boundaries. A perception of being a follower rather than a leader in a transformative technology like generative AI could tarnish this image, potentially affecting consumer loyalty and its ability to attract top talent in the long run. The $75 billion stock drop is a clear signal that the market is taking these implications seriously.
The Path Forward: Apple's Strategy to Reclaim AI Leadership
Despite the current concerns, it would be premature to count Apple out of the generative AI race. The company possesses immense resources, a vast user base, unparalleled brand loyalty, and a proven track record of entering established markets and redefining them. Apple's path forward in generative AI will likely involve several strategic moves.
One approach could be to leverage its existing hardware advantage. Apple's custom silicon, particularly the Neural Engine in its A-series and M-series chips, provides a powerful foundation for on-device AI. The company could double down on developing highly efficient, privacy-preserving generative AI models that run directly on its devices, offering unique capabilities that cloud-based solutions cannot match. This would align with its privacy-first philosophy and differentiate its offerings.
Secondly, strategic acquisitions and partnerships could accelerate its progress. While Apple prefers in-house development, the rapid pace of generative AI might necessitate acquiring specialized AI startups or forming partnerships with leading AI research labs to quickly integrate cutting-edge models and talent. This would allow Apple to bridge any perceived gaps more rapidly.
Thirdly, Apple might focus on integrating generative AI subtly and seamlessly into its existing products and services, rather than launching standalone, attention-grabbing AI models. This "Apple way" of introducing technology often involves refining and perfecting features before a public rollout, ensuring they are intuitive and enhance the user experience without being overtly complex. This could involve AI-powered enhancements to Siri, improved content creation tools in its creative suite, or more intelligent automation within iOS and macOS.
Finally, developer engagement will be crucial. Apple needs to provide robust tools and frameworks that empower developers to integrate generative AI capabilities into their apps, leveraging Apple's on-device AI power. This would foster a vibrant ecosystem of AI-powered applications that further enhance the value proposition of Apple devices.
In conclusion, Apple's recent stock drop serves as a potent reminder of the market's high expectations and the transformative power of generative AI. While the company's deliberate and privacy-focused approach to AI has its merits, the rapid advancements by competitors like OpenAI, Google, and Microsoft have created a perception of lag. The challenge for Apple is to demonstrate how its unique strengths—integrated hardware and software, a focus on user experience, and a commitment to privacy—can translate into a compelling and competitive generative AI strategy. The coming months will be critical as Apple navigates this pivotal technological shift, aiming to reassure investors and consumers that it remains at the forefront of innovation, ready to define the next era of personal computing with its own distinct AI vision.

Are The Markets Running Out Of Steam? SPY just cant seemed to hold above the 600 psychological level.
Are big players unloading into this positive market strength?
Are we due for a larger pullback?
There's a lot of mixed price action and we just cant seem to make a true breakout.
Some names are underperforming and other names are outperforming.
We remain tactically bullish while trimming keys positions into strength.
Being nimble in this market us key as were seeing large intra day swings.
Short term there is some risk of lower price so we have hedged in some individual names while still remaining bullish.

Who likes Apple Crumble....WWDC Event FlopSome Key Areas:
Unified Design: Liquid Glass
- Apple unveiled a new design language called Liquid Glass, inspired by visionOS. This aesthetic introduces rounded, translucent elements across iOS 26, iPadOS 26, macOS 26 ("Tahoe"), watchOS 26, tvOS 26, and visionOS 26, aiming for a cohesive and modern look across all devices
Apple Intelligence & AI Enhancements
- Apple expanded its AI capabilities under the Apple Intelligence umbrella:
On-Device AI Models: Developers can now access Apple's on-device large language models to integrate AI features into their apps, ensuring privacy and efficiency.
- Genmoji: A new feature allowing users to create personalized emojis by merging existing ones.
- ChatGPT Integration: Siri can now delegate complex queries to ChatGPT, powered by GPT-4o, with user consent.
- Live Translation: Real-time translation is now available in Messages, FaceTime, and Phone apps, enhancing multilingual communication.
iOS 26 & iPadOS 26: Enhanced User Experience
- Redesigned Apps: Updated Camera, Safari, and Phone apps featuring the new Liquid Glass design.
iPadOS 26 brings
- Advanced Multitasking: Enhanced window management and a Mac-like Preview app.
macOS 26 ("Tahoe"): Productivity Focus
- Personalized Spotlight: Improved search functionality with AI-driven suggestions.
WatchOS 26 & AirPods Enhancements
- AI-Powered "Workout Buddy": Provides real-time insights and encouragement during fitness activities.
Gaming & Developer Tools
- Apple Gaming Hub: A new app aggregating games and challenges, enhancing the gaming experience across devices.
Apple is at a technical inflection point. It needs to hold the wedge or it runs the risk to going lower to the previous lower boundary range.

5 stocks that shook the market in MayMay 2025 turned out to be a landmark month for the U.S. stock market. Several top companies posted impressive gains driven by explosive demand for AI technologies, advancements in autonomous transport, and strong corporate strategy.
Here are the five market leaders that set the tone in May:
1. Nvidia – The AI Powerhouse
Nvidia (#NVIDIA) surged 25% in May, becoming the most valuable U.S. company with a market cap of $3.45 trillion — surpassing even Microsoft. The rally was fueled by stunning data center results, with revenue hitting $39.1 billion (+427% YoY). Its new Blackwell chip series has already sparked massive interest from leading AI developers. UBS analysts raised their price target to $175, predicting further growth in high-performance computing.
2. Apple – A return to growth
Apple (#Apple) saw a solid 7% gain, rebounding from earlier struggles. The company announced $500 billion in long-term investments over the next five years to create new jobs and manufacture AI servers in the U.S. This move restored investor confidence and supported the stock’s recovery.
3. Tesla – Robotaxis drive momentum
Tesla (#Tesla) jumped 25%, boosted by the announcement of its robotaxi launch in Austin, Texas, scheduled for June 12. Combined with improving market conditions and a pause in EU tariff pressure, Tesla shares reclaimed center stage. Wedbush analysts see potential for the stock to hit $500 as the company expands its autonomous and AI-driven initiatives.
4. Moderna – Biotech breakthroughs
Moderna (#Moderna) gained 7% following positive results from new cancer drug trials. The company also revealed plans to cut operational costs by $1.7 billion by 2027, aiming to boost overall efficiency. Investors welcomed the strategic pivot beyond COVID-related products.
5. Alcoa – Aluminum and geopolitics
Alcoa (#Alcoa) rose 6.5% on reports that the U.S. may ban aluminum imports from Russia. This geopolitical development, along with steady dividends and renewed investor interest in commodities, positioned Alcoa as a top-performing metals stock for the month.
May 2025 confirmed the market’s focus on AI, autonomous transport, biotech, and raw materials. Nvidia, Tesla, Apple, Moderna, and Alcoa led the charge — and FreshForex analysts recommend riding this momentum for active trading on high-performing stocks.

AAPL Weekly Options Outlook — June 3, 2025📈 AAPL Weekly Options Outlook — June 3, 2025
🚨 AI Model Consensus: Moderately Bullish into June 6 Expiry
🧠 Model Summary
🔹 Grok (xAI)
Bias: Moderately Bullish
Setup: Price above EMAs, MACD divergence softening; resistance at $203.40
Trade: Buy $207.50C @ $0.67 → PT $1.00, SL if AAPL < $202
Confidence: 65%
🔹 Claude (Anthropic)
Bias: Moderately Bullish
Setup: Bullish reversal, rising EMAs, MACD improving
Trade: Buy $207.50C @ $0.67 → PT $1.20–$1.80, SL $0.35
Confidence: 70%
🔹 Gemini (Google)
Bias: Moderately Bullish
Setup: Above EMAs, MACD histogram rising; resistance $203.46–$203.81
Trade: Buy $207.50C @ ~$0.65 → PT $0.97–$1.14, SL $0.32
Confidence: 65%
🔹 Llama (Meta)
Bias: Moderately Bullish
Setup: Above EMAs, MACD crossover building
Trade: Buy $207.50C @ $0.67 → PT $0.80, SL $0.335
Confidence: 70%
🔹 DeepSeek
Bias: Moderately Bearish
Setup: MACD still negative; resistance at $203.81
Trade: Buy $200P @ $0.93 → PT $1.86, SL $0.46
Confidence: 65%
✅ Consensus Highlights
🔼 Bullish Momentum on short-term EMAs
📉 Max Pain at $200 could limit upside by Friday
📊 Strong liquidity on both $207.50C and $200P
🔁 Most models plan to exit midweek; only DeepSeek expects a breakdown
🎯 Recommended Trade Setup
💡 Strategy: Bullish Single-Leg Weekly Call
🔘 Ticker: AAPL
📈 Direction: CALL
🎯 Strike: $207.50
💵 Entry: $0.67 (ask)
🎯 Profit Target: $1.17 (+75%)
🛑 Stop Loss: $0.34 (−50%)
📏 Size: 1 contract
📅 Expiry: 2025-06-06
⏰ Entry Timing: Market Open
📈 Confidence: 68%
⚠️ Risk Factors
📉 Max pain gravity could limit upside later in the week
🔼 Resistance zone at $207.50–$210 may stall momentum
⌛ Rapid theta decay — needs early move to profit
📰 Any negative macro or tech headlines could invalidate setup

SPY New All Time Highs IncomingThe #SPY weekly chart is so bullish but don't take my word for it.
Simply look at the weekly bullish crossover that occurred between the 7 week & the 20 Week MA.
The last time this occurred was in Nov 2023 and the markets ripped 19% before having a major 3 week pullback and then another soaring continuation higher.

Bullish Intraday Patterns Everywhere!SPX had a wonderful intraday hourly chart confirmed breakout. This pattern is bullish and likely will continue higher.
The bulls tomorrow would love to confirm the daily chart breakout and will try to push for that.
SPY/SPX is holding more relative strength than the Q's & IWM which is displaying broad participation.
There are many bullish charts showing accumulation, golden crosses and bullish MA crossovers.
The DXY appears to be wanting to break down to around $97.00 which should yield more upside.
We secured profits today on SPY 594 calls & NVDA 144 calls.
We still remain net long and see the S&P 500 over $6000
Apple, XYZ, AI - are bullish setups were continuing to manage.

$NASDAQ:AAPL - bEST AREAS TO lONG ANDA WAIT FOR RIGHT TIME !NASDAQ:AAPL
best areas to long and wait for right time!
best accumulation areas:
green areas = best support:

TSLA PRICE ACTION 1ST JUNE 2025This is the updated price action of Tesla. I have explained why I exited long positions. If you have any doubts, then feel free to leave a comment below.
NOTE: STAY AWAY FROM TSLA LONGS

Apple - Please look at this chart!Apple - NASDAQ:AAPL - is just wonderful:
(click chart above to see the in depth analysis👆🏻)
Last month, Apple created a quite strong bullish rejection wick of about +25%. It was actually no surprise at all, because market structure was perfectly pushing price higher. Following the bullish break and retest pattern, new all time highs will most likely follow.
Levels to watch: $200, $300
Keep your long term vision!
Philip (BasicTrading)

$AAPL laggard to the upside?All of the tech stocks recently have had a large moves to the upside, yet Apple has yet to have one. I think Apple is lagging the other names and is likely to have the same kind of move to the upside.
I rarely trade short term, but this one seems like a good setup.
I took a trade for 6/6 $235C to express this view.
Let's see if it plays out.

Apple Stock Heist Blueprint – Precision Buy Setup Unlocked!🏴☠️ Apple Stock Heist: The Stealthy Long Setup
🎯 Entry Zone – Loot the Dip!
Current Price: $200.21
Action: Initiate long positions now or target pullbacks near the $193–$190 support zone.
Pro Tip: Place buy limits near swing lows/highs. Utilize chart alerts as your secret weapon.
🛡️ Stop Loss – Guard the Treasure!
Swing Traders: Position stop loss below the $190 support level.
Day Traders: Adjust stop loss according to your risk tolerance and order count.
TECHi
💰 Profit Target – Escape with the Loot!
Primary Target: $210 resistance zone.
Secondary Target: $227–$230 range.
⚔️ Scalpers vs. Swing Traders – Choose Your Weapon!
Scalpers: Focus on quick strikes. Enter long positions and exit swiftly.
Swing Traders: Trail stops and lock in gains as the price moves in your favor.
🌪️ Market Pulse – Bullish Winds Blowing!
Technical Indicators: Price is supported near $201, with potential to bounce back toward local resistance at $213.
RSI: Approximately 35 on the 1-hour timeframe, indicating oversold conditions and potential for a rebound.
TradingView
⚠️ News Trap Warning!
Upcoming Events: Monitor for any high-impact news that may affect Apple's stock price.
Strategy: Freeze trades or tighten stops ahead of major announcements.
🚨 Join the Trading Crew!
Engage: Like 👍 or Boost 🚀 this idea to fuel our next raid.
Support: Your engagement keeps the strategies alive!
🤑 Stay Locked In – The Next Big Score is Coming…
Timing: Watch the charts closely.
Action: Strike hard. Exit smarter.

APPLE On The Rise! BUY!
My dear friends,
APPLE looks like it will make a good move, and here are the details:
The market is trading on 195.23 pivot level.
Bias - Bullish
Technical Indicators: Supper Trend generates a clear long signal while Pivot Point HL is currently determining the overall Bullish trend of the market.
Goal - 208.29
Recommended Stop Loss - 187.61
About Used Indicators:
Pivot points are a great way to identify areas of support and resistance, but they work best when combined with other kinds of technical analysis
Disclosure: I am part of Trade Nation's Influencer program and receive a monthly fee for using their TradingView charts in my analysis.
———————————
WISH YOU ALL LUCK

Apple: Wave [2] Correction We now consider the dark green wave to be complete and thus place AAPL in the intermediate corrective movement of wave , which can be further subdivided into waves (A), (B), and (C) in magenta. Currently, only the last part of this (C) wave should be missing before the next impulsive uptrend unfolds towards the previous all-time high. We must still weigh our alternative scenario with a 34% probability: If the price falls below support at $168, this scenario with a new low for the blue wave alt.(IV) would be confirmed, although in this case, the price should not fall significantly below our previous Target Zone.
📈 Over 190 precise analyses, clear entry points, and defined Target Zones - that's what we do.
