December 18: Members Daily AnalysisSPY +0.56% / QQQ +0.43% / IWM +0.04%
Another rally with most sectors selling off! 7 Negatvie 4 Positive
Tech valuation saturation continues.
Apple

Apple Stock To Keep In Portfolio!Hello ladies and gentlemen, according to my graphical analysis of Apple , I recommend for the moment to keep Apple Stock in your portfolio because there is a great probability of reaching 200$ in the next few weeks .

What’s now, $AAPL ? [ Short-term Analysis]AAPL is currently facing a significant challenge: the 0.382 Fibonacci level in wave C, the resistance zone at the old peak, a Mean line of the W1 Channel, all converging at the current moment.
On the bullish side , one of the most encouraging signs is that the B-wave correction is not deep. This is an indication of strong upward momentum. Additionally, the momentum across M, W, D timeframes is in harmony—a reassuring signal. We cannot assert that @Apple is incapable of breaking through the confluence of resistance.
What about the bearish scenario? NASDAQ:AAPL is not responding well to this resistance confluence. Not well at all. The weekly candle couldn't close above the old peak, volume at the peak is increasing significantly, and there are signs of distribution here.
This is a delicate situation!
If forced to speculate, I would choose to SELL; however, I would prefer to stay put at this time. Whether Bull or Bear prevails for NASDAQ:AAPL , there is always a retest to give us an opportunity. Let's wait for it to happen!
WHAT A WISE TRADER DOES?
If you're holding a Buy position : Move the stop loss to a safe point to preserve profits.
If you're holding a Sell position : Set the stop loss carefully.
If you haven't done anything yet? Well, just continue not doing anything!

AAPL Short: Wave 1=Wave 5Well, based on my EW counts and Fibonacci extension, we have reached the target of the move up and it's time for it to go down.
Also note that the new high is NOT accompanied by an equivalent RSI(7) high. A divergence.
Also, this is all-time high. You need any reason for a better risk reward?

Apple - Nothing Is BearishHello Traders, welcome to today's analysis of Apple.
I will only take a trade if all the rules of my strategy are satisfied.
Let me know in the comment section below if you have any questions.
Keep your long term vision.

buy Apple @ 200. Target 450Apple a new breakout after consolidation & rounding bottom .
best buy @ 197-200.
Target 450 in a year

APPLE Technical top at $210.Apple (AAPL) hit on Friday our $195.00 short-term target which we called on our latest November 12 analysis (see chart below):
The rally seems far from over as the recent pull-back turned out to be only a Bull Flag pattern, which typically prompts to a continuation of the trend. Being within a long-term Rising Wedge pattern, this pull-back resembles, even on 1D RSI terms, that of March 02, only on weaker strength (reasonably as the sequences get narrower towards the end of the pattern).
That first rally of the Wedged peaked just above the 1.382 Fibonacci extension. The current sequence's 1.382 Fib is at $210.00, which falls perfectly at the top (Higher Highs trend-line) of the Rising Wedge, and that is our medium-term target.
-------------------------------------------------------------------------------
** Please LIKE 👍, FOLLOW ✅, SHARE 🙌 and COMMENT ✍ if you enjoy this idea! Also share your ideas and charts in the comments section below! This is best way to keep it relevant, support us, keep the content here free and allow the idea to reach as many people as possible. **
-------------------------------------------------------------------------------
💸💸💸💸💸💸
👇 👇 👇 👇 👇 👇

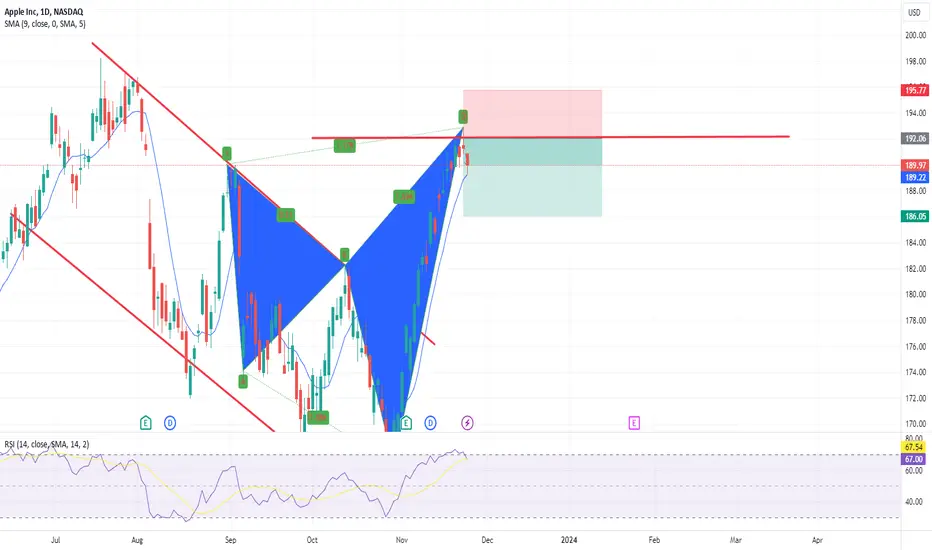
APPLE: Short Signal Explained
APPLE
- Classic bearish pattern
- Our team expects retracement
SUGGESTED TRADE:
Swing Trade
Sell APPLE
Entry - 195.71
Stop - 198.97
Take - 188.36
Our Risk - 1%
Start protection of your profits from lower levels
❤️ Please, support our work with like & comment! ❤️

Mega Cap ReviewApple, MSFT, NVDA, Google, AMZN, Meta, Tesla
All are showing bearish trend changes.
Will Mega caps take down the market?

APPLE My Opinion! SELL!
My dear friends,
My technical analysis for APPLE is below:
The market is trading on 191.24 pivot level.
Bias - Bearish
Technical Indicators: Both Super Trend & Pivot HL indicate a highly probable Bearish continuation.
Target - 187.18
About Used Indicators:
A pivot point is a technical analysis indicator, or calculations, used to determine the overall trend of the market over different time frames.
———————————
WISH YOU ALL LUCK

APPLE: In danger of repeating the Bear Cycle fractal.AAPL could be on the verge of completing November's insane rally that restored bullishness on the 1W chart and keeps the 1D technical outlook in green (RSI = 64.212, MACD = 3.520, ADX = 54.247) as it is failing so far to cross over the LH trendline of the Bearish Megaphone pattern. A structure that up until now is identical to the Megaphone that led to the 2022 Bear Cycle.
In fact the correction started on the current leg we are at that got emphatically rejected on the LH line. After the 1D MA50 failed to support, the selloff (first of that Bear Cycle) extended as low as the 1.618 Fibonacci level. Currently that is at 150.00.
Conversely, on January-February 2023 rally, it was the 1D MA50 that held and provided Support, which in turn had the uptrend continue and extend considerably higher to July's All Time High. Consequently, if the 1D MA50 holds, expect a similar March-July 2023 type continuation of the uptrend, especially if the Fed decides to finally step in and start cutting the Interest Rate.
## If you like our free content follow our profile to get more daily ideas. ##
## Comments and likes are greatly appreciated. ##

🍎Apple🍎 is Ready to Fall at least ➖5%🍎 Apple is moving in the 🟡 PRZ (Price Reversal Zone) 🟡.
💡If we look at the last 4-5 Apple candles in the daily time frame , we can see some Bearish Reversal Candlestick Patterns at the same time: Evening Star Candlestick Patten, Shooting Star Candlestick Pattern, Bearish Harami Candlestick Pattern.
💡Also, another sign of the end of this upward rally can be shown to us by the Stoch RSI indicator .👇
🔔I expect Apple to have a bearish trend in the coming days and at least fall to the 🟢 Support zone($182.95_$181.30) 🟢 and fill all the 🔵 Gaps 🔵.
Apple ( AAPLUSD ) Analyze, Daily time frame⏰.
Do not forget to put Stop loss for your positions (For every position you want to open).
Please follow your strategy; this is just my Idea, and I will gladly see your ideas in this post.
Please do not forget the ✅' like '✅ button 🙏😊 & Share it with your friends; thanks, and Trade safe.

Decoding Apple's AI Strategy: A Hidden Gem in Generative AIDecoding Apple's AI Strategy: A Hidden Gem in Generative AI
In the AI landscape, Apple's ambitions often take a backseat, but underestimating its potential could be a mistake. This article explores why Apple might emerge as a significant player in the evolving AI space.
Apple GPT: A Strategic Response to Generative AI Dominance
While ChatGPT steals the spotlight, Apple is gearing up with Apple GPT, positioning itself as a formidable contender in generative AI.
Billion-Dollar Commitment: Apple's Strong Bet on AI Development
Investing up to $1 billion annually, Apple shows a strong commitment to narrowing the gap in generative AI, leveraging its financial strength.
Financial Fortitude: Apple's Impressive Cash Flow Fuels AI Investments
With $101 billion in free cash flow, Apple's reported annual spend of $1 billion positions it for significant AI integration.
Learning and Adapting: Apple's Advantageous Strategic Entry
Learning from competitors, Apple focuses on safety and data privacy, delivering a superior product with strategic insight.
Global Reach: Apple's Vast User Base as a Strategic Asset
Despite a delayed entry, Apple's network of over 2 billion active devices globally is a substantial asset for polished AI offerings.
Underrated AI Buy: Apple's Measured Approach and Promising Future
As an underrated buy, Apple's AI-enhanced devices present exciting prospects for consumer enthusiasm and increased demand.
Conclusion: "Strategic Patience: Apple's Long-Term Vision in AI Integration"
While not leading the AI race, Apple's strategic timeline suggests long-term success in AI integration, making it a worthwhile investment for patient investors in the evolving tech landscape.
Our preference
Above 182.50 look for further upside with 200 & 210 as targets .

Apple waiting to "take profit"? 28/Nov/23AAPL probably just completed wave B ( Red Circled) which is an expanding flat (A)(B)(C) (Blue). So probably a -20.02% "crash" toward 148 +/-

APPLE ShortThere is a big pattern on H4 and Daily for this short. All of the timeframes are overbought with very good resistance at this level to sell. There is a lot of divergence and double tops so once the price goes to the high of 192 we are going to short it. Also this is part of S&P500 and according to our analysis we believe that it should fall for the next week so with that apple should fall as well.
APPLE: Short Trade with Entry/SL/TP
APPLE
- Classic bearish pattern
- Our team expects retracement
SUGGESTED TRADE:
Swing Trade
Sell APPLE
Entry - 189.98
Stop - 195.15
Take - 180.71
Our Risk - 1%
Start protection of your profits from lower levels
❤️ Please, support our work with like & comment! ❤️

Apple - 2 short ideas - Mirror, mirror on the wall...General
Apple in an uptrend with some small downtrends the last 2 monthsis approaching the yearly open. 2 short ideas that i would be willing to take if the requirements are met.
I will post an additional idea with 1 long setup that i will take if it should develop.
1. Short (Orange arrow)
Requirements
- Price rises above yearly open and the recent swing high
- Price breaks again under yearly open and enter little under the yearly open
Target
Former resistance area (area 1)
Invalidation / SL
- Yearly open and /or Swing High turn support
Stop- Loss
- Above the Swing High
Time duration
Days, weeks, months, years... ;)
2. Short (Blue arrow)
Requirements
- Price falls under area 1
- Area 1 turns resistance
- Enter on retes
Target
Former support level with confluence to the 50% Fib of the current range
Invalidation / SL
- Retaking area 1 after breaking under it
Stop- Loss
- Slightly above area 1
Time duration
Days, weeks, months, years... ;)
Good luck

AAPL Apple Options Ahead of Earnings If you haven`t sold the Double Top on AAPL:
or reentered here:
Then analyzing the options chain and the chart patterns of AAPL Apple prior to the earnings report this week,
I would consider purchasing the 172.5usd strike price Calls with
an expiration date of 2023-11-17,
for a premium of approximately $5.35.
If these options prove to be profitable prior to the earnings release, I would sell at least half of them.
Looking forward to read your opinion about it.

Nasdaq - A Black Friday Blowout Sale?Using the SPX as a reference for ease of use, at the beginning of the November rally I asked whether or not manipulation would come after we saw a 5% rally in 3 days just because the U.S. Treasury decided to spam bonds at a lower, but still already highly inflated, rate in Q4 than they did in Q3.
SPY - Did We Bottom, Or Is Manipulation Coming?
The week before last, I cautioned bulls who believe in the "Santa Rally" thesis that we may just see sideways and manipulation back down with the end of year target being merely 4,600 and not 4,900.
SPX - Santa Ralliers: You Better Keep Your Eyes On The Clock
And for the record, I haven't cared about this rally because I haven't had a position, since there was never a retrace I never went long and shorting has looked bad, and turned out to continue to be bad.
But Friday the 17th marked the monthly Options Expiry (OpEx), and we predictably spent the day sideways. The next week ahead is U.S. Thanksgiving on Thursday, where the markets will be closed for the last time before Christmas, and then Black Friday the day after.
Although there is little news drivers this week, except for Employment on Wednesday and PMI on Friday, I posit that since the Nasdaq set a double top with its July high, we may very well see a 1,000 point "Black Friday blow out sale" this week that sets up a December rally that takes out the All Time High.
Keep in mind after this week, starting with "Cyber Monday," we still have four trading days to complete the November candle, and so we most certainly can dump an awful lot and rally an awful lot to finish the month some 2 or 3% away from where we closed on Friday.
The dangers in the markets are exceptional at the moment, however. Xi Jinping visited San Francisco for the climate theatre conference, where he met with the Biden Administration.
What this event indicates to us is that the International Rules Based Order is extending Xi, who is a Chinese nationalist, an olive branch to cede his control of China and form a critical hub in the coming One World Government.
But the IRBO has never been so intelligent as to understand that it cannot out maneuverer the Red Dragon of the Chinese Communist Party, for the Devil Red is a scourge who has come to ensure that humanity and all of its related souls are totally annihilated.
At the root of the conflict is the 24-year persecution of Falun Dafa, originally started by former Chairman Jiang Zemin on July 20, 1999. The campaign has targeted 100 million spiritual believers, even going so far as to commit the unprecedented sin of live organ harvesting.
Although Xi has been killing the Jianglings for more than a decade in his Anti-corruption Campaign, Xi is still the head of the CCP, the Red Dragon and Destroyer of Worlds, and this is a problem for him that he will either solve by overthrowing the CCP in a coup Gorbachev-style, or Heaven will solve it for him by sacking the Emperor's Bedroom in Zhongnanhai and Beidaihe.
For the IRBO, the problem the whole world faces is that the supposed "International Police" (and its Wall Street financial vanguard) have been staining their hands sanguine crimson with the Jianglings in Shanghai-Babylon all these years.
The sins are so extremely massive that they can never be fully paid for, and they still aren't doing their part to wash their hands and social distance from the Devil Red.
Instead, they're doing everything they can to expand the CCP's Zero-COVID Social Credit system worldwide.
And this is going to cause a Dark Winter for humanity. When that day comes, your indexes and your memestocks, your "Magnificent 7," even, will all trade like crypto dumpstercoins because no market making algorithm will be available to pump and dump, and at the same time everyone will be desperate to sell, with no buyers available.
But the good news is that when that day comes, you won't be paying attention to money anymore. Instead, what is unfolding in this world will be the only thing notable, and you won't have any interest, or any need of, following CNN and NYT and Xeeeeeeeeeeter for updates.
The information will come from a combination of your own eyes and another platform, one pure and clean.
Lord Jesus once told his followers: "Whoever has eyes, let them see. Whoever has ears, let them hear."
The blind and the deaf will be culled, and such is the nature of the trial all souls face.

SELL NVIDIA AFTER EARNINGS 350 TP Market sentiment Sell OFF
Sell Nvidia from 500 - 510
Stop Loss 550
all the way back to 450 TP - TP SELL OFF 350 FINAL
be patient until December 2023 - January 2024
CAFE CITY STUDIO
Put your Stop Loss Because thats your Insurance !!!

AAPL forming bullish falling wedge, break will lead price higherAPPLE
price is forming a bullish falling wedge pattern, if price make a bullish break of the wedge and continues to hold above the structure, I expect the price to move higher towards the next resistance..
Trade Wisely
*The content on this analysis is subject to change at any time without notice, and is provided for the sole purpose of assisting traders to make independent investment decisions.

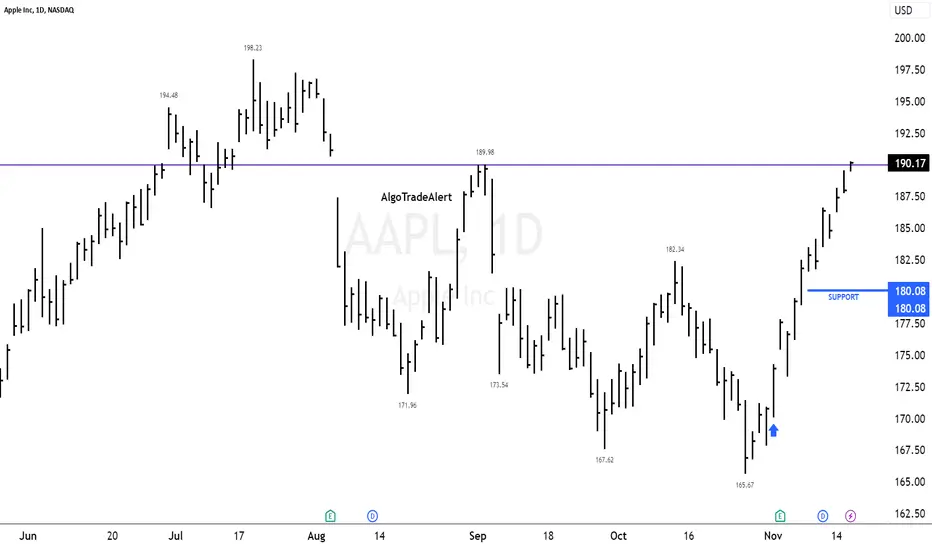
$AAPL Double Top Pierce Double Top Pierce: The term "Double Top" refers to a technical analysis chart pattern characterized by two consecutive peaks at approximately the same price level, indicating a potential bearish reversal. The term "Pierce" in this context could imply that the price has briefly moved above the second top but failed to sustain that level, reinforcing the bearish outlook of the Double Top pattern.
Taking Profits: Your decision to take some profits following this pattern suggests a strategic move to capitalize on the recent price increase. This is a common practice among traders and investors who aim to lock in gains when they suspect that the stock price might soon decline or enter a consolidation phase after a significant upswing.
The Double Top pattern, especially if it's a "Pierce," suggests that this upward trend might be reaching a potential turning point or at least entering a period of price consolidation.
This analysis points to a cautious approach, where recognizing the Double Top pattern serves as a signal to secure profits from the stock's recent gains. It’s crucial in such scenarios to closely monitor further price action and volume, as these can provide additional clues about the stock’s future direction. Additionally, staying informed about any fundamental changes in the company or broader market conditions is also important, as these can influence stock prices beyond what is indicated by technical patterns.
SPX BACK TO 4100 BY DECEMBER 2023 - JANUARY 2024 Be patient
This Trade can take 1 Month or 2 Months
SET IT AND FORGET IT !!
Do not overtrade
Do not Overleverage
PUT ONE TRADE AND WAIT !!
SOME TIMES IS HARD BUT PAYS OFF !!
CAFE CITY STUDIO 2024
