APPLE Down -4% premarket on Trump's 25% Tariff. Buy opportunity?Apple Inc. (AAPL) is down -4% on pre-market trading following a warning by U.S. President Donald Trump that the company would have to pay a 25% tariff if phones sold in the U.S. were not made within its borders.
Along with a proposed 50% Tariff on goods from the European Union starting on June 01, these news have inflicted fear again in the markets following 6 weeks of a relief rebound on trade deal talks.
So are these announcements a dip buy opportunity for Apple or round 2 of correction?
Based on the stock's long-term pattern, which is a Channel Up, the recent rebound on the 1W MA200 (orange trend-line) is technically the start of its 2nd Bullish Leg. With the Bearish Legs having similar declines (-35% and -32% respectively), we can expect the Bullish Legs to have a proportional rise as well.
On top of that, the 1W RSI rebounded on its multi-year Support, while the 1W MACD is about to form a Bullish Cross.
As a result, since the 2023 Bullish Leg that was complete on July 17 2023 almost touched the 1.236 Fibonacci extension, we expect the price to disregard the news and continue rising up to the new 1.236 Fib and target $285.00.
-------------------------------------------------------------------------------
** Please LIKE 👍, FOLLOW ✅, SHARE 🙌 and COMMENT ✍ if you enjoy this idea! Also share your ideas and charts in the comments section below! This is best way to keep it relevant, support us, keep the content here free and allow the idea to reach as many people as possible. **
-------------------------------------------------------------------------------
💸💸💸💸💸💸
👇 👇 👇 👇 👇 👇
Apple

US index futures and Apple tumble on Trump warningUS index futures and Apple shares tumbled in premarket as Trump warned the company of 25% tariffs if manufacturing of iPhones is not moved to the United States.
This is what Trump posted on social media:
"I have long ago informed Tim Cook of Apple that I expect their iPhone’s that will be sold in the United States of America will be manufactured and built in the United States, not India, or anyplace else. If that is not the case, a Tariff of at least 25% must be paid by Apple to the U.S. Thank your for your attention to this matter!"
Let's see if the recent stall in the rally will now turn into more than just a pause.
The other big concerns remains over US Treasuries and rising long term bond yields. Long-dated US Treasuries managed to claw back some of their recent losses yesterday and that helped the markets a little. But if the bond market selling resumes then yields will remain elevated and pressurize all sorts of risk assets. Without a fundamental shift in US fiscal policy, the implications of rising US borrowing costs and widening fiscal deficits means the US is on an unstable fiscal policy path, which could lead to heighten market volatility.
By Fawad Razaqzada

TSLA PRICE ACTION 21st MAY 2025This is the updated price action of Tesla. I have clearly discussed the new buying levels & have also discussed why I sold it.
If you have any questions, feel free to leave a comment or DM me.
NOTE: AVOID OPTIONS IN TESLA

APPLE I Stock Forecast and Price Target Welcome back! Let me know your thoughts in the comments!
** APPLE Analysis - Listen to video!
We recommend that you keep this pair on your watchlist and enter when the entry criteria of your strategy is met.
Please support this idea with a LIKE and COMMENT if you find it useful and Click "Follow" on our profile if you'd like these trade ideas delivered straight to your email in the future.
Thanks for your continued support!Welcome back! Let me know your thoughts in the comments!

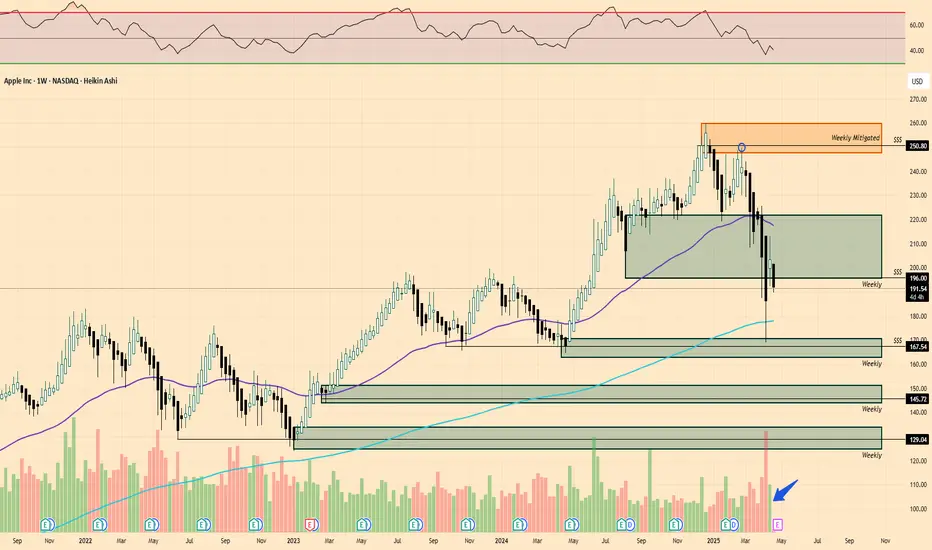
Apple respite before sell offApple bounced straight of major support at circa $170, with the SMI now also rising we could see a few weeks of short term respite before continuing down to test the major support line again. Also notice a backtest of the rising trend at around 21%.
Long term view is still bearish, don't think we've seen the yearly bottoms yet. Will be interesting to see how this plays out especially with bonds.

SPY WEEKLY 19TH-23RD MAY 2025Welcome to Spy weekly. I have tried to explain the price action & all-important levels in the best possible way but still if you have doubts then feel free to leave a comment below.
NOTE: WE ARE IN BULL RUN

Nvidia Overtakes Apple as 2nd-Biggest Company. Microsoft Next?Well, well, well — if it isn’t the GPU-maker-turned-global-tech-Goliath lapping the iPhone factory on the market cap leaderboard . Again.
Nvidia NASDAQ:NVDA has officially snatched the second-largest company title from Apple NASDAQ:AAPL , bringing its market cap north of $3.3 trillion, while Apple sat there like a vintage iPod on shuffle at $3.17 trillion — playing the same valuation tune for days.
So, what’s powering this meteoric rise? It’s not just graphics cards for gamers — that’s 2015. And it’s not graphics cards for Big Tech — that’s 2024. It’s graphics cards paid for by Middle Eastern oil money.
😎 Saudi Chips: Not the Potato Kind
Here’s the scoop: Saudi Arabia and the UAE are ready to shell out billions to become AI superpowers. And who’s their go-to guy? Nvidia, of course.
CEO Jensen Huang, who was in Riyadh this week, announced that Nvidia will supply “several hundred thousand” of its most advanced processors to Humain, a state-backed Saudi firm tasked with building AI infrastructure across the desert kingdom. That includes 18,000 units of Nvidia’s cutting-edge GB300 Grace Blackwell chips — the stuff data scientists dream about.
Nvidia calls this initiative “sovereign AI” — governments building and running their own AI on national infrastructure. Think of it as building data sandcastles, except the sand is made of petrodollars and server farms.
The geopolitical context? President Trump’s Middle East tour is clearing regulatory roadblocks, scrapping AI export restrictions drawn up under Biden, and opening the region to top-shelf American tech.
And Wall Street is paying attention.
💪 Trump Dumps Diffusion Rule, Nvidia Pumps
One of the major tailwinds for Nvidia’s latest rally came in the form of a policy reversal. The Biden-era “AI Diffusion Rule,” which aimed to restrict exports of advanced chips, has now been tossed by the Trump administration.
According to the Bureau of Industry & Security, the rule would have “undermined US innovation” and strained diplomatic relations. Translation? Nvidia was about to have its international wings clipped — but now it's free to fly across the Persian Gulf with pallets of GB300s.
The rule reversal instantly boosts Nvidia’s global reach — and opens the floodgates for billions in international chip demand. Naturally, the stock responded positively, climbing 5.4% on Monday, 5.6% on Tuesday, and 4.1% on Wednesday.
🚂 Not Just a Hype Train (But Bring Snacks Anyway)
Nvidia’s rally isn’t just FOMO (but there is some froth every now and then ).
It’s backed by earnings, expansion, and actual demand. Every major AI player — from startups to sovereign nations — needs Nvidia chips. And there’s no clear rival. AMD NASDAQ:AMD is a step behind. Intel NASDAQ:INTC is still trying to remember how to make people excited again.
But at these levels, expectations are sky-high. Even a great quarter that’s not utterly perfect could trigger some profit-taking. After all, trees don’t grow to the sky — but apparently semiconductors are expected to .
👀 Eyes on Microsoft, But Timing Is Key
So what’s next? Can Nvidia dethrone Microsoft NASDAQ:MSFT , currently valued at just about $60 billion more, and become the biggest company in the world?
Easily, especially if Huang’s tech juggernaut keeps this pace and posts another monster earnings beat. Nvidia reports on May 28, and you can bet every institutional desk, Reddit thread, and our very own TradingView community will be glued to their multi-screen setups to get those numbers.
Microsoft still sits at the top with a $3.36 trillion valuation — within striking distance. All it would take is another ~1.8% pop for Nvidia and a sleepy session for Microsoft.
But be warned: Wall Street loves a Cinderella story until the glass slipper misses earnings by two cents.
🧐 Final Thoughts: Watch Out Everyone
Apple may have Siri. But Nvidia has the chips to build a thousand Siris — and a few Skynets while we're at it.
Whether it can overtake Microsoft depends on the next earnings report (or the lead-up hype).
So the question isn’t “Will Nvidia stay #2?” It’s: How long until it’s #1 — and what could possibly stop it?
And if you’ve got it on your watchlist, circle May 28 in red marker and don’t forget to pay attention to the earnings calendar .
Because that earnings print might just rewrite the leaderboard again.
Your move : Are you riding NASDAQ:NVDA to the top? Waiting for a pullback? Or nervously watching from the sidelines with popcorn and regret? Hit the comments with your play.

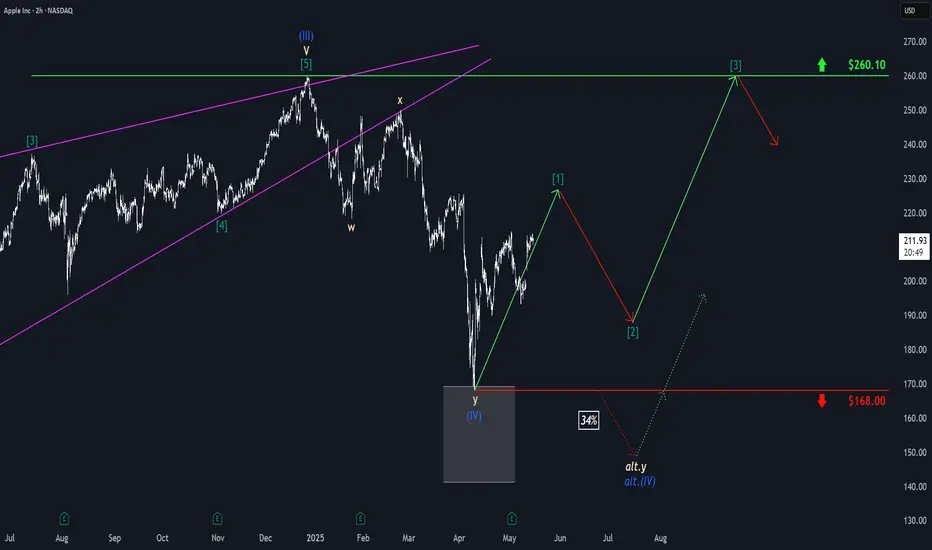
Apple: Wave [1] IntactDespite a significant setback, Apple managed to gather new momentum on the upside and continue its work on the green wave . The impulse structure remains intact, and we expect a new high imminently before the next countermovement with wave follows. The stock should not breach the support at $168 to enable wave to initiate the next upward phase. If the price does fall below the $168 mark, our 34% likely alternative scenario will allow for a new low of wave alt.(IV) in blue, though the rise would also continue after this lower low.
AAPL | Apple Stock | Three Drives Down PATTERNThe Three Drives / Three Dives Down pattern is usually short term bearish , but near term and long term bullish .
Previously, we saw a -32% correction. This time, it could be a little higher if we consider the previous neckline support:
The only way I see this paying out differently, is if the price captures the current resistance zone, and CLOSES above it:
__________________
NASDAQ:AAPL

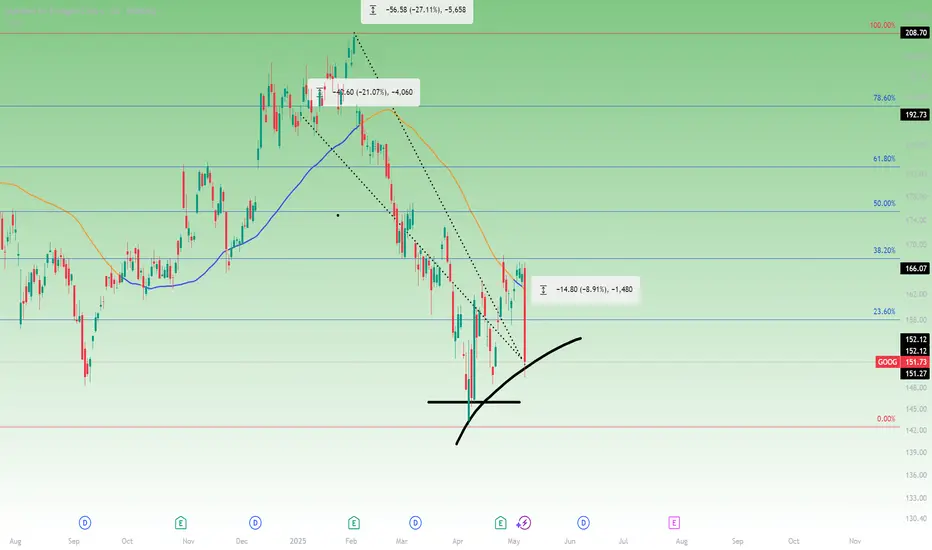
Google in trouble with Apple AI? Watch $146 next?Apple has confirmed it is actively exploring a redesigned web browser across iPhone, iPad, and Mac with a focus on AI-powered search. The potential shift away from Google as the default search provider on iOS devices, poses a direct risk to Alphabet’s search business.
Alphabet shares fell $14.11 (-8.54%) to $151.09 USD on the news, breaking below the 50-day moving average at $162.00 and the 23.6% Fibonacci retracement from the February high and April low, after finding resistance at the 38.2%.
From its February high, Alphabet is now down 27.1%, with a year-to-date loss of 21.1%.
While the stock remains above its 2025 low of $140.53, downside levels to monitor include ~$145.90.
$GOOGL Breakdown – AI Risk Is No Longer "Future Tense"🚨 BREAKING: NASDAQ:AAPL confirms they are exploring AI-powered search within Safari after a decline in browser searches for the first time ever.
💥 NASDAQ:GOOGL is down over 8% intraday, cracking long-term trendline support and decisively below the 200DMA ($173).
📉 The setup is ugly:
Insiders sold post-earnings (again).
Trendline + moving average both lost.
Volume spike and vertical price action = capitulation risk ahead.
🔻 Downside momentum could accelerate if price fails to reclaim $155 quickly.

AMD BULLISH MAY6TH 2025AMD has its earnings today & I am bullish as per the price action. I have managed my risk, and I am long irrespective of any news. I have discussed in depth analysis of AMD. If you have any questions, feel free to leave a comment below.
NOTE: I AM LONG ONLY WITH STOCKS

Apple Shares (AAPL) Drop Below $200Apple Shares (AAPL) Drop Below $200
Late last week, Apple released a quarterly report that beat analysts’ expectations:
→ Earnings per share: actual = $1.65, forecast = $1.63
→ Revenue: actual = $95.36bn, forecast = $94.5bn
However, today AAPL stock price is below the psychological $200 mark, over 7% lower than last week’s high (point E).
Why did AAPL shares fall?
According to media reports, investors were concerned about weaker-than-expected services revenue and disappointing sales in China. These factors have renewed fears that the ongoing US–China trade tensions could have a deeper impact on Apple going forward.
Bearish sentiment may also have been amplified by Warren Buffett’s decision to step down as head of Berkshire Hathaway — as we noted yesterday — since his company is one of Apple’s major shareholders.
Technical Analysis of Apple Shares (AAPL)
Key AAPL price action patterns (marked) show a sequence of lower highs and lows, forming the basis for a downward channel. Fibonacci ratios reinforce bearish characteristics in price movements:
→ The rise from B to C is approximately 50% of the decline from A to B
→ The rise from D to E is around 50% of the decline from A to D
This technical picture suggests a potential bear market, where rallies may be corrective rebounds following impulsive drops. This strengthens the scenario in which AAPL shares could continue falling within the established descending channel.
This article represents the opinion of the Companies operating under the FXOpen brand only. It is not to be construed as an offer, solicitation, or recommendation with respect to products and services provided by the Companies operating under the FXOpen brand, nor is it to be considered financial advice.

APPLE Set To Grow! BUY!
My dear friends,
Please, find my technical outlook for APPLE below:
The price is coiling around a solid key level - 205.25
Bias - Bullish
Technical Indicators: Pivot Points High anticipates a potential price reversal.
Super trend shows a clear buy, giving a perfect indicators' convergence.
Goal - 208.36
About Used Indicators:
The pivot point itself is simply the average of the high, low and closing prices from the previous trading day.
Disclosure: I am part of Trade Nation's Influencer program and receive a monthly fee for using their TradingView charts in my analysis.
———————————
WISH YOU ALL LUCK

APPL - Another pattern associated with 69I have many ideas where I talk about 69\96 indicating local and global price reversals. Here we were additionally shown 99, which means strong growth. I'm going to fixate on the imbalance overlap. See attached ideas

APPLE: Bullish Continuation is Expected! Here is Why
Our strategy, polished by years of trial and error has helped us identify what seems to be a great trading opportunity and we are here to share it with you as the time is ripe for us to buy APPLE.
Disclosure: I am part of Trade Nation's Influencer program and receive a monthly fee for using their TradingView charts in my analysis.
❤️ Please, support our work with like & comment! ❤️

AAPL Apple Options Ahead of EarningsIf you haven`t bought AAPL before the previous rally:
Now analyzing the options chain and the chart patterns of AAPL Apple prior to the earnings report this week,
I would consider purchasing the 255usd strike price Calls with
an expiration date of 2026-1-16,
for a premium of approximately $7.30.
If these options prove to be profitable prior to the earnings release, I would sell at least half of them.
Disclosure: I am part of Trade Nation's Influencer program and receive a monthly fee for using their TradingView charts in my analysis.
Nasdaq-100 Goes Back to 'PRE-PAIN' 20 000 Level. Series IIApril has gone..
Wow.. Duh..!? ..really? ... or still not!?
Briefly a month ago or so, we have examined at our wonderful @PandorraResearch Team what is 'Revenge Trading', watch our recent 'Educational' idea right here (if you missed one), to learn what sort of lessons we should know about it.
Indeed, it was a really bad story, to purchase in late March 2025 most-hyped so-known Mag Seven stock that came flagships of the recent stock market collapse.
First of all, watch how it's been below (late March 2025) 👇👇
What's happened next just in a week or two since our publications has been made?
⚒ Russell 2000 Index TVC:RUT 95% stocks were: DOWN
⚒ S&P500 Index SP:SPX 96% stocks were: DOWN
⚒ Nasdaq-100 NASDAQ:NDX as well as Dow Jones Industrial Averages DJIA indices: 97% stocks were DOWN
⚒ Magnificent Seven: ALL STOCKS WERE DOWN
Since Nasdaq-100 went back to pre-pain 20'000 Level, lets repeat some lessons.
Revenge trading is DANGEROUS AND HARMFUL pracrice where traders, after suffering a loss, attempt to immediately recoup their losses by making impulsive, emotionally-driven trades. This behavior is widely recognized as one of the major reasons traders lose significant amounts of money and often blow up their accounts.
Why Revenge Trading Is Bad
1. Emotional Decision-Making Replaces Strategy
When traders engage in revenge trading, they abandon their carefully crafted trading strategies and risk management rules. Instead, trades are made based on anger, frustration, or the desire to "get back" at the market. This emotional state clouds judgment, leading to irrational decisions such as increasing position sizes recklessly, disregarding stop-loss orders, or chasing trades without proper analysis. As a result, the likelihood of making successful trades plummets.
2. Escalating Losses and Account Blowups
The urge to recover losses quickly often leads traders to double down or over-leverage their positions, exposing a large portion of their capital to additional risk. Statistically, 80% of revenge trading ends disastrously, with only a small fraction experiencing temporary success before ultimately facing larger losses. This cycle of chasing losses can rapidly erode trading capital, making recovery increasingly difficult.
3. Psychological Burnout and Stress
Revenge trading is mentally and emotionally exhausting. The constant cycle of loss and frantic attempts to recover can lead to stress, depression, and burnout. This further impairs decision-making, creating a vicious cycle of poor performance and deteriorating mental health.
4. Long-Term Damage to Trading Habits
Repeatedly succumbing to revenge trading ingrains bad habits, making it difficult for traders to maintain discipline and consistency in the long run. This lack of consistency undermines the potential for sustainable profitability and can end trading careers prematurely.
Recent Real-World Examples
Recent years have seen numerous cautionary tales illustrating the dangers of revenge trading (all links are from r/wallstreetbets subreddit for learing/ educational purposes only):
$40,000 Lost on NVDA Options (2024). A trader repeatedly doubled down on Nvidia (NVDA) put options during its price rally in mid-2024. Despite initial small wins, the trader, driven by the urge to recover losses, continued to increase his position size, ultimately losing over $40,000.
$26,000 Lost in 20 Minutes on SPX. A Reddit user reported losing $26,000 in about 20 minutes trading the S&P 500 index (SPX) after prices dropped sharply. The loss was the result of impulsive trades made in an attempt to quickly recover from earlier setbacks.
From $27,000 to $0 in Three Days. Another trader turned $500 into $27,000 in just a few days, only to lose it all within 48 hours after a market reversal. Instead of taking profits or stepping back, the trader kept chasing losses with increasingly risky trades, ending up with nothing.
$100,000 Loss on a Yen Carry Trade. A trader, influenced by news of geopolitical tensions, made a large leveraged bet on the yen. After an initial loss, he refused to cut his losses and doubled down, ultimately losing $100,000 instead of accepting a smaller $30,000 hit.
More juicy stories are to be collected...
These stories are not isolated incidents. They are echoed across trading forums and social media, serving as stark warnings of how quickly revenge trading can destroy even substantial gains.
Conclusion
Revenge trading is DANGEROUS AND HARMFUL because it replaces rational, strategic decision-making with emotional reactions, leading to escalating financial losses, psychological distress, and long-term damage to trading discipline. The real-world examples from the past year underscore that no trader-regardless of experience-is immune to its risks. The best defense is to recognize the urge, step away, and return only with a clear, objective mindset and a disciplined strategy.
--
Best wishes,
@PandorraResearch Team 😎

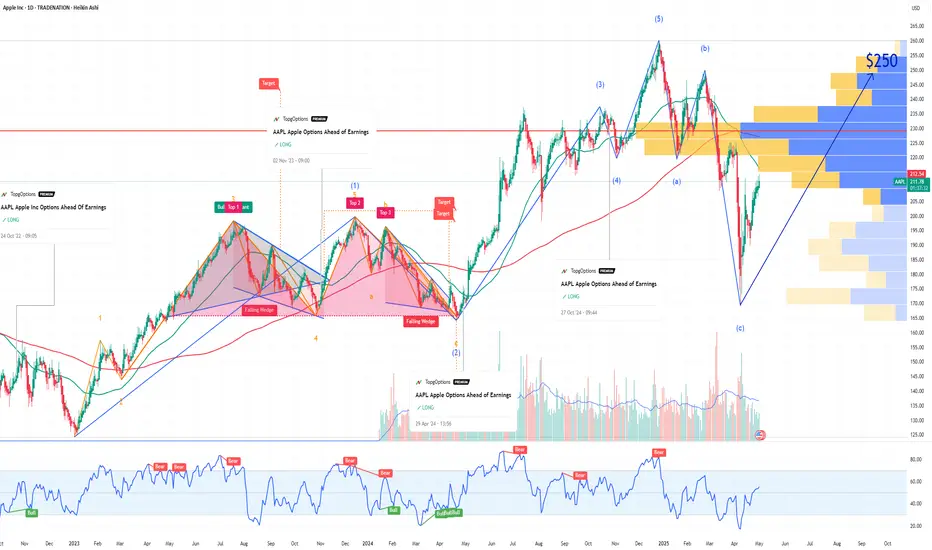
Apple Inc. Stock Price Target Lowered Amid Tariff ConcernsApple Inc. (NASDAQ: AAPL) is trading at $208.37 after climbing 4.32% in the latest session. Despite the recent bounce, analysts have made downward adjustments to its price outlook ahead of the company’s March 2025 quarterly earnings report. UBS analyst David Vogt has revised Apple’s price target from $236 to $210 while maintaining a ‘Neutral’ rating. This adjustment comes in response to anticipated U.S. tariffs and potential pressure on production costs.
UBS reported that Apple expedited about one million iPhone shipments during the quarter. This strategy contributed to a modest increase in iPhone revenue, despite flat demand. With the U.S. dollar weakening against major currencies, UBS also raised its March quarter revenue estimate to $95.5 billion, up from $93.5 billion. EPS forecasts were adjusted accordingly.
On the other hand, MoffettNathanson Research downgraded its price target from $184 to $141 and reiterated a “Sell” rating. The firm highlighted risks related to trade tensions, increasing manufacturing costs due to tariffs, and slowing innovation. According to their analysis, Apple faces difficult choices—either absorb high tariff costs or reconfigure supply chains at a premium. Both options are expected to affect profitability.
Technical Analysis
The stock has rebounded from a key support level near $170, which aligns with a long-term demand zone visible on the 3-day chart. It has broken above the 200-day moving average of $192.82 and now trades slightly below the 100-day moving average of $213.53 and 50-day MA at $229.03.
Momentum indicators suggest a possible continuation. The RSI stands at 45.67, showing recovering strength. If AAPL holds above $200, it may retest the $197 support level before targeting $260.10. A rejection could lead to a retest of the $170 support area.

Apple - Wait for the bite!The price looks like a lion in a cage, breaking above or below the wedge will lead to significant changes. For now, sit back and relax, Trump will show the path!

$AAPL | $200 showed lifeThese are my levels I am most concerned with for NASDAQ:AAPL
Last week, $200 level showed life and buyers stepped in but that doesn't mean we are out of the woods and price currently is in semi "no man's land", kind of just hanging around the demand area.
One bright point is bullish price volume last week as well.
I would wait to see how this week turns out before putting money back into the iPhone company.
Daily Price Action: Apple APPL Thursday 4/17/2025In this video, we will be looking into the potential price action of AAPL.

Apple ($AAPL): Shares Jump After Tariff Exemption on ElectronicsApple Inc. (AAPL) experienced a significant rally on Monday, climbing as high as $212.94 before settling around $206.05 as of writing, reflecting a 4.5% intraday gain. The spike followed the U.S. government's decision over the weekend to exclude smartphones and other electronics from the latest round of tariffs on Chinese imports. This move provided relief for tech companies like Apple that rely on global supply chains.
As of 3:38 PM EDT, Apple shares Volume reached 258.63 million shares, indicating heightened investor interest. The favorable news also triggered substantial profits for derivatives traders. One bullish options trade worth $5 million, opened on Friday, was reportedly valued at around $14 million by Monday morning—a 180% gain as per Reuters.
According to Capital Market Laboratories CEO Ophir Gottlieb, the trade may have been a calculated bet anticipating favorable policy moves affecting Apple or broader China-related tariffs.
Technical Analysis
The 2-day chart shows a strong bullish reaction from a major support zone near $172, where the price rebounded sharply following the news. The current price at $206 is trading slightly below key moving averages, including the 50-day at $231.81, 100-day MA at $228.36, and 200-day MA at $205.91
Price action also broke above a previous resistance area of $196, turning that level into new support. If momentum holds, Apple could aim for a move toward the $260.10 recent high. However, technical structure suggests a possible pullback before further upside continuation. Overall, the rebound and volume surge indicate strong buyer interest in the wake of the tariff announcement.
