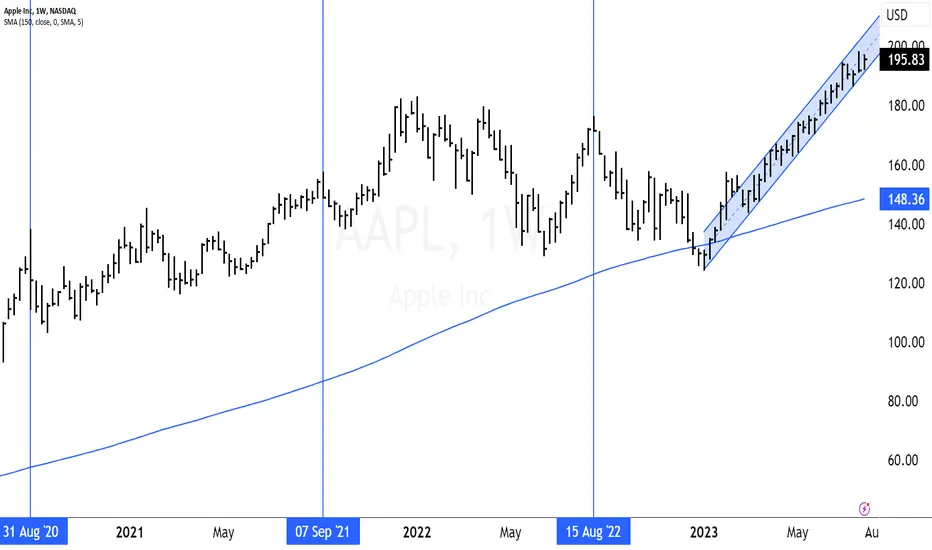
$AAPL- WEEKLY CHART LOOKS READY BOOM$AAPL is going to do some serious moves in the coming weeks. Class A Hidden Bullish Divergence on the oscillators with positive momentum starting to build with the follow through price action IE MACD Divergence.
Targets are $200, as this would be typical psycological resistance and $210.
As soon as we can crack above point B and claim new support, we are off to the races and will see upward price action.
Retraced to the common .382 - .500 ranges, as this is tpyical when the market/price is in a uptrend.
Very clear, cut and dry TA if you ask me. Tech Stocks/Crypto Market is awaking from the long and exhausting piss poor peformance and wants to run upward again.
Buy before the FOMO nerds get in ;)
Apple

AAPL: Breakout of EMA-50 to the downside since January 23, 2023.The break of the EMA-50 to the downside represents a major correction as since January 23, 2023, the EMA-50 has been dynamic support where the price touched it on March 1, 2023, and then came very close on March 13, 2023.
After these dates, AAPL remained distant from EMA-50 until today, when it made the downward breakout making a gap and closing at 181.99 below EMA-50.
On the other hand, the relevant FIBO levels are 38% at (169.25) and the most important 50% at 160.78 coinciding with SMA-200.

CON ED 95 TAKE PROFITS AND RUN !!!Con Edison Earnings Today After the Close , Summer is Here !!!
95 TP do not be Greedy
TAKE PROFITS AND RUN
Market is very Weird these Times !!! NYSE:ED

APPLE - An upcoming opportunity Investor Goggles on Today
Apple Inc NASDAQ:AAPL
MACD Cross Historic Performance
Sept 2006 – 16 months – 213%
July 2009 – 18 months – 149%
Mar 2014 – 16 months – 83%
Dec 2016 – 18 months – 78%
Aug 2019 – 18 months – 189%
Jun 2023 – 18 months – 100% ?
Average return of the 5 past MACD crosses above is 142%. We have projected a modest 100% increase over the next 18 months. That’s IF we get the cross in June 2023. Worth noting we are about 6% away from the ATH of $182. A weekly close above this level would be ideal in combined with the MACD cross confirmation. Failing these you would wait. These could occur at the same time. Stop would be placed under the ATH. Keep in mind that a MACD cross is a lagging indicator so we try and anticipate the cross scenario.
Given the history of price in this long term parallel channel since June 2005, an incredibly idyllic scenario would be a revisit of the bottom of the channel which would coincide with a revisit of the 50 month smooth moving average(SMA) in purple. If we ever revisited the 50 Month SMA or 200 week SMA I believe this would be a major opportunity, given this has only occurred 4 times in almost 20 years.

APPLE Bearish Breakout! Sell!
Hello,Traders!
APPLE was trading in an
Uptrend but now we are
Seeing a bearish breakout
So I will be expecting
A move down
Sell!
Like, comment and subscribe to help us grow!
Check out other forecasts below too!

Meta - To Long, Or To Short?I have to say that Meta is one of the hardest charts that exist to read right now, mostly because for 9 straight months, an unprecedented feat in the history of Facebook, it has gone up in a straight line, and bigly.
You only see it clearly on the monthly:
And yet the problem with the bull thesis for a new all time high is the '22 bear raid took out all the sell side all of the way back to 2016.
Although you can have, and speculators and hodlers have been fortunate enough to have had, a significant retrace afterwards, stocks taking long term lows is usually kind of like when a person turns 50 and starts urinating blood.
It means something is wrong with an organ and the time they have left to live is not so long and not so bright.
Even the weekly is insanely one-directional
This stock will have attention tomorrow as post-market earnings have produced another $20 gain, but notably, as of time of writing, have brought the price only to $319, still underneath the July high.
Geopolitical risks abound in the markets right now. Much is happening with Mainland China and the International Rules Based Order. You can consult my previous calls, which are below, for my thoughts on the situation.
But the Cliff's Notes of it is that the 24-year persecution and organ harvesting genocide of Falun Gong by the Jiang Zemin faction and the CCP may soon be made public worldwide if President Xi weaponizes those sins to protect China, its 5,000-year-old culture, and himself from the IRBO intending a Maidan Revolution-style coup to replace him with someone from Taiwan that happens to be a fine lapdog to the global regime's interests.
What is the bull thesis for Meta? Facebook is something of a panopticon data collection system and advertising network rolled into the guise of a social media platform where people voluntarily disclose their location, interests, likes, connections, and spend time interacting with friends and family.
Meta's rebrand is to force the world into something of a Nintendo 64-level version of Second Life, where you're supposed to literally sit in your cube eating the cricket crackers under a bunch of blankets with the furnace/AC off with the VR headset strapped to your face while you do data entry all day.
It's really the kind of dystopian thing the Chinese Communist Party really likes, because it means you can be submissive and agreeable slaves that don't threaten its stability and still produce work.
If mankind's future is truly to return to tradition (it is), what place does Meta have in it?
Meta has very little place in the future, and that's a fundamental problem, really, for everything that revolves around people living chained to computers and phones.
A really notable thing is that the Chinese Government, especially under Xi Jinping since he took power in 2013, has not allowed Meta/Facebook to set up shop inside Mainland China.
The world's most notorious totalitarian regime and the creator of social credit and censorship does not want Meta/Facebook's influence impacting their citizens.
Ain't that something. And yet, you're supposed to be bullish on this... because it's going up.
You just want something to go up so you can buy it and feel pleased when you see green, not sell, and then feel sad when you see red, red, red, and are liquidated.
This is modern humanity.
So here's the question with Meta: is it a short, or is it a long?
The truth is that with Meta, it's gone up in the kind of straight line that makes Apple blush for 9 straight months.
When something trades like this, you can never say "it's a short."
Instead, you can watch for when it does become a short.
And we're in the zone. Although the biggest gap has been filled, the monthly candles show that the bodies of the winning streak's candles are still respecting the range created by the February of 2022 doom candle that ended the Party.
On the daily, the last five days of price action, which correspond with a Nasdaq that may very well have topped but an SPX that does not seem to have topped yet, are the most bearish they have been during the entire bull run.
And so, if you want to get long on open, I can only encourage you to exercise caution. You may really have upside as high as $343. But you may also have upside no higher than $325.
It may also gap up on market open and then sell off, and that kind of a sell off at this kind of a time may mean you are trapped.
To confirm a bull thesis, $343 needs to be broken and maintained
To confirm a bear thesis, the first thing we need to see after the earnings manipulation is for the $288.30 double bottom to be broken.
From there, if $258.88 is broken, the trend is over and will have reversed, even though you may see further upside in the interim.
A break over $325 and then a rejection under $288 would be the most bearish. If that unfolds, it's no longer a dip to buy. Instead, long term puts while the VIX is so suppressed might really be really, really valuable.
And the problem for both bears and bulls is the $40 range that "confirms" whether there's forever uppy or forever doom.

Apple -> Only Two More Days Guys!Hello Traders and Investors ,
my name is Philip and today I will provide a free and educational multi-timeframe technical analysis of Apple 💪
Starting on the monthly timeframe you can see that after Apple broke out of the clear triangle formation in confluence with the bullish moving averages, Apple created a strong rally of 30% towards the upside, breaking major resistance.
The weekly timeframe looks a little bit overextended with barely and red candles during the last major push so we could certainly see a retest of the previous all time high at $180.
Apple is currently once again failing to create a new all time high at the $196 level and you can still see the very obvious key bullish trendline which is still pushing the price of Apple stock higher - now we will either see a bullish breakout or a bearish breakdown, until then no setup.
Keep in mind: Don't get caught up in short term moves and always look at the long term picture; building wealth is a marathon and not a quick sprint 📈
Thank you for watching and I will see you tomorrow!
My previous analysis of this asset:

Some Technical Areas For Tesla, Apple & AlphabetHi,
A little guide for you about Tesla, Apple, and Alphabet. Pointed out some key areas from where to take out some profits or if you are interested in some sort of stocks then a couple of scarious from where you can jump in. Not an idea post, more like an analysis but still, it should give you a little picture about them.
Tesla (TSLA)
Recently the Tesla stock has been respected by technical analysis quite nicely. Several calls have worked almost perfectly and short-term targets are reached fairly easily.
Currently, for me, the Tesla stock is in the middle of nowhere. My previous short-term target was around $300 and it has been reached, so I will wait for further price action. If the price goes above $300 then I will consider it as a breakout and I need to see a price action above that to make a decision.
The sweet spot for me is the $190-$220. If the price reaches there then I'm ready to take it but we need to see a quite good selloff - let's see.
So, if you are not in Tesla then wait for a breakout above $300 which can confirm further growth, or wait for a pullback/selloff to the mentioned lower price zone.
Apple (AAPL)
This year has been quite good for Apple, the gain from the bottom is 58%. In the first week of 2023, it bottomed and after that, very solid and consistent grind to higher levels - a new all-time high has reached.
If you are on it then short-, and mid-term investors can think about taking some profits because it has reached to the round number of $200. The round number can act as a resistance level and the price can be stuck there for a while or it can get a rejection to downwards. So, if you don't have a long-term plan with AAPL then there is a place to take out some profits.
If you don't have any Apple shares then you should wait. Firstly, how the $200 act and wait for the price action. If it gets a pullback then you can grab it from the previous highs which now start to act as support levels. These are not the strongest areas but at least you have something to stick with because to buy it from the current price can be quite a huge mistake considering short-term investment.
So, if you see a pullback then be ready to act around 170 to 180 dollars, and the strongest price zone is around ~$150.
Alphabet (GOOG)
Technically the last weekly candle close was a small breakout. $126.5 has been a minor horizontal price level. This level has been a short-term support level and a couple of months ago it acted, and stopped the price, as a resistance. Now, we have this level "smashed" with quite a solid weekly candle and if you are interested then technically you have a light-green light to take it during the retest of ~$126.
Stay cautious after you have seen a monthly or weekly close below this level.
Regards,
Vaido

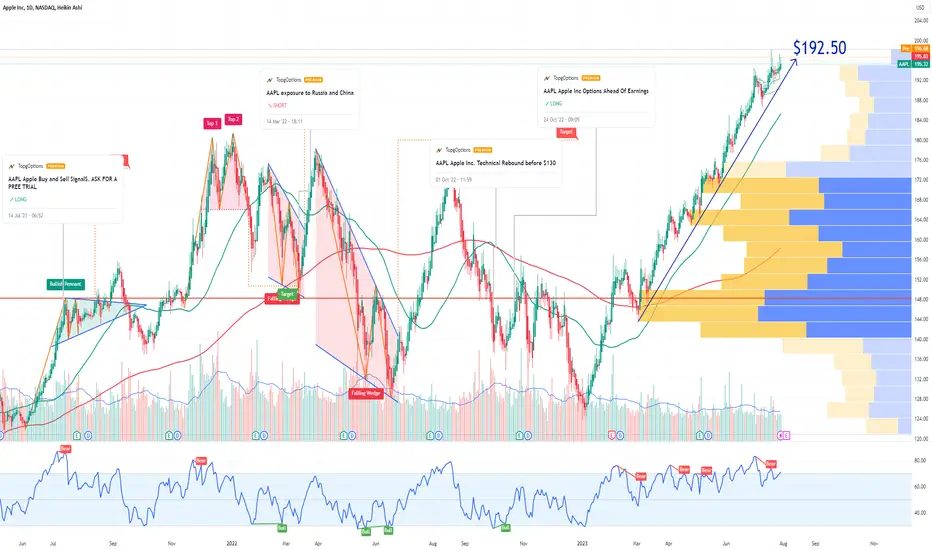
AAPL Apple Options Ahead of EarningsIf you haven`t bought AAPL here:
or shorted its exposure to China:
Then entered the Technical rebound:
Now analyzing the options chain and the chart patterns of AAPL Apple prior to the earnings report this week,
I would consider purchasing the $192.50 strike price Calls with
an expiration date of 2023-8-11,
for a premium of approximately $6.05.
If these options prove to be profitable prior to the earnings release, I would sell at least half of them.
Looking forward to read your opinion about it.
Apple's Earnings: Should You Take Some Profits Off The Table?Apple's Earnings: Should You Take Some Profits Off The Table? Apple stock has been on a roll lately, up 50% heading into earnings. However, given that earning date is just around the corner on August 3, and historically, Apple stock tends to sell off in the months of August and September, it's time to consider the wisest course of action. Many investors are pondering whether to take some profits off the table, especially considering that the company's revenue, net income, and net profit margin have all been declining in recent quarters. As we rationalize why or why not to sell Apple's shares, let's review everything you need to know about Apple's earnings and stock performance.
1984 Scramble. up or down?
The short-term market is a breakthrough of the previous downward trend. From the position of 1900, it went up to the 1984 line for a month. More often bearish and weak. The market is trending upwards. So now comes the 1984 controversy. Will the later trend continue to go up or down?
I personally think that gold will hover around the 1984 line in the short term. However, geopolitics and the US economic situation have formed a certain support below. So in the short term, I personally think that buying will still be the main focus.
The detailed trading signals are subject to the actual situation, and I will tell you in the old place.

Microsoft - Is The Top Already In?One of the key points to Microsoft is it is, in essence, a U.S. state-backed corporation, and one that is trading at more than $2.5 trillion market cap at present.
You're looking at a company that just set a new all time high while the overall market is not healthy and the macroeconomic fundamentals are actually bearish.
And so, we have to seriously ask ourselves if it's time to short God the top.
Microsoft's price action on the monthly is curious.
The price action is healthy and natural all the way from where it bounces to the top, and only becomes curiously strange when it gets to the top.
Why does a stock that bounces at the right place and forms a fully proper reversal pattern, which we see on the weekly:
Only sweep the All Time High?
Why doesn't it raid the ATH and run bigly larger like NVDIA did?
Well, the answer is actually quite clear when you overlay NVDA to MSFT:
In essence, NVDA at $480-450 is MSFT at $350. The difference in price action you see today is because NVDA was relatively weaker in the past, meaning MSFT was inordinately strong in the past.
Anything that reaches an extreme will reverse. If it reaches the extreme twice, it will reverse hard twice.
The geopolitical situation in the world is not healthy. There is a ton of sabre rattling between NATO and the Nation of China at the moment.
The western propaganda machine wants you to believe that Xi Jinping intends to invade Taiwan because he's very evil very super Mao Zedong++, but in reality it's more like the "International Rules Based Order" wants to use the fact that the Chinese Communist Party is rotten and unforgivable as a handle to depose Xi and have Taiwan invade the Mainland under the guise of international "aide".
Why this matters to you as a trader is because you're flirting with getting gapped down hard since Beijing daytime is New York night time.
If you want to be long right now you need to be hedged long volatility, or you're risking your life.
Moreover, Xi, in order to defend himself, his faction of Chinese nationalists, and China's 5,000 year history, can overthrow the CCP in a Gorbachev-style coup overnight, weaponizing the 24-year-long persecution and genocide of Falun Dafa by the faction belonging to former Chairman Jiang Zemin (it died this year).
The significance is major to traders because your beloved governments, banks, and corporations have stained their hands crimson flirting with the Jiang faction toadies in Shanghai (Babylon) in order to get all the benefits they desire.
Google the Neil Heywood story if you want to see a classic example of a British billionaire getting gibbed by the greatest evil of all time.
Much to do before the call's key points.
Before we continue, I examine the price action I expect to manifest in SPY (SPX Futures ETF) for the remainder of the month, which can serve as something of a compass for what lies ahead:
SPY - A Dip Is Coming. Maybe Buy It?
Back to MSFT:
This is a very hard setup to trade
Because the June high may have been a hard top, double and triple top or not (See TSLA July-September '22)
Lower lows lower highs indicates the dip is hard to buy
But the short may only take us to the $320 range.
Sweeping $300 is the key to a bullish continuation above the highs
Maintaining ~$280 is the key to continuing upwards at all.
Microsoft has a really notable catalyst in that its earnings are on July 25 postmarket, which means price action will manifest the morning of July 26, which just so happens to be when the next FOMC meeting is.
After July FOMC the next FOMC is deferred until September 20, 9 days short of quarter end, notable because of the notorious JPM Collar, which I discuss here:
SPX/ES - An Analysis Of The 'JPM Collar'
What I expect is we see a fairly violent correction on Microsoft back to the $300s before we can see any kind of further meaningful flirtation with a run over the $350 ATH.
But the June high may have been the top for the foreseeable future, as evidenced by the relationship between NVDA and MSFT.
Be careful. The time we have left for happy and normal days is so short you can almost count it on the fingers.
When things really emerge, Nasdaq 8,500 will be the least of your concerns, really.

Netflix - I Hope You Like Catching KnivesNetflix is that $200 billion company trading at $441.44 that everyone seem to have forgot about, even though it more than doubled in a year.
Personally, I think these streaming services are a colossal waste of your time and money. What you're watching is the intellectual equivalent of a Big Mac or a bag of potato chips, and permeated with the things of socialism and atheism.
And Netflix is really quite woke and some of the content is unforgivably degenerate.
You shouldn't look at warped mirrors and shouldn't cast your eyes on ugly things, or they'll twist your heart and your soul.
When it comes to the markets-at-large, I believe we're definitely going to see a correction, rather than a new all time high, which I detail in the two calls below:
Nasdaq NQ - A Fundamental and Technical Warning Signal
SPX/ES - An Analysis Of The 'JPM Collar'
If there's to be a new all time high, let's wait and see what Q4 has in store for us.
There's a lot of geopolitical risk in the markets right now. The War between the Russian Federation and NATO via Ukraine is a big one, and a bigger one is the situation in Mainland China with Xi Jinping and the Chinese Communist Party.
More or less, I believe the globalists want to topple the Party to have their men from Taiwan go in and take control of China and depose Xi.
But I believe Xi is likely to topple the Party himself before that can happen.
Big gaps will come that day and things will be very hard because Wall Street won't be in any kind of a risk-on mood.
The 24-year persecution against Falun Dafa launched by former Chairman Jiang Zemin and the Shanghai toad faction is something Xi can weaponize to implicate the entire world.
Because to do business in Shanghai you've needed the Jiang Faction's approval. To get its approval, you've had to dirty your hands in the persecution and swear vows to the Flag of Blood.
And unfortunately, most of the world has wanted what the Party has. Read the story of British billionaire Neil Heywood, who decided to court Jiang's minion Bo Xilai.
Bo told Heywood that to prove his loyalty he had to divorce his wife. Heywood refused, and so Bo's wife poisoned him.
Heywood died in 2011.
Bo Xilai was ruined in Xi's Anti-corruption Campaign in 2013, stripped of all his assets, and sentenced to life in prison in a CCP dungeon.
Gambling with the Party is one foot in the grave and the other in prison. Live a virtuous life instead.
Moreover, they always say zoom out. Looking at Netflix on the yearly, it's hard to say you're not in the crosshairs of a savage trend reversal.
And you can see these daily bars far more clearly on the weekly chart:
There might be that fat gap above that you have your eye on, but you're dealing with a very long and very steep ramp in the first place, and this is in a stock which stayed away from a true gap between April and August of '22.
Another notable factor is that the FINRA short volume for Netflix, while still notably low, is the highest it's been in three months and posted its first green month since April and only its second of '23.
Short volume
This is quite notable in light of the fact that June was one of the best months for equities in a long time
Netflix doesn't have an ETF, except for a 3x levered ETF on the Mexico exchange. Insignificant except for it fell from 5 pesos to 5 pennies.
What's sad is even if it Netflix was to fall 50% in value the thing would still only be worth like 30 cents. % base levered ETFs will kill you.
So, here's the call.
Netflix printed a proper daily pivot in mid June (you'll have to look yourself because I can't zoom the chart in for the post) and has been flirting inside that range ever since.
If she makes a new high I suppose then it's time for more uppy and you can buy calls at the top and feel pretty good.
But if she breaks the $420 range the next area to watch is the June low, which Netflix printed on a green candle and on the first day of the month at $393
After that, things might happen and happen fast.
If bearish momentum and level breaking manifests, then where I believe it will return to is the $180 to $160 range.
For Netflix to have a chance to return above $500, it will have to hold the $162.71 bottom.
If you can catch that falling knife you'll feel pretty smart if you can hold the bag for a few months.
But if you try to go long before the bottom you'll cut your hands and cut your hands some more.

ES SPX Futures - Welcome to FOMCmageddonIn reading the title of this post, I'm sure you can tell what I want to say.
Since the new habit is to guffaw and lmao at any thesis that isn't bullish, because "we" all "know" US equities "always go up" and a new all time high is "in store," I'd like to point out the Nasdaq already shows signs of having topped.
That July 20, 2023 candle was some 2%+ in range and on absolutely no news.
And yet the SPX has not yet taken its equivalent intermediate term high.
The significance of the intermediate term highs that the Nasdaq took and the SPX is probably about to take is that they represent the March of 2022 failure swing.
Why does it matter? Because that swing and its destruction was the trumpet-backed announcement that the Coronavirus Disease 2019 stimmie QE bull run had come to an end.
And so coming back to raid it at a time when Big Jerome Powell openly told reporters at the last FOMC meeting that no rate cuts were scheduled AND that inflation would take years, not months, to come back to levels they regard as apropos, is a very dangerous situation.
The thing about tops and bottoms is that whoever calls them is always wrong, because you can only see a top or a bottom on hindsight.
In the interim, as they unfold, you can only anticipate that at a certain key price level, over a certain high or a certain low, that reversal patterns might manifest.
The geopolitical situation is very sharp. I note in a new call that oil is likely headed for a literal 3 handle this year.
Oil - A New Long Leg Down Soon Begins
And I note that the US Dollar Index is due for a rally to at least 108.
DXY - The US Petrdollar And The "Prigozhin Coup" In Russia
The cornerstone of the international chessboard is now, and always has been, Mainland China and its 5,000 year old country and culture, which has been ruined by the Chinese Communist Party over the course of its century of insanity.
What's going on in the equities market is heavily wedded to the "War With Taiwan" narrative being espoused by the propaganda machine, which I discuss in my call on Taiwan Semiconductor TSM, a company that I believe is a significant long hedge during a potential upcoming downtrend.
TSM - Taiwan, Your Semiconductor Long Hedge
So as for this week's call, I would like to note that, unlike the Nasdaq, the SPX has not raided its March '22 intermediate high.
This high at 4,631 happens to coincide with the new "JP Morgan Chase Collar," where one of the SIB's big funds sold calls at 4,665.
I discuss this collar below:
SPX/ES - An Analysis Of The 'JPM Collar'
Something to understand about the big banks' business model is this:
The first thing is that when they sell calls at a certain level, there is a buyer, and that buyer might be their clients.
Their clients may have paid the bank the standard 10% fee in exchange for providing the liquidity.
The reason the client would buy calls that JPM sells at a 10% premium is because they understand that the market will be made, in exchange, for those calls to be made worth more than they paid.
Those calls were purchased at the end of June when the indexes traded circa 4,400.
Why would JPM sell the calls and get themselves underwater? Because by September 29, Q3 end, they won't be underwater anymore, for one.
For two, they're hedged long and are making money on the way up on the hedge.
So they get to make money on the hedge, the calls ultimately expire worthless, and the client is happy because they got a big bag of cheap options at 4,400 to dump on the head of retail and Cathie Wood-style funds at 4,660.
And all of this is to say that the 4,631 failure swing/pivot is very likely to be raided, and it is likely to be raided on Wednesday, FOMC day.
During Monday's trade session, we will find out a lot about the intentions of the MMs.
I believe they will only raid the 4,544 level on Monday market open, making it a buying opportunity to sell 100 points higher.
However, if ES/SPX is to dump significantly to under 4,500 again, it stands to reason that the real target is the 4,800 ATH somewhere early in August.
But I think, for a lot of reasons, this is just so less likely.
Thus, SPX is likely to raid 4,544, which is to say the 4,550 psychological level, and trade over the 4,650 psychological level before Jerome Powell starts yapping.
This FOMC is really significant because there isn't another rate hike until September, the end of Q3.
So the trade is to long 4,540, sell it allllll at 4,650, and the target is under where JPM went long on puts and has been under water all month under 4,200 heading into the end of August and middle of September.

AAPL ANALYSISAfter the filling of the gap left by the market in the bullish trend at the same time see the rejection of the price of the golden zone Fibonacci we will see a reversal towards to zone of the liquidity buyside
- Trading is probality control you risk management
Good Luck !

Apple -> Will It Hold Support?Hello Traders and Investors ,
my name is Philip and today I will provide a free and educational multi-timeframe technical analysis of Apple 💪
Starting on the monthly timeframe you can see that after Apple broke out of the clear triangle formation in confluence with the bullish moving averages, Apple created a strong rally of 30% towards the upside, breaking major resistance.
The weekly timeframe looks a little bit overextended with barely and red candles during the last major push so we could certainly see a retest of the previous all time high at $180.
I am now just waiting to see how Apple reacts at the current level considering that we are once again retesting the bullish trendline - so far market structure is still bullish but if we see a break lower, the daily timeframe looks like a correction is inevitable.
Keep in mind: Don't get caught up in short term moves and always look at the long term picture; building wealth is a marathon and not a quick sprint 📈
Thank you for watching and I will see you tomorrow!
My previous analysis of this asset:

Breaking news. Whether to follow the signal to make money.
eview last week's trend. Gold once soared to the 1987 line. The fall of the US dollar and changes in geopolitics act as support. For many friends who follow me to buy gold, they have made a lot of money. This is something to be congratulated on. But if you didn't follow the signal to buy gold but sell gold in the last week. Then the loss is heavy.
Everyone has also seen that gold has not stabilized since it went up to the 1987 line. On the contrary, because of the rebound of the dollar, it continued to fall to the 1957 line. After the shock at the end of Friday, the closing price bottomed out at the 1962 line. After the opening of the Asian market, it touched the low of 1958 again, forming a short-term double support. There is no special news news today.
From a short-term point of view, the current support is effective. Because this is the first time that gold has formed a second low support after falling from its high level last week. So in the short term, I will mainly buy gold. Of course, the actual trading situation is subject to the real-time trading signal updated by me on another channel. Never trade blindly.
1970 above is a short-term pressure level.

$APPL -Buy Opportunities - Apple Inc. ($APPL) nearing Support Trendline of its Rising Channel.
Looking for long opportunities in the short-term,
remaining positive TA speaking until the upcoming Earnings Report.
Until 3rd of August positive momentum has captured $APPL ;
(may be interreupted from Feds upcoming week Rate Hikes Decision)
SL is adjustable from here, with the nearest point being the last
Higher Low market structure,
or the previous ATH depending on your risk apetite.
Until the next one;
trade smart
TRADE SAFE
*** Note that this is not Financial Advice !
Please do your own research and consult your own Financial Advisor
before considering partaking any trading activity based solely on this Idea

$AAPL top?The chart is looking like NASDAQ:AAPL has put in a top. If it breaks the structure (blue line), I think chances are $77 gets hit on the move down.
Let's see how it plays out over the next 6 months to a year.

Apple -> Watch This Potential PatternHello Traders and Investors ,
my name is Philip and today I will provide a free and educational multi-timeframe technical analysis of Apple 💪
Starting on the monthly timeframe you can see that after Apple broke out of the clear triangle formation in confluence with the bullish moving averages, Apple created a strong rally of 30% towards the upside, breaking major resistance.
The weekly timeframe on Apple is showing some overextension towards the upside and Apple hasn't retested the 0.236 fib level yet so we could indeed see a short term pullback now.
Apple could also created a solid double top on the daily timeframe and if Apple stock also breaks below the solid uptrend line we could certainly see a short term move lower to retest the previous all-time-high at the $180 level.
Keep in mind: Don't get caught up in short term moves and always look at the long term picture; building wealth is a marathon and not a quick sprint 📈
Thank you for watching and I will see you tomorrow!
My previous analysis of this asset:

APPLE Next stop 200 after a pull-backLast time we bought APPLE (AAPL) on the short-term was on June 05 (see chart below), after a technical pull-back, and easily hit our 190 target:
The stock has maintained the Channel Up since late March with the 1D MA50 (blue trend-line) in Support since January 25. Based on the 1D RSI, which has been within a Rectangle pattern while the stock is on the Channel Up, we are about to see a technical pull-back towards the Higher Lows (bottom) trend-line and then rebound for a Higher High. That is a short-term opportunity for buyers to target $200.
-------------------------------------------------------------------------------
** Please LIKE 👍, FOLLOW ✅, SHARE 🙌 and COMMENT ✍ if you enjoy this idea! Also share your ideas and charts in the comments section below! **
-------------------------------------------------------------------------------
💸💸💸💸💸💸
👇 👇 👇 👇 👇 👇

✅APPLE WILL GO UP|LONG🚀
✅APPLE is trading in a
Rising channel and after
The price retests the
Rising support I think that
The stock will go up
LONG🚀
✅Like and subscribe to never miss a new idea!✅

NASDAQ - INMINENT SELL OFFNASDAQ - BEARISH INTERNAL CYCLE
Price it's on Panic Area (-0.382 - 0.00%) from Bearish Internal Cycle
I Suggest open SELL positions / take profits from bought stocks listed on Nasdaq at current price
- SL: ABOVE PANIC LIMIT AREA (17094.04)
- TP 1: 12849.15 - 12231.24 (50-61 %)
- TP 2: 10442.74 (100 %)
ADDITIONAL CONFIRMATIONS:
-APPLE Stock on same situation.
