Second target hit $19 - 46% Profit NASDAQ:MARA STOCK..
That was a great call, congratulations for those who entered per my published Idea..
Wait for more ..
Trader K,
Apple

APPLE Nice Strong Uptrend! Buy!
Hello,Traders!
APPLE is trading in an
Uptrend in a rising channel
And the price is retesting
The rising support so
It seems that the stock
Will keep growing!
Buy!
Like, comment and subscribe to help us grow!
Check out other forecasts below too!

SPX/ES - An Analysis Of The 'JPM Collar'Over the last two quarters, financial social media has cared a lot about the "JPM Collar," a series of very large options trades that JP Morgan uses in one of the funds it offers its clients.
The theory for speculators is that the JPM collar will be used to constrict the market within a certain range. But as for how that plays out, it's hard for a trader to anticipate, especially amid the daily chop.
The levels are on the chart and you can reference them yourself. Below is a print of monthly bars, which is easier to see since I have to compress the TradingView chart to make the bars work:
If you're not familiar options, the general idea is this:
These options blocks expire September 29
JPM will lose a lot of money if price is over 4,665 or starts to approach 4,665, especially if it happens right away
JPM will lose a lot of money if price goes under 3,550, especially if it happens right away
JPM will lose a lot of money if price goes under 4,215, especially if it happens right away
But a nuance of being long 4,215 calls is that if price is significantly over 4,215 by September, they will make a lot of money on their calls.
Geopolitical Risks
Before we begin, I'll warn you, as I do in every post, that the geopolitical situation is tense. NATO is at war with the Russian Federation inside of Ukraine and the International Rules Based Order is always talking about "de-risking, but not decoupling" from Mainland China under President Xi Jinping.
The risk for markets is, short of a situation where a tectonic/geothermal event surprises everyone and causes the crash of crashes, is that Xi gets up one night and throws away the Chinese Communist Party.
Since Beijing business hours are New York night, you'll wake up to quite the gap down that will be hard to recover from, for the Chinese Communist Party and former Chairman Jiang Zemin and its cronies are guilty of the 24-year-long persecution and genocide against Falun Dafa's 100 million practitioners.
The Call
The most most notable thing about price action is as June closed, range equilibrium between the June high and the October low is exactly 4,000.00 points.
Something else I stumbled upon when preparing for this post is that when comparing the Dow, Nasdaq, and SPX futures monthly bars, the three have completely converged.
This is the first time since the **2022 top** that this has happened.
You can see it on the weekly as well
There used to be quite the delta, which allowed for stock picking and trading. If you ask me, what three memelines coming together all at once means is that the markets reached peak overbought, and genuine "overbought" isn't something you can see with an indicator.
The daily shows this really only manifested in June.
There are some problems with more uppy, as I explain in my calls below on the VIX, which needs to go up so that whales can go back to collecting free money selling volatility:
VIX - The 72-Handle Prelude
(But note that under the current conditions being summer and we're not that bearish right now, we may only see VIX 50)
And the fact that the Nasdaq is just so far away from its trendline that going more parabolic is hard to believe.
Nasdaq NQ - A Fundamental and Technical Warning Signal
I don't normally call exact areas, but I put a white box with a dolphin because I think price is going there, and will do so fast, like, mid-August fast.
That box means 3,778~.
This means JPM will be green on out of the money calls, red on its own calls, and red on the 3,550 puts.
But JPM doesn't lose money to begin with because they're hedged and will be compensating for the drawdown in other ways, like the alpha they'll generate from going big block long in the dumps under 4,000.
The other advantage is it will trap bears who think it's finally the apocalypse they've long been awaiting for the ponzi to go to zero, and they'll buy puts and buy puts even though the iVol is insane from VIX being over 50.
Once the craziness is done, the markets will recover, and whoever sold will probably by trapped.
So, be careful out there. Wall Street's best laid plans can be blown to pieces in an hour by Heaven, for men are no better than mice in this boundless Cosmos.

Candlestick pattern: Shooting starShooting Star is a bearish candlestick reversal pattern. It signifies the end of an uptrend and the potential start of a downtrend. Its opposite is the Morning Star.
When analyzing this pattern, we should observe if the confirming candle closes within the lower third of the range formed. This condition acts as a filter when deciding whether to initiate a trade or not.
This filter makes sense because a stronger confirming candle indicates greater rejection of the uptrend continuation, thus increasing the likelihood of the pattern's success and the formation of a new downtrend.
On the other hand, if the confirming candle does not close below two-thirds of the range formed, it could indicate weakness in the direction of the trend and decrease the probability of the start of a new downtrend.

Nasdaq - The Great Bear TrapIn recent analysis on the state of the markets, I note that the notion that we're "in a bull market" is actually really dangerous, and how, if you really want to see healthy markets into the future, you don't want to see a new all time high print yet, because we're just too far over the trend:
Nasdaq NQ - A Fundamental and Technical Warning Signal
Moreover, Q2 just finished strong, and with a new quarter, comes a new deployment of the algorithms. The infamous "JPM Collar" is something I discussed in a recent post:
SPX/ES - An Analysis Of The 'JPM Collar'
Namely that I believe it forecasts a serious correction in the markets. But at the same time, it has until September to even start, really.
And it's dangerous to be long right now because the VIX is so low and we've been in a bullish impulse inside of bearish market conditions for so long, which I note below
VIX - The 72-Handle Prelude
You can see the first manifestation of this principle has begun in both the VIX, and the UVIX 2x leveraged bull ETF:
You might look at that and think "lol it gave all its gains back" but this is actually what you want to see if it's going to run a bit.
I also have open calls for Tesla, which are short term, albeit significantly, bearish.
Tesla - What To Expect Until September?
And an open call on Netflix where I actually believe it will retrace to the $170s during the next major correction.
Netflix - I Hope You Like Catching Knives
So where we're at with Nasdaq futures is that it made lower highs while the SPX made higher highs:
The divergence is noise for the short term, but if you ask me, it means that in the long term, if we see a dump, and then a bounce, that Nasdaq will actually take out the high while SPX will be a laggard.
What Friday's price action showed is that both SPX and Nasdaq have begun to dump. If you ask me, this is because before we can go higher, we must go lower.
Sells have to be matched with buys and buys have to be matched with sells, after all.
And at this point, we haven't seen any downside in the markets since March. It's too extreme.
Two important areas of note is we have the daily pivot around 14,800 and the gap around 14,500.
Both of these are places that I expect to see attempts at bounces that will not come to fruition. Because you need to give people a chance to buy the dip and then for them to get stopped out.
I believe that the reason things will dump, and they may dump violently, and fast, is to crank the VIX and have all the permabears finally see their "opportunity" emerge to get short for "the crash."
Only for markets to bounce through the end of August while everyone with money is at the sea side and VIX dies a slow death back to a 9-handle while volatility gets sold off for free money again.
By then, nobody will want to be short anymore. Everyone will have capitulated. Then the fireworks can start, and early bears will miss the move, much to their consternation.
So, I believe that Nasdaq and tech stocks give the opportunity to short through the next few weeks.
On Wednesday, we have CPI, which has not mattered in months, but may matter a lot now while the markets pretend to care about whether the Fed hikes rates again.
Then we have FOMC on July 25 and a Nasdaq 100 "rebalance" on the 24th.
A recovery through the end of July and all the way through the end of August is a very likely scenario.
Until then, I believe we will see violent and significant downside, and it finally gives an opportunity trade puts and bear ETFs until you see really significant bullish movement in price at key levels, and then look for longs.
But the next time it's time to go long, it's only a scalp.
After Q3, the remainder of 2023 and the early part of 2024 is likely to be quite dangerous.
There are more important things in life than making money. Make sure you take good care of yourselves and your family and friends.
Make sure you make up for your regrets as soon as possible, lest you find yourself with no further chances to set right what was set wrong.

AAPL - BULLISH SCENARIOKeyBanc raised its price target for Apple (NASDAQ:AAPL) to $200 from $180 and maintained an Overweight rating on the stock. However, analysts expressed neutrality in the near term despite their positive long-term outlook.
They reiterated their below-consensus revenue estimates for Apple's hardware in the third quarter of 2023. The analysts highlighted two concerns. First, Key first look data (Apple direct channel) showed strong spending in June compared to historical averages, but a quarter-on-quarter decline worse than historical averages. Second, KeyBanc expected softness in Apple's indirect channel (U.S. Carriers) due to historically low upgrade rates in the United States.
The analysts concluded by stating that for Apple to achieve favorable results, international sales must compensate for underperforming U.S. sales. Their price target is set at $200, based on a multiple of 20.8x their 2024 adjusted EBITDA estimates.
Risk Disclosure: Trading Foreign Exchange (Forex) and Contracts of Difference (CFD's) carries a high level of risk. By registering and signing up, any client affirms their understanding of their own personal accountability for all transactions performed within their account and recognizes the risks associated with trading on such markets and on such sites. Furthermore, one understands that the company carries zero influence over transactions, markets, and trading signals, therefore, cannot be held liable nor guarantee any profits or losses.

Nasdaq - Might come down to touch the demand areaNasdaq - Might come down to touch the demand area
It has a strong Weekly RBR demand zone, it will come down to touch the demand zone.

+22% in profit on $MARA , next $19+22% in profit on NASDAQ:MARA , next $19
Wonderful, great setup... I'm looking for $19 to sell my second position half.
Thanks,

APPLEAs the chart said, after touching the tough resistant zone we can see low volume around it and I don't think resistant zone be broken.
I assure you we have a tough divergence in this chart.
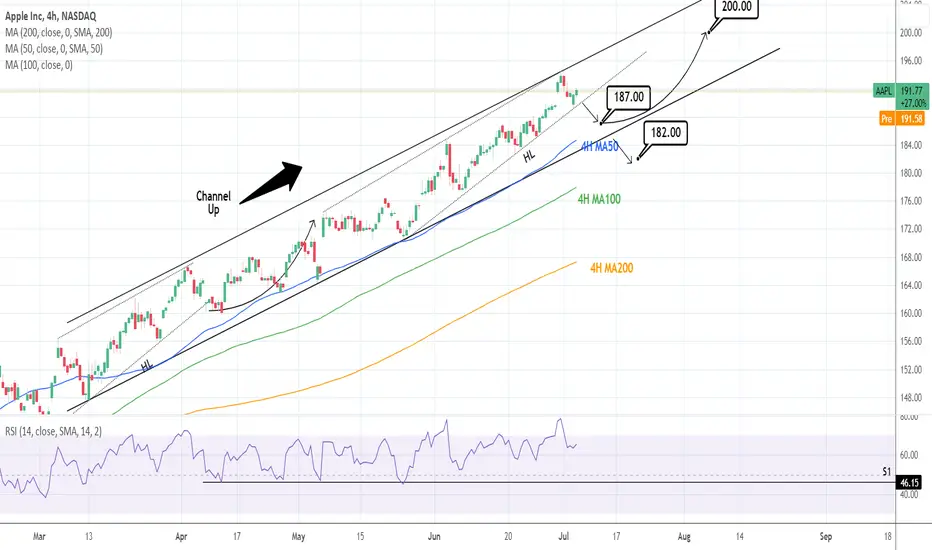
AAPLE: Buy after this minor pull back.Apple is trading inside a four month Channel Up on an almost overbought 1D time frame (RSI = 69.133, MACD = 4.100, ADX = 62.578) supported on the short term by an HL trendline. We expect a pull back near the 4H MA50, which has been the most optimal buy during this Channel Up period, ideally with the 4H RSI near its S1.
We will buy and target the upper band of the Channel (TP = 200.00). A crossing under the Channel Down would be bearish and will force us to close the buy in loss and sell instead to the 4H MA100 (TP = 182.00).
## If you like our free content follow our profile to get more daily ideas. ##
## Comments and likes are greatly appreciated. ##
Buffett's Love for Apple Shares: Discover the Secret SuccessI wanted to share an exciting story that's been making waves in the investment community and will surely bring a smile to your face. It's all about the legendary Warren Buffett and his deep affection for Apple shares. So, please grab a cup of coffee, sit back, and let's dive into the world of Apple and its incredible potential!
Warren Buffett, often called the "Oracle of Omaha," has long been recognized for his impeccable investment acumen. He has built an empire of wealth through a disciplined and patient approach to investing. And guess what? Apple Inc. has become one of his favorite long-term investment choices!
Why does Warren Buffett love his Apple shares so much, you ask? Well, let me unveil the secret. Apple is not just any ordinary company; it's a global tech powerhouse that has consistently demonstrated its ability to innovate, adapt, and dominate the market. From the revolutionary iPhone to the game-changing Apple Watch and the recent introduction of Apple Silicon, their M chips, Apple continues to redefine technology and consumer experiences.
But it doesn't stop there! Apple's financial performance is equally impressive. Apple has consistently outperformed market expectations with a strong track record of revenue growth, healthy profit margins, and a robust ecosystem of products and services. This stability, combined with their unwavering commitment to customer satisfaction, has solidified Apple's position as a trusted brand worldwide.
Now, here's where it gets even more exciting. Warren Buffett's love for Apple shares is not just a personal preference; it's a testament to the company's long-term potential. As an investor, you can follow in his footsteps and consider Apple a safe long-term investment for your portfolio.
So, my dear fellow investors, I encourage you to take a moment to consider Apple as a potential addition to your investment strategy. With its strong financials, innovative products, and unwavering customer loyalty, Apple has all the ingredients for long-term success. By investing in Apple, you can align yourself with one of the world's most respected investors and tap into this tech giant's immense growth potential.
Successful investing requires patience, research, and a keen eye for opportunities. Apple's track record and Warren Buffett's endorsement make it a compelling choice for those seeking stability and growth in their investment portfolios.
Suppose you're ready to take the next step and explore Apple as a potential investment opportunity. In that case, I encourage you to contact your financial advisor or research to evaluate its suitability for your investment goals.

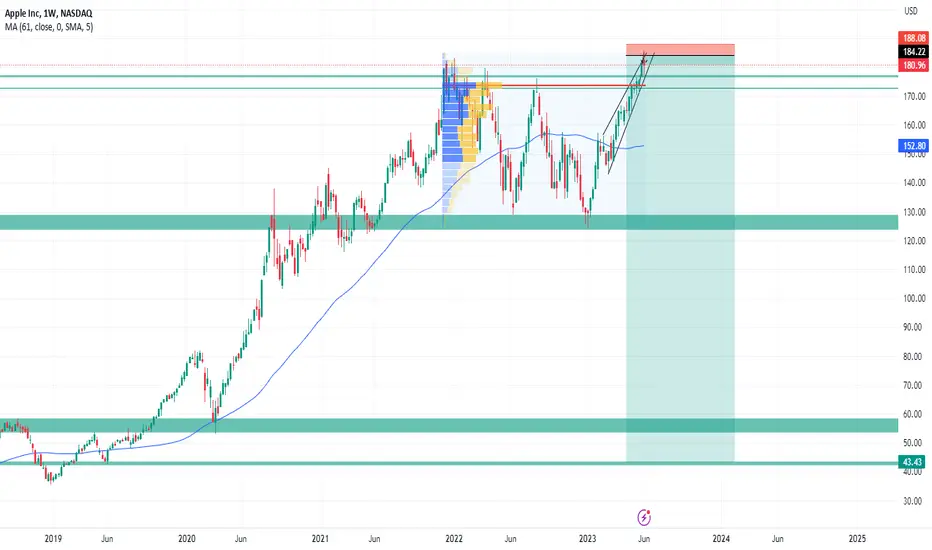
Look back to the past | At least 130% every impulse waveMonthly Chart:
Apple ( NASDAQ:AAPL ) is trading around $191 now.
When I look back to the past over 10 years from 2012 - 2022, I figured out AAPL always increased over 130% from bottom of the previous pullback. You can see that on the chart
And now, I expect NASDAQ:AAPL can go up at least 130% after down ~32.5% from previous ATH ($182.94)
If it come be true, APPL costs $286 in next 2 years and half.
Wait and see what happen
P/S: I'm a iFan

APPLE Good short term sellApple reached the top of the 4 month Channel Up and got rejected.
That is a Higher High rejection and inside this pattern, the minimum decline during such rejections has been -3.25%.
As a result this is still a good short opportunity. A -3.25% decline gives a target of 188.50.
By that time, the 4hour MA50 may come to support again.
If that's inside the RSI's Support Zone, then all the better.
Follow us, like the idea and leave a comment below!!

Will even the mighty Apple head lower?Made a double top from Nov 21 to May 22. Then fell and retested the 50 EMA before continuing back down. Stochastic starting to look oversold, but it looks to be heading towards its 200EMA. Next few months will tell.
WARNING: This is not a solicitation to trade. Make your own decisions and manage your own risk.

Will Apple Continue To Rise? 🍎Stock: Apple (AAPL)
Time Frame: Weekly Chart
Direction: long
Comment:
At the end of last week, Apple reached new all-time highs. In this analysis, I will focus on the weekly chart to show you where I believe Apple is heading. It is evident that Apple successfully broke out of a clearly visible triangle pattern and subsequently experienced a bullish rally of approximately 30 %. This surpassed all previous resistances. Previous supports have now become relatively strong supports, especially around the $170 price level. 📈
I now expect a short-term correction followed by a continuation of the uptrend. Considering the Fibonacci levels, we can see that the 0.382 level precisely corresponds to the previous significant resistance, which has now become a support. I anticipate a correction to this level ($175-180) and then further upward growth. Furthermore, the weekly timeframe indicates that Apple is not slowing down. The chart shows a near absence of red candles, meaning that buyers have complete control over the overall bull market. 💹
------------------------------------------------------------------------------------------------------------------------------------------------
Market capitalization since 2018
In 2018, Apple became the first American company to exceed a market capitalization of 1 trillion dollars. This milestone was achieved due to the success of the iPhone and other company products. Apple also leverages its ecosystem and services, such as the App Store and iCloud, which contribute to its market value. 💰
In 2023, Apple surpassed another significant milestone and became the first company with a market capitalization exceeding 3 trillion dollars. This success reflects the ongoing popularity of Apple's stocks and the trust investors have in its portfolio of products and services. Apple continues to pursue its innovative approach and expands its portfolio with new technologies and markets, helping it maintain its position as one of the world's leading technology companies. 🚀
------------------------------------------------------------------------------------------------------------------------------------------------
Remember, this contribution serves as an informative analysis and should not be construed as financial advice. Stay informed, stay connected, and happy investing! 🌟📈
------------------------------------------------------------------------------------------------------------------------------------------------
💼💰❤️ Trade like a pro, laugh all the way to the bank! Like and subscribe for more money-making !" 💼💰❤️

Apple's Dominance in Consumer Tech: Insights for Smart InvestorsSmart investors are well aware of three key aspects concerning Apple, the tech giant that consistently captures Wall Street's attention. With a market cap of $2.9 trillion, Apple stands as the world's most valuable company, dominating headlines in 2023. Notable developments include plans to shift manufacturing away from China, the introduction of a groundbreaking virtual/augmented reality (VR/AR) headset, and venturing into fintech by launching a savings account.
The start of 2023 witnessed an impressive surge of around 50% in Apple shares. This remarkable growth, coupled with the company's reputation for consistent expansion, has captivated investors, fueling anticipation as its market cap approaches the extraordinary $3 trillion mark. Given its robust long-term prospects, gaining a deeper understanding of Apple and considering investment opportunities is a prudent move for investors.
Outlined below are three crucial insights that intelligent investors possess regarding Apple.
Apple Reigns Supreme in the World of Consumer Tech
Apple has established itself as the undisputed king of consumer tech with unparalleled brand loyalty. Since the debut of the first-generation iPhone in 2007, the company has consistently achieved remarkable growth. In fiscal 2022, revenue from its smartphone segment witnessed a solid 7% year-over-year increase. Apple's ability to maintain strong consumer demand, even during challenging economic conditions, sets it apart.
In 2022, the entire tech market faced macroeconomic headwinds, leading to a slump in growth. Competitors like Samsung and Xiaomi experienced substantial declines in smartphone shipments, with drops of 19% and 24%, respectively, in the first quarter of 2023. However, during the same period, Apple's iPhone segment reported a noteworthy 2% rise in revenue, demonstrating the resilience of its business.
The widespread popularity of the iPhone has become a significant advantage for Apple when promoting its other products and services. The seamless connectivity among Apple devices has facilitated the company's dominance in market shares for tablets, smartwatches, and headphones. Additionally, its digital services such as Apple TV+, Music, Fitness+, and more have emerged as the second-highest-earning segment for the company.
Considering Apple's track record of success when venturing into new product categories, the recently unveiled Vision Pro headset, combining virtual reality (VR) and augmented reality (AR), holds promising long-term potential. Investing in this tech giant could mean investing in the future leader of the rapidly expanding $31 billion market.
Apple Quietly Embraces AI Advancements
While tech giants like Microsoft, Alphabet, and Advanced Micro Devices heavily emphasize "artificial intelligence" (AI) during their earnings calls, Apple has taken a different approach. Rather than explicitly labeling its technologies as AI, the company focuses on highlighting the new features it develops using AI models and machine learning.
This strategic move to avoid direct AI references serves Apple well, setting it apart from other companies in the industry. By sidestepping direct comparisons, Apple mitigates potential stock volatility while effectively integrating AI technology into its products.
During its Worldwide Developers Conference on June 5, Apple unveiled various AI-driven features across its product lineup. For instance, the iPhone's autocorrect functionality now utilizes a model similar to ChatGPT, learning from user text and typing patterns. Additionally, AirPods Pro can automatically disable noise cancellation when the wearer engages in conversation.
As a prominent player in the consumer tech sector, Apple's ability to manufacture devices that bring AI into the hands of the public positions it as a significant contributor to the sector's development.
Apple's Stock Valuation Slightly Pricey
Apple's stock has experienced a bullish run this year, driven in part by the anticipation of reaching a $3 trillion market cap. However, the rally seems disconnected from the company's recent financial performance, as it reported revenue declines for two consecutive quarters: a 5.5% decrease in the first quarter and a 2.5% decrease in the second.
Consequently, Apple's price-to-earnings ratio (P/E) has surged by 54% since the beginning of the year and currently stands at 33. Typically, a P/E ratio below 20 is considered favorable, implying a good value proposition. Hence, Apple's stock is slightly expensive at its current price point.
Nevertheless, it's worth noting that Apple's shares remain comparatively cheaper than many of its peers. Among the "Big Five" tech companies, only Alphabet boasts a better P/E ratio than Apple, according to the chart.
While a recent rally may have impacted the value of Apple's stock, it's important to consider the long-term perspective. Over the past five years, the company's shares have witnessed an astonishing surge of approximately 320%. This impressive growth demonstrates the potential for substantial returns on investment over an extended period.
Furthermore, Apple's expanding presence in emerging fields like AI and VR/AR positions the company for continued success. With a strategic focus on these technologies, Apple is likely to maintain its current trajectory of growth and innovation. By holding onto Apple stock for the long term, investors stand to benefit from the company's ongoing advancements and their potential impact on the market.

apple oversoldoversold on the weekly points of interest for a retest not including fiblines that also closley corelate

🍏 Apple (AAPL): unfolding the bullish triangle●● Preferred count
● NASDAQ:AAPL , 🕐TF: 2W
Fig.1
The wave count on the weekly interval has not changed. More than a year ago, we were waiting for the beginning of a sideways correction in wave ((iv)) of 3 , and, as the analysis of younger time periods shows, it has begun.
__________________________
● NASDAQ:AAPL , 🕐TF: 2D
Fig.2
At the moment, the triangle (a)-(b)-(c)-(d)-(e) is predicted as the most frequent pattern that appears in the position of the fourth wave of the impulse . Moreover, the alternation rule requires the appearance of a sideways correction.
__________________________
● NASDAQ:AAPL , 🕐TF: 12h
Fig.3
At the end of the triangle, a long trading setup will open.
__________________________
__________________________
●● Alternative count
● NASDAQ:AAPL , 🕐TF: 1W
Fig.4
Globally alternative markup does not require revision either. The only clarification is the following: development of the ending diagonal in the wave (5) of ③ is probable.
______________________________________________
📚 Elliott Wave Guide & Ellott Wave Archive ⬇️⬇️⬇️⬇️

Apple -> New All-Time-HighHello Traders and Investors ,
my name is Philip and today I will provide a free and educational multi-timeframe technical analysis of Apple 💪
Starting on the monthly timeframe you can see that after Apple broke out of the clear triangle formation in confluence with the bullish moving averages, Apple created a strong rally of 30% towards the upside, breaking major resistance.
The weekly timeframe is also showing that Apple is not slowing down at all, there are barely any red candles which means that buyers are 100% in control of the overall bullish market.
And after Apple gapped higher on Friday, the daily timeframe is certainly ready for a short term technical pullback to fill the gap, but then there is definitely a higher chance that the next move on Apple stock will be again towards the upside.
Keep in mind: Don't get caught up in short term moves and always look at the long term picture; building wealth is a marathon and not a quick sprint 📈
Thank you for watching and I will see you tomorrow!
My previous analysis of this asset:

A trader’s week ahead playbook – just roll with it Risky assets continue to climb the wall of worry, but the reality is we’ve seen conditions ripe for equity appreciation. Granted, the global central bank balance sheet is falling but the rate of change is contained, and US bank reserves are not falling as fast as feared.
Liquidity is currently not the bearish catalyst for equity drawdown that many thought it might be.
Economic data continues to frustrate those positioned portfolios for a recession - US consumer confidence, new home sales, and durable goods all come in hotter-than-expected. At the same time, US core PCE inflation was a touch softer at 4.6%, with softer core inflation prints also seen in Japan (Tokyo), Europe and Canada.
It seems good economic news is truly good news for stocks and high beta FX – case in point, on the week, we saw the market’s expectations for the peak fed funds rate (currently seen in November) increasing by 7bp to 5.4%. Amid tighter expected Fed policy, US 2yr Treasuries gained 15bp on the week (to 4.89%) and yet despite the rise in bond yields the NAS100 gained 2.2% - closing out the best first half ever, with a remarkable gain of 39%.
We’re also seeing bullish breakouts in the US500, and EU equities, with the SPA35 breaking out, while the skew is risk is that the FRA40 retests the 17 April highs.
As we see in the calendar below, there is a heavy focus in the week ahead on the labour market. Unlike recent months, as long as the growth and jobs data stay firm and highlights that a US recession is a 2024 story, and with inflation grinding to target, then the equity (and risk) bulls will continue to buy dips. The risk bulls will want a solid nonfarm payrolls report, but any goodwill will be conditional on average hourly earnings (AHE) holding below 4.3%
In FX markets, the USD has been frustrating and just when the bulls we’re hoping for a break of 103.38 resistance (in the USD index), the sellers reversed the goodwill. We remain on intervention watch in Japan, notably with the trade-weighted JPY falling 0.5% on the week, and well below levels since in Sept 2022, when the MoF bought Y2.8t. We’ve seen clear signs the PBoC has reached its tolerance level on USDCNY and is pushing back. USDCNH remains central to all USD moves.
Let’s see if the new month brings a new trend – but knowing that the NAS100 has rallied in the last 15 consecutive months of July, it feels like the pain trade is still to the upside and the odds are skewed for higher levels – an open mind will always serve us well in trading, but for now, I am happy to just roll with it.
Tactical play of the week : Long NAS100 (stop orders) above 15,220. A new month, but nothing changes – Ride the momentum, and the strong get stronger.
Rearview alpha plays:
• G10 and EM FX play of last week: Long NOKSEK (+1.8% last week), long USDRUB (+5.4%)
• Equity indices play of last week: Long SPA35 (+3.5%) – to the highest levels since Feb 2020
• Commodity plays of last week – short corn (-16%), long Cocoa +4.6% (strong uptrend)
• Equity plays for the radar – Bega Cheese (BGA.AU) – shares have fallen for 8 days in a row. Apple (eyeing $200 with a market cap over $3t).
The key event risks for the week ahead
RBA meeting (Tuesday 14:30 AEST) – It's hard to recall a time when making a call on an RBA policy decision was so finely balanced. One could make just as good a case to hike, as they could to hold. The economist community are evenly split (14 of 27 economists are calling for a pause), and Aussie rate futures are pricing a 40% chance of a hike. Given this dynamic, the RBA may lean on the path of least regret and hike. On the week I see AUDUSD trading a 0.6750 to 0.6580 range. AUDNZD is the cleanest play on the RBA meeting and relative policy divergence, and on the week, I would look to sell rallies into 1.0950/60.
US ISM manufacturing (Tuesday 00:00 AEST) – the market expects a slight improvement in the pace of decline with the consensus set at 47.2 (vs 46.9 last month). We may need a reading above 50 to get the USD fired up, although a read above 50 would certainly surprise. Good data seems to be a positive for risky assets despite the move higher in bond yields, so expect equity to rally on a stronger-than-expected print.
US weekly jobless claims (Thursday 22:30 AEST) – The economist consensus is for 245k weekly claims. Last week, we saw a strong reaction to the lower-than-expected claims print, so we know the market is looking at this data point closely. That said, we’d need a big increase/decrease from last week’s print (of 239,000) to move the dial this time around.
JOLTS job openings (Friday 00:00 AEST) – the consensus here is for job openings to fall to 9.98m (from 10.1m). A pullback below 10m openings would be further relief for risky assets. A big upside surprise may see US treasuries rally (yields lower) and USDJPY should find sellers.
US ISM services (Friday 00:00 AEST) – the market consensus is for slightly stronger growth in the US service sector at 51.3 (50.3). Again, we look for extreme reads vs consensus, but above 52.0 would really push back on the idea of a near-term economic slowdown.
US non-farm payrolls (Friday 22:30 AEST) – the marquee economic data point of the week, where the market consensus is for 225k net jobs (the economist’s range is seen between 263k and 124k). The unemployment rate is eyed to fall back to 3.6% (3.7%), with average hourly earnings seen at 4.2% YoY. The form guide suggests the risk is for a number above 200k, having beaten expectations for 14 straight NFP prints. A big upside surprise should see USDJPY rally hard and push the BoJ/MoF a step closer to JPY intervention.
Canada employment report (Friday 22:30 AEST) – the consensus is for 20k jobs to have been created, and the unemployment rate to lift a touch to 5.3%. With 13bp of hikes priced for the 12 July Bank of Canada (BoC) meeting, the outcome of the jobs report could influence that pricing and by extension the CAD. There has clear indecision on the USDCAD daily of late, subsequently, I would look to buy/sell a break of 1.3285 or 1.3116.
Mexico CPI (Fri 22:00 AEST) – those that sit in the camp that Banxico cut rates in Nov/Dec will be closely watching the CPI print. The market expects a further dip in headline inflation to 5.07% and core inflation to 6.87% (from 7.39%). Carry traders are still drawn to the MXN and happy to jump on any weakness, subsequently, USDMXN seems likely to test the recent lows of 17.0227.
Central bank speakers
ECB – Villeroy, Guindos, Lagarde (Sat 02:45 AEST)
BoE – Catherine Mann (Sat 00:30 AEST), Bailey (Sunday 17:30 AEST)
US – FOMC minutes (Thurs 04:00 AEST), Williams and Logan

We should wait a pullback in the SP500 to go bullish.Last week the price confirmed an bullish trend that would take the asset to the highs of the year around 4500 points.

😀APPLE SAYS, 'HELLO, INDIA', as First India Stores Are LaunchedHello once again TradingViewers, and Welcome Aboard 💖
"The stars are aligned"
✨That is what tech pundits and insiders like to say on Apple’s first retail stores in India which will open in Mumbai and Delhi earlier in April, 2023, a move that would get the Cupertino-based company closer to the market with one of the youngest populations in the world.
✨As India’s economy is expected to have solid growth, with its 1.4 billion population, combined with the market’s increasing appetite for high-end smartphones, Apple is seeking to thrive in a market that offers many untapped opportunities for brands like it.
Apple has launched its first stores in India in Mumbai and Delhi.
✨ The Mumbai store will cover well over 22,000 square feet inside the Jio World Drive Mall, an upscale mall owned by India’s richest man Mukesh Ambani.
✨The retail outlet is a beautiful one, featuring a triangular handcrafted timber ceiling that extends beyond the glass façade to the underside of the exterior canopy.
✨ According to Apple, each tile is made from 408 pieces of timber, forming 31 modules per tile with a total of 1,000 tiles that make up the ceiling.
✨ In fact, there are over 450,000 individual timber elements, all of which were assembled in Delhi.
The Store
✨The flagship store, just like Apple’s other retail stores in key locations including Dubai and London, will be a cross between a retail store and an education centre, which Apple calls a "Town Square".
✨Just as with its other flagship locations, Apple’s stores in India will include the new Genius Grove, which is essentially a redesigned Genius Bar, as well as a new in-store experience called "Today at Apple".
✨Apple will also begin offering educational workshops and events, including sessions for photography, music, gaming, and app development.
✨Apple is known for maintaining a tight grip on the sales and distribution of its products. The company operates over 500 directly run stores globally. Until now, consumers in India had to buy iPhones, iPads, and Macs through resellers, online, or when on a trip abroad.
Things to consider
✨ Gaining a foothold in India gives brands like Apple access to a broader customer base.
✨ 65 per cent of Indians are under 35 years old.
✨ Technically, Apple stocks stay firmly above 5-years SMA, as well as above major Bullish multi-year trend
✨ Apple stocks are 30 per cent YTD, and seems are ready for further price action, as key breakout of Head and Shoulders Chart Pattern is happening right now.

Celebrating Apple's Historic Milestone: Market Cap Hits $3 Trill
Apple Inc. has achieved an extraordinary milestone - our market capitalization has soared to an unprecedented $3 trillion! 🎉🍏
As you may know, Apple's journey to success has been nothing short of remarkable. From the launch of the iconic iPhone that revolutionized the smartphone industry to the introduction of groundbreaking services like Apple Music, Apple Pay, and Apple Fitness+, they have consistently pushed the boundaries of what technology can do, enriching the lives of millions worldwide.
This significant milestone highlights Apple's strength and presents a remarkable opportunity to consider further investing in Apple stock.
Here's why we believe Apple continues to be an excellent investment opportunity:
1. Continued Innovation: Apple's commitment to innovation remains at the core of its DNA. With upcoming products and services in the pipeline, they are poised to redefine numerous industries and create new growth opportunities.
2. Strong Financial Performance: Apple has a consistent track record of delivering strong financial results and a robust balance sheet provides a solid foundation for long-term growth and stability.
3. Expanding Ecosystem: Apple's ecosystem, encompassing hardware, software, and services, creates a seamless user experience that fosters customer loyalty and drives revenue across various verticals.
Consulting with your financial advisor to evaluate your investment strategy and make informed decisions is recommended as always.
