APPLE: Long Trade with Entry/SL/TP
APPLE
- Classic bullish pattern
- Our team expects retracement
SUGGESTED TRADE:
Swing Trade
Buy APPLE
Entry - 198.05
Stop - 191.79
Take - 216.53
Our Risk - 1%
Start protection of your profits from lower levels
Disclosure: I am part of Trade Nation's Influencer program and receive a monthly fee for using their TradingView charts in my analysis.
❤️ Please, support our work with like & comment! ❤️
Apple

$AAPL This is going to burst... $220 target.NASDAQ:AAPL : Expecting a move to $210 easy off the $200 zone then to the target of $220. Lots of testing in that area. I think $210 is a clear "gimme." Not even close to overbought, with the volatility this can ramp up. Technically look great to me. Push up to 200EMA/SMA located above $220 zone ($221 and $228).
wsl.

APPLE On The Rise! BUY!
My dear friends,
Please, find my technical outlook for APPLE below:
The instrument tests an important psychological level 198.05
Bias - Bullish
Technical Indicators: Supper Trend gives a precise Bullish signal, while Pivot Point HL predicts price changes and potential reversals in the market.
Target - 214.26
Recommended Stop Loss - 187.76
About Used Indicators:
Super-trend indicator is more useful in trending markets where there are clear uptrends and downtrends in price.
Disclosure: I am part of Trade Nation's Influencer program and receive a monthly fee for using their TradingView charts in my analysis.
———————————
WISH YOU ALL LUCK

Apple gap fill potential - Grok Ai sees option activity Grok ai analyzed the option chain for me:
Call Volume Strike Price Put Volume
---------------------------------------------------------------------------------------
* 155.00 *
* 160.00 *
* 165.00 ****
* 170.00 ******
* 175.00 *****
** 180.00 *******
* 185.00 ****
* 190.00 *****
***** 195.00 ***
********* 200.00 ***
****** 205.00 *
********* 210.00 *
***** 215.00 *
*********** 220.00 *
****** 225.00 *
******************** 230.00 *
** 235.00 *
*** 240.00 ***
* 245.00 *
***** 250.00 *
Ai found lots of in interest upward call strikes.
Gap, on the chart may be the thesis.
Get apple right, and youll understand qqq , spy, dia, its so big.
Fundamentally, Im not a long term fan of apple, but cant ignore the mag seven large caps giants.

AAPL LTF Wave count ( 40 years!)
My long term wave count for apple completes. It has got a mind-blowing and exponential growth over the 40 years and has it come to THE end? Elliot waves can't tell really because wave analysis can always yield multiple scenarios based on waves and sub-wave counts, that's why Elliot wave is an amazing tool regardless you agree or not.
I always prefer not use log chart when wave counting because it will distort the trend line which is important for wave analysis.
My conclusion: APPL has either finished its long-term ascending wave or it still has two more huge waves up till a few years later.

Apple, Will we see 150$ ???Hello traders, Hope you're doing great. What are your thoughts about
AAPL ?
Our last analysis went exactly as we predicted and hit our target; But what's the next target ?
For upcoming weeks, I expect an upward correction at first and after that I expect another SELL OFF situation in the market that causes a huge drop in stock market, my first Target is 157$.
This post will be Updated.
Trade Safe and have a great week.

SPY PRICE ACTION 10TH APRIL2025Spy further price action is here. I have discussed all the potential buying levels and do not go long at current price as we are into a supply zone.
Feel free to leave a comment
NOTE:WAIT AS WE ARE INTO A SUPPLY

US-China Rift: India's Golden Hour?Heightened trade tensions between the United States and China, characterized by substantial US tariffs on Chinese goods, inadvertently create a favorable environment for India. The significant difference in tariff rates—considerably lower for Indian imports than Chinese ones—positions India as an attractive alternative manufacturing base for corporations seeking to mitigate costs and geopolitical risks when supplying the US market. This tariff advantage presents a unique strategic opening for the Indian economy.
Evidence of this shift is already apparent, with major players like Apple reportedly exploring increased iPhone imports from India and even accelerating shipments ahead of tariff deadlines. This trend extends beyond Apple, as other global electronics manufacturers, including Samsung and potentially even some Chinese firms, evaluate shifting production or export routes through India. Such moves stand to significantly bolster India's "Make in India" initiative and enhance its role within global electronics value chains.
The potential influx of manufacturing activity, investment, and exports translates into substantial tailwinds for India's benchmark Nifty 50 index. Increased economic growth, higher corporate earnings for constituent companies (especially in manufacturing and logistics), greater foreign investment, and positive market sentiment are all likely outcomes. However, realizing this potential requires India to address persistent challenges related to infrastructure, policy stability, and ease of doing business, while also navigating competition from other low-tariff nations and seeking favorable terms in ongoing trade negotiations with the US.

Microsoft Regains Top Spot as Most Valuable Company Microsoft Corp. (NASDAQ: NASDAQ:MSFT ) has reclaimed its place as the world’s most valuable public company. The tech giant now holds a market capitalization of $2.64 trillion, surpassing Apple Inc. (NASDAQ: NASDAQ:AAPL ), which fell to $2.59 trillion.
Apple’s sharp decline followed a major 23% sell-off over four days. This came after President Trump announced sweeping new tariffs. These tariffs hit countries like China, India, Vietnam, and Brazil. Apple’s heavy reliance on these regions for manufacturing intensified investor concerns.
Meanwhile, Microsoft appears less exposed to tariff risks. Analysts say the company remains a stable large-cap stock during ongoing market volatility. Microsoft previously held the top spot briefly last year but was overtaken by Apple and Nvidia (NASDAQ: NASDAQ:NVDA ), now ranked third at $2.35 trillion.
Technical Analysis
Microsoft’s stock is trading at $383.15, up 8.06%, with a high of $387.07 so far today. The price rebounded sharply from the support level near $345. This zone had previously acted as resistance in late 2021 and early 2022. It now serves as strong support. The volume spike confirms buyer interest at this level.
The projected path shows a potential bounce toward $468, the recent high. If the trend holds, Microsoft may attempt a new all-time high.

APPLE Best buy opportunity of the last 6 years.Back in August 02 2024 (see chart below), we introduced this model on Apple Inc. (AAPL) that had high probabilities of success at predicting Cycle peaks:
We may have not hit $280 but $260 is close enough especially if you are a long-term investor that values buying low and selling high.
Now that the price has corrected by -35% and just hit the 1M MA50 (blue trend-line) for the first time in almost 10 years (since July 2016), it is time to revisit this macro-model once again.
As you can see, -35% corrections have been present on every Cycle since the January 2009 bottom of the Housing Crisis. The pattern that the stock follows is very specific and it starts with a prolonged correction, the Bear Cycle essentially, which is a lengthy correction phase, such as the 2008 Housing Crisis, the 2015/16 China slowdown and the 2022 Inflation Crisis.
Then a very structured uptrend phase starts in the form of a Channel Up that leads the market to its first peak, followed by a shorter, quicker correction phase that tests the 1M MA50 and rebounds. The rebound is the final bull phase of the Cycle, usually strong and sharp and leads to the eventual Cycle Top and then starts then new Bear Cycle (prolonged correction).
Right now the current 4-month correction is technically, based on this model, the new shorter correction. Being more than -35% in size, the last one larger than this was the previous short correction of the last Trade War in October 2018 - January 2019 (-38%).
The similarities don't stop here but extend to the 1M RSI as well, which just entered its 25-year mega Buy Zone that has been holding since December 2000 and the Dotcom Crash! In fact the last time Apple's 1M RSI was this low was in June 2013, which was the bottom of the 1st short correction on our chart.
This remarkable symmetry just shows how similar the current phase is with its previous ones and if the symmetry continues to hold, we should be expecting a strong recovery to start. Even if the price makes a slightly deeper low as -38% (like the January 2019 bottom), we may still expect the minimum rise that it had all those years shown on the chart, +145%, which translates to a potential $390 Target long-term.
It is in times like this, that patient long-term investors filter out the news noise, make their unbiased moves and maximize their profit.
-------------------------------------------------------------------------------
** Please LIKE 👍, FOLLOW ✅, SHARE 🙌 and COMMENT ✍ if you enjoy this idea! Also share your ideas and charts in the comments section below! This is best way to keep it relevant, support us, keep the content here free and allow the idea to reach as many people as possible. **
-------------------------------------------------------------------------------
💸💸💸💸💸💸
👇 👇 👇 👇 👇 👇

AAPLAAPL is in a correction phase. The price still has a chance to test the support zone of 154.3-137.3. If the price cannot break through the 137.3 level, it is expected that in the short term, there is a chance that the price will rebound. Consider buying the red zone.
🔥Trading futures, forex, CFDs and stocks carries a risk of loss.
Please consider carefully whether such trading is suitable for you.
>>GooD Luck 😊
❤️ Like and subscribe to never miss a new idea!

SPX WEEKLY 7TH APRIL 2025Welcome to SPX weekly. I have deeply discussed the price action here. If you have any doubts, feel free to leave a message or comment below.
NOTE:DO NOT SHORT

Apple Inc. (NYSE:$ AAPL)Drops $300B+ in Tariff- Fueled Sell-OffApple Inc. (NYSE:$ AAPL) faced a massive sell-off on Thursday, April 4th 2025, with its stock closing at $188.38, down $14.81 (7.29%). This marked Apple’s worst trading day since March 2020. The steep drop came after former President Donald Trump announced a new set of tariffs targeting 185 countries, including major U.S. trading partners.
As a result, Apple’s market capitalization fell by more than $310 billion in a single day. These newly imposed tariffs, effective April 9th, include a 10% blanket duty on all imports, with higher rates applied to specific countries. China, Apple’s primary manufacturing hub, will face a combined 54% tariff—34% newly imposed, added to an existing 20% rate.
Other affected regions include the European Union (20%), Vietnam (46%), Taiwan (32%), and India (26%). Analysts consider Apple especially vulnerable to these policies due to its heavy reliance on overseas production, especially in China, where nearly 85% of iPhones are manufactured.
According to Dan Ives of Wedbush, future exemptions to these tariffs may depend on Apple’s efforts to localize its operations within the U.S., a move hinted at by the company earlier this year. However, no details have been confirmed regarding whether Apple’s U.S. expansion plans will qualify for tariff relief. The timing of the policy combined with Apple’s exposure to international supply chains, led to a bear shift in market.
Technical Analysis: Apple Breaks Below Key $197 Support
Apple’s price action shows an impulsive breakdown below the key $197 strong support level. The price is currently trading around $188, trading towards next support at $167 as the immediate support.
A drop below $167 could push the stock lower to a long-term support around $125, which was lastly retested in Dec 2022. On the upside, any recovery would first need to reclaim the broken support at $197, which now acts as resistance. The all-time high around $260 remains far away from reach unless the overall stock market sentiment improves.
Looking ahead, the chart outlines two likely scenarios. In the bullish case, Apple may find support around $167, bounce back and attempt to break above $197, possibly re-establishing it as a support zone.
In the bearish case, failure to hold $167 could push the stock lower to test $125, and if that level breaks, the price may continue downward. The current market outlook suggests a wait-and-see approach, to what happens at key level, as both macroeconomic news and technical levels continue to drive Apple stock lower.

Thoughts on US equities. Not looking good at all. Expecting more sellside distribution on US equities. We need to go towards any discount levels

WILL APPLE (AAPL) BREAK SUPPORT ON 1 HOUR CHART? CRASH INCOMING?The California based AAPL is down nearly -18% since March. It appears to be approaching some key support trend lines. Will the support prices hold for this tech giant? Are Trump Tariff's fueling a sell off?
Disclaimer: Not financial advice.

Apple - All This Was Expected!Apple ( NASDAQ:AAPL ) perfectly plays out:
Click chart above to see the detailed analysis👆🏻
Just a couple of months ago, Apple perfectly retested the rising channel resistance trendline and has been creating the expected bearish rejection. This could perfectly form the next all time high break and retest, which would eventually lead to another significant move higher.
Levels to watch: $190
Keep your long term vision,
Philip (BasicTrading)

$AAPL needs to clear 225-226NASDAQ:AAPL needs to clear 225-226 for bulls to really take Day comes into play around 230

APPLE My Opinion! BUY!
My dear subscribers,
My technical analysis for APPLE is below:
The price is coiling around a solid key level - 218.33
Bias - Bullish
Technical Indicators: Pivot Point sHigh anticipates a potential price reversal.
Super trend shows a clear buy, giving a perfect indicators' convergence.
Goal - 229.62
My Stop Loss - 213.08
About Used Indicators:
By the very nature of the supertrend indicator, it offers firm support and resistance levels for traders to enter and exit trades. Additionally, it also provides signals for setting stop losses
———————————
WISH YOU ALL LUCK

U.S. Big Tech 10 (NYSE FANG+) Index. Another Day. Another DollarThe remarkable performance of U.S. large cap equities in the past two years was closely tied to the dominance of tech-related sectors, exemplified by companies akin to those in the high-performing NYSE FANG+ Index ICEUS:NYFANG .
The NYSE FANG+ Index (“Index”), also known as the NYSE U.S. Big Tech 10 Index, is a rules-based, equal-weighted equity benchmark designed to track the performance of 10 highly-traded growth stocks of technology and tech-enabled companies in the technology, media & communications and consumer discretionary sectors.
The Index undergoes a reconstitution quarterly after the close of the third Friday in March, June, September and December (the “Effective Date”).
The NYSE FANG+ Index provides exposure to 10 of today’s highly-traded tech giants
Access the index through a futures and options contract designed to help you increase or reduce exposure to this key group of growth stocks in a capital-efficient manner.
Ten constituents of The U.S. Big Tech 10 (NYSE FANG+) Index as of Friday, December 9,
2022 (10% equal weighting):
Meta NASDAQ:META
Apple NASDAQ:AAPL
Amazon NASDAQ:AMZN
Netflix NASDAQ:NFLX
Microsoft NASDAQ:MSFT
Google NASDAQ:GOOGL
Tesla NASDAQ:TSLA
NVIDIA NASDAQ:NVDA
Snowflake NYSE:SNOW
Advanced Micro Devices NASDAQ:AMD
The main technical weekly graph indicates The U.S. Big Tech 10 (NYSE FANG+) Index remains aboму 200-day SMA (so far), following the upside path that has been taken in early 2023 after 50 percent decline in 2022.
--
Best wishes,
@PandorraResearch Team

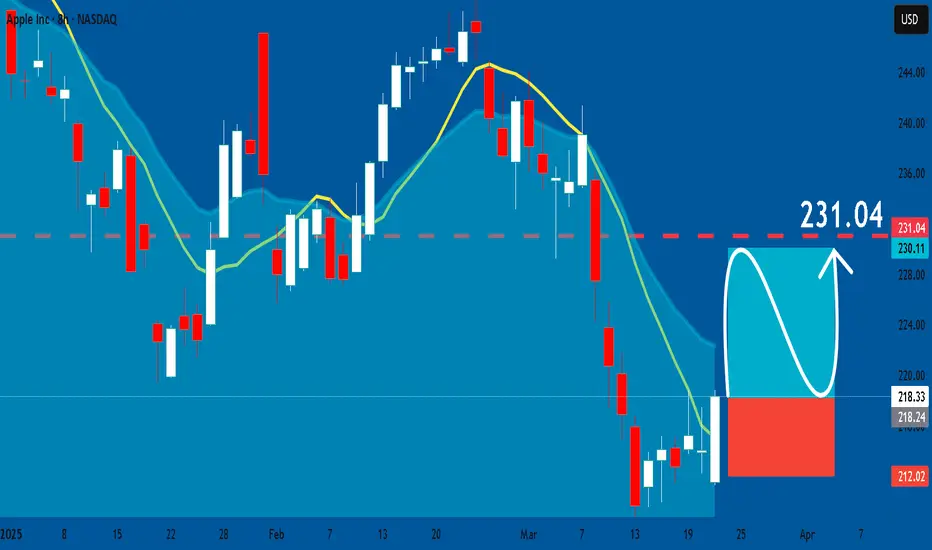
APPLE: Long Signal Explained
APPLE
- Classic bullish pattern
- Our team expects retracement
SUGGESTED TRADE:
Swing Trade
Buy APPLE
Entry - 218.33
Stop - 212.02
Take - 231.04
Our Risk - 1%
Start protection of your profits from lower levels
Disclosure: I am part of Trade Nation's Influencer program and receive a monthly fee for using their TradingView charts in my analysis.
❤️ Please, support our work with like & comment! ❤️
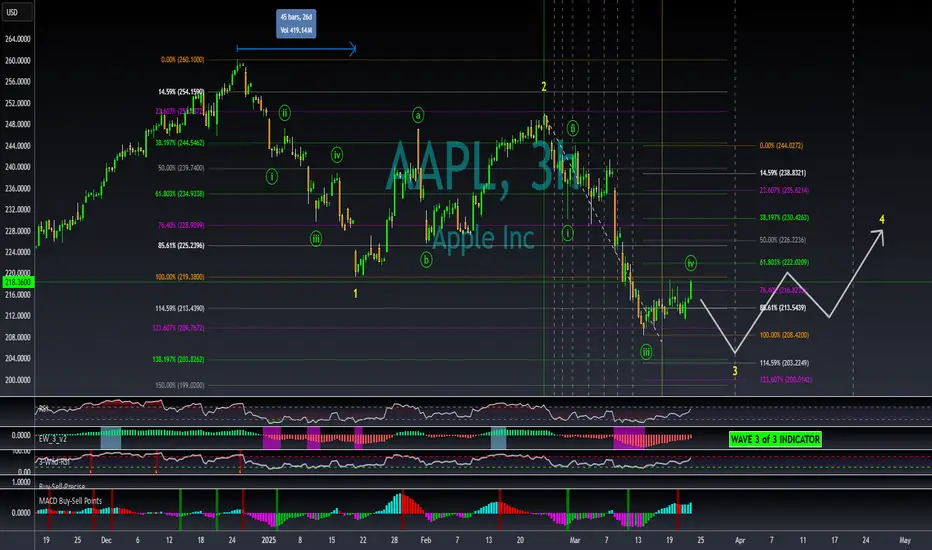
Will AAPL temporarily go below 205 this week?My overall thesis is we are in the very early stages of a multi-year decline ultimately with the S&P 500 below 3500. I have been wrong many times before so I will just take this thing in stages and see if it plays out. After this massive decline, we should be in for a great market rally of many decades. While the market has seen a brief rally, the primary question is when will the rally end? Friday turned in mix answers to that question. The next step in my opinion will be a decline, possibly sharp with a quick bottom in some sectors AHEAD of the reciprocal tariff deadline on April 2.
My wave 3 indicator tends to signal wave 3s and 3 of 3s with additional end of wave (overbought/sold) conditions. See my scripts for the specifics of the indicator. It currently signaled 3 of 3 based on the bottom in mid-March meaning another drop is likely soon.
While the other stocks I have studied mainly topped at all-time highs in mid to late February, AAPL topped at the end of 2024. The movement of AAPL may be a leading indicator of future market movement as the market appears to be trading as a micro wave structure inside of AAPL's more macro movement.
My market expectations are for their first semi-major wave 1s to end within the next few weeks. Each wave 1 will be followed by a multi week wave 2 up. AAPL may end its wave 3 structure (yellow 3) when the others finish their wave 1s. AAPL would then experience wave 4 up, when the other stocks and S&P 500 index experience their second wave.
This chart applies select movement extensions based on wave 1's movement on the left and then another based on wave 3's movement on the right. I keep the values between 0%-100% on the chart for wave 2s and 4s retracements of the preceding wave's movement for reference even though the retracement values would be inverted.
I will refer to the yellow waves a Minor waves and the green as Minute waves. The extension/retracement data on the left is based on Minor wave 1's movement and is applicable to Minor waves 2 and 3. It provides a rough location of levels for Minor wave 3 to end. The extension on the right attempts to determine Minute wave 5's end points based on Minute wave 3. An intersection of Minor wave 1 extension levels and Minute wave 3 extension levels are general targets for bottoms. One of these is between 203-204 for AAPL.
Lastly, I apply similar levels to determine Minor wave 3's length based on Minor wave 1's length of 45 bars (on the 3 hour chart). Minor wave 3 is currently longer than 45 bars. The vertical dashed bars provide similar locations with the next vertical bar occurring on the morning of Monday March 31. I am therefore watching to see if the next bottom for AAPL occurs at this time.
If this bottom truly comes into focus, I will then attempt to forecast Minor wave 4 for AAPL which could occur in late April.
Apple - Will Apple visit the $200 zone again?Apple has officially started its daily downtrend. The $200 support zone is a level that has been respected often in the past, with a high confluence of the Golden Pocket. It is highly possible that Apple could revisit this level and make a strong bounce. Until then, there is a high probability that this level could be revisited until the downtrend is broken.
Thanks for your support.
- Make sure to follow me so you don't miss out on the next analysis!
- Drop a like and leave a comment!
Lets chat in the comment section. See you there :)

Apple (AAPL): -50%. According to the planElliott Wave Analysis of Apple stock
.
● NASDAQ:AAPL |🔎TF: 1W
Fig. 1
The long-term wave markup has not been adjusted for the past three years. Except that the orthodox tops and bottoms and targets for third waves are slightly refined.
.
● NASDAQ:AAPL |🔎TF: 1W
Fig. 2
Earlier, at the end of 2023 , we have already suggested wave ((iv)) in 3 in the form of a running flat. As we can see, the attempt was unsuccessful, the formation of a sideways correction continues to this day. It can be a running flat or an expanded flat, the latter of which assumes a break of the 124.17 low.
