Apple Stock Is Surging! Here’s What Most People MissWhen it comes to trading, we don’t care about the latest news headlines or whether some analyst has upgraded or downgraded Apple stock. We focus on one thing and one thing only: the undeniable forces of supply and demand imbalances on higher timeframes.
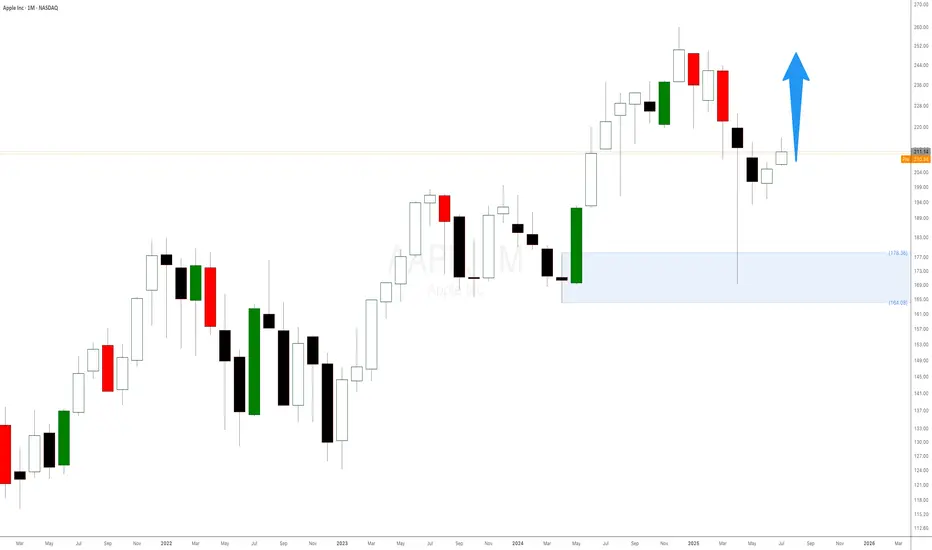
Right now, Apple’s monthly chart is a textbook example of how waiting for a strong demand imbalance pays off. That $178 monthly level is no random number. It’s the exact origin of a massive bullish impulse that happened in June 2024 — the kind of move that only happens when smart money and big institutions step in, creating an imbalance that pushes the price away rapidly.
📈 It’s Not About Fundamentals. It’s About Imbalances.
Most retail traders waste time chasing news, earnings, or rumours about iPhone sales. But if you think about it, all those factors are already priced in once a strong imbalance is formed. Institutions don’t wait for tomorrow’s news — they plan their positions weeks or months ahead, and those footprints are visible right on your chart.
The $178 level indicates a significant drop in supply and a surge in demand large enough to propel Apple higher, marked by consecutive large bullish candlesticks. That’s our signal — nothing more, nothing less.
Appleforecast
Apple: More Room to RunWe still allow more room for Apple’s magenta wave (B) to extend upward before wave (C) takes over, pulling the stock toward the low of green wave . Thereafter, green wave should start (above $168) and initiate the next advance, lifting the stock toward resistance at $260.10. A break below $168, however, would activate our alternative scenario, in which blue wave alt.(IV) targets a deeper low (32% probability).
📈 Over 190 precise analyses, clear entry points, and defined Target Zones - that's what we do.

AAPL: Premium PlayApple beat expectations this quarter—revenue, profit, EPS—all slightly better than analysts hoped. But the stock dropped to $196.26, down from $212.83. Why? Investors are still worried about tariffs, margin pressure, and supply chain changes.
Tim Cook talked about strong product sales (iPhone, Mac, iPad) and all-time high Services revenue. But he also admitted tariffs and regulatory issues are weighing on Apple’s outlook.
My Covered Call Strategy
I’m selling the $202.5 call and buying the $210 call for June 27, 2025. Big money seems to be doing the same—there was a huge premium sale over $2 million, likely betting Apple stays range-bound short term.
- Why this works:
- Resistance near $202.50 gives me a clear ceiling
- Apple fundamentals are strong, but macro risk caps upside
Chart Notes
- Resistance: $202.50 and $210
- Support: Around $192.50
Bottom line:
I like this trade as a way to bring in income while defining my risk. If Apple grinds sideways or pushes a bit higher, the trade still pays. Clean structure, high odds.

APPLE I Stock Forecast and Price Target Welcome back! Let me know your thoughts in the comments!
** APPLE Analysis - Listen to video!
We recommend that you keep this pair on your watchlist and enter when the entry criteria of your strategy is met.
Please support this idea with a LIKE and COMMENT if you find it useful and Click "Follow" on our profile if you'd like these trade ideas delivered straight to your email in the future.
Thanks for your continued support!Welcome back! Let me know your thoughts in the comments!

Apple Shares (AAPL) Drop Below $200Apple Shares (AAPL) Drop Below $200
Late last week, Apple released a quarterly report that beat analysts’ expectations:
→ Earnings per share: actual = $1.65, forecast = $1.63
→ Revenue: actual = $95.36bn, forecast = $94.5bn
However, today AAPL stock price is below the psychological $200 mark, over 7% lower than last week’s high (point E).
Why did AAPL shares fall?
According to media reports, investors were concerned about weaker-than-expected services revenue and disappointing sales in China. These factors have renewed fears that the ongoing US–China trade tensions could have a deeper impact on Apple going forward.
Bearish sentiment may also have been amplified by Warren Buffett’s decision to step down as head of Berkshire Hathaway — as we noted yesterday — since his company is one of Apple’s major shareholders.
Technical Analysis of Apple Shares (AAPL)
Key AAPL price action patterns (marked) show a sequence of lower highs and lows, forming the basis for a downward channel. Fibonacci ratios reinforce bearish characteristics in price movements:
→ The rise from B to C is approximately 50% of the decline from A to B
→ The rise from D to E is around 50% of the decline from A to D
This technical picture suggests a potential bear market, where rallies may be corrective rebounds following impulsive drops. This strengthens the scenario in which AAPL shares could continue falling within the established descending channel.
This article represents the opinion of the Companies operating under the FXOpen brand only. It is not to be construed as an offer, solicitation, or recommendation with respect to products and services provided by the Companies operating under the FXOpen brand, nor is it to be considered financial advice.

Apple: Top and DropAs part of Apple's ongoing wave (2) correction, we assume that the subordinate turquoise wave X still needs to conclude in the short term before the price can drop into our magenta Target Zone between $209.57 and $196.05. There, we anticipate a bullish reversal, which should offer trading opportunities for the long side and mark the starting point for the next major upward move. Alternatively, there is a 37% chance that the low of wave alt.(2) has already been reached, which will be confirmed if the price surpasses $260.10.

Apple: As Expected…Apple has made progress as part of our primary scenario, gradually edging lower toward our magenta Target Zone between $209.57 and $196.05. In this price range, we anticipate the low of the magenta wave (2) and, subsequently, a reversal to the upside. On the other hand, we consider it 37% (previously 40%) likely that AAPL will stage an immediate breakout above the resistance at $260.10 without first reaching our Target Zone.

AAPL Daily: Are We Heading to $272 or Taking a Detour?Hey Mindbloome Family, let’s talk about Apple (AAPL). Here’s what I’m seeing—it’s easy to follow, I promise:
1️⃣ Straight to $272:
If Apple breaks above $258–$260, we could see it head straight to $272.
2️⃣ Pullback, Then Up:
Apple might touch $258–$260, pull back to $253 or $236, and then move up toward $272.
3️⃣ Deeper Drop, Then Recovery:
If we fall to $236–$230, I still think there’s a good chance of bouncing back to $272.
4️⃣ Breakdown Scenario:
If $230 doesn’t hold, we’ll pause, reassess, and come back with a new game plan.
Wellness Tip: Don’t forget to move around! Sitting for too long can drain your energy. A quick walk or stretch can work wonders for your focus.
What do you think—is Apple heading to $272, or will we see a dip first? Let me know! If you want to chat more about this, hit me up in the DMs or check out my profile.
Kris/Mindbloome Exchange
Trade What You See

APPLE Stock 22% Gain - Profit Target 2 Reached!The APPLE stock price crosses over the Risological swing trader dotted line on on May 3, 2024 giving us a clear bullish trade setup.
LONG Trade Setup
Entry 185.5
Current trailing stop loss at : 203.6
Overall gain from the entry: 22%
Last profit target is at 254.5
Congratulations, who made profit!

Apple - Back to no.1 in the world!NASDAQ:AAPL is back to being no.1 in the world after rallying 11% in two days.
After moving higher +25% over the past two months, Apple is now back to being the most valuable company in the world with a market cap of 3.4 trillion dollars. This means that Apple is now back to leading the indices but Apple is also retesting resistance. A pullback is definitely likely considering that trees do not grow to the sky, but the overall trend is simply clearly bullish!
Levels to watch: $170, $215
Keep your long term vision,
Philip - BasicTrading

ApplePair : AAPL - Apple Index
Description :
Completed " 12345 " Impulsive Waves
Resistance Level
Break of Structure
RSI - Divergence
Rising Wedge as an Corrective Pattern in Short Time Frame

Triple Top Apple going down - ultimately a head and shouldersApple will pierce the 50 and go back to it's latest accumulation area due to coming out with nothing new besides a crappy calculator and hitching it's failing stock (Buffett sold) to the latest bubble fad: AI.
I see Apple ultimately failing because the future will get rid of free business models for "stake holders" - if Biden gets reelected because we will have DIGITALID after the election and CBDC's shortly after that. If Trump gets in we'll morph to a gold standard, and Apple will have one last gasp of an idea that completes the right shoulder before the global economy is lost to global depression because of The Great Reset which is unavoidable due to currencies being ticking time bombs due to the coming sovereign defaults.
This will ultimately push up the dollar to 160+ before imploding itself.
I don't see ANY reason to hold Apple here. Fear and Greed is turning on the Weekly and Greed is losing momentum, RSI turning down and MACD is forming a crossover soon.
I'd buy puts on this: September 130 going for .25, this will return 20x.
NOT FINANCIAL ADVICE

AAPLPair : Apple Index
Description :
Completed " 12345 " Impulsive Waves
Break of Structure
RSI - Divergence
Fibonacci Level - 161.8%
Rising Wedge in Short Time Frame

Testing Vix Cheat Sheet on Apple, 5 days + 4.11%The Viz cheat sheet indicator reveals that if the Vix closes above the upper Bollinger band ($19.01) during the next 5 days that means the Apple stock price will increase by 4.11% to $174. Currently the Vix is around $18.
I've tested this indicator the Vix cheat sheet before with quite impressive results.

The Power of Supply and Demand: Apple Stock Smart InvestmentAre you looking to make a smart investment with the potential for high returns? Look no further than Apple stock (NASDAQ: AAPL). In this supply and demand stock analysis, I will explore the power of supply and demand in driving the value of Apple stock and why investing in this tech giant could be a game-changing move for your portfolio. Read on to discover why now is the perfect time to jump on board with one of the most iconic companies in the world.
One of the key factors driving the success of Apple’s stock is its strong weekly demand level, which recently took control a couple of weeks ago at $174 per share. This demand level refers to the amount of interest and investor purchases in a given week. In simpler terms, it reflects how many people buy and hold onto Apple shares.

AAPL | $240 by 2025To keep it simple, the bull flag pattern is still working away after a successful retest.
Some may ask why are we still in the same area, and the answer to that may be the ascending triangle pattern that we dove into right after the break. You can see its constructed with falling wedges, and I believe the next burst of price action will send us flying towards $212.
In a bearish scenario I would like to see price break below $177 with a bearish retest to invalidated the triangle, and a break below $166 to scrap the long term rally.
For now I'll be eyeing short term price action for any accumulation patterns within the falling wedge pattern around $180. Doing this will allow the entries to be placed early in time for the anticipation of whats next to come, and leaves less risk on the table from a technical perspective.

APPLEPair : Apple
Description :
Double Top Pattern in Long Time Frame and Rejection from Resistance Level
Strong Divergence in RSI
Break of Structure
Falling Wedge as an Corrective Pattern in Short Time Frame
Lower High - Lower Low

APPLE LOOKS STRONG BULL TRENDthe price will rise up to the area between 215 - 220 till the RSI indictor be over 65
cheers

Apple(AAPL)- Weekly Forecast is Bullish Technical Analysis:
- Apple is doing now wave ((3)) in black
- H1 right side is turning down
- H4 right side is up
Technical Information:
- If you're a swing trader, you can buy wave ((4)) in black when it completes ABC correction
- For position trader , you must wait for wave II in red to complete in next 6 months

Join the Apple Boom and Reap Incredible Benefits!
The juggernaut that is the iPhone user base is soaring higher than ever before! 📈📱 Yes, you heard it right! As an esteemed trader, this extraordinary growth presents an unmissable opportunity for you to become a part of the Apple success story.
With every passing day, our beloved Apple brand is captivating millions around the globe. Not only has the iPhone user base expanded exponentially, but it continues to surpass all expectations. Such staggering growth inspires confidence in Apple's exceptional potential for your investment portfolio.
By joining forces with Apple Inc., you can embrace a new era of extraordinary returns. 🍏💰 As the iPhone user base grows, so do the countless opportunities to maximize your profits. Indulge in the prospect of investing in an iconic, technologically pioneering company that remains ahead of the pack. Seize the chance to ride the waves of success alongside Apple, the visionaries who revolutionize the digital landscape.
So, let's not just stand on the sidelines and watch this phenomenal growth unfold. I wholeheartedly encourage you to jump on board and long Apple stock today! Let's enjoy the immense wave of prosperity together.
For further details and personalized assistance, please feel free to comment below.

AAPL is Bullish in Weekly(W) and H4Technical Analysis:
- Now Apple(AAPL) is doing a wave ((5)) in black
- H1 right side is up
- H4 right side is up and it has a bullish structure
Technical Information:
- As a position trader you should buy in wave (II) in blue
- As a swing trader you should buy in any pull back in H4
- When we'll have more data we can consider a buy in wave IV in red
- WARNING : Don't sell AAPL now

APPLE will sell like punctured balloonAPPLE - BEARISH INTERNAL CYCLE
Price crossed and it's on Panic Area (-0.382 - 0.00%) from Bearish Internal Cycle
I Suggest open SELL positions / take profits from bought stocks at current price
- SL: ABOVE PANIC LIMIT AREA (195.81)
- TP 1: 150.00 - 144.00 (50-61 %)
- TP 2: 128.00 - 122.00 (100 %)
ADDITIONAL CONFIRMATIONS:
- STAGE 3 => STAGE IV @ US10Y

APPL - Where to next?NASDAQ:AAPL APPL - Where to next?
We got a beautiful rising channel as well key trendline areas.
Highs: 162
Lows: 158
Now be aware we do have the gap above but if we break below the lows a clean close below the red trendline up, price could easily reach 156. However, if we are to break the highs, I expect 164/168 closing that gap above.
Ignoring the noise and focusing on price is key!
Trade Journal
