AAPL : AAPLE INC | Fundamental Analysis | Alternative ScenarioAccording to some investors, Apple may have lost its investment attractiveness. Since it has been about 10 years since Steve Jobs stepped down as CEO, one would assume that the company is past its best days.
With a market value of more than $2 trillion, it's much harder to grow at a rate that will make new investors millionaires through modest investments. But is that reason enough to refuse to buy stock of this company?
Apple's management now uses its accumulated vast resources to work and apply its expertise to continue producing attractive products, managing new services, and developing new industries, which still gives investors plenty of reasons to buy Apple stock and never sell.
Of course, the death of Steve Jobs in October 2011 left the company somewhat of a void. In the years that followed, the company's new products seemed to make it more of a competitor than a leader in the technology industry.
Nevertheless, the development of new products did not stop. The Apple Watch was introduced in 2015 and has evolved into an innovative product that can do incredible things, such as collect health data from users, track heart rate and blood oxygen levels, and even automatically inform others when a user loses consciousness. These advances bring innovation to health care and have the potential to save lives.
Apple has greatly expanded its services business. It includes the App Store and offerings such as iCloud, Apple Music, Apple Pay, Apple Arcade, Apple TV+, Apple News, and Apple Card. The success of the services segment pushed it into Apple's second-largest revenue category, accounting for 16% of revenue in the first half of fiscal 2021.
Apple's multi-year offerings also continue to be innovative. The iPhone remains the main revenue driver, accounting for 56% of the company's revenue in the first two quarters of fiscal 2021. Although the company did not release its first 5G smartphone, the release of the iPhone 12 helped Apple launch the 5G industry. One of the beneficiaries, in addition to Apple, is Qualcomm, which makes the chipset that powers the latest iPhone. Qualcomm's growth began after Apple and Qualcomm settled their legal disputes in April 2019, and there was another jump after Apple released the iPhone 12 in October last year.
The negative economic impact of the COVID-19 pandemic forced millions of people to work from home and supported Apple in yet another way, sparking renewed interest in some of Apple's older products. In the first six months of fiscal 2021, iPad sales were up 57% from a year ago, and Mac sales were up 42% in that period. The Mac also benefited from product development as it switched from Intel processors to Apple's own M1 chip. Clearly, Apple remains a vigorous and competitive company.
This resilience has bolstered the company's financial performance. In the first six months of fiscal 2021, net sales were $201 billion, up 34 percent from the first six months of the previous fiscal year. During that time, net income rose 56% to $52.4 billion, as Apple limited its growth in operating expenses (they rose only 12%). This ability to manage expenses well, even on such a large scale and in the face of greater negative economic impact, allowed Apple to generate about $57 billion in free cash flow during these six months.
Because of this free cash flow, Apple maintains one of the most robust balance sheets in the world. While the company's total debt of $121.6 billion may seem significant, the company borrowed money not because it had to, but because the likely profits exceeded the cost of borrowing. With liquidity at $204.3 billion right now, even if Apple had to pay off all of its debt today, it would have about $83 billion in cash and cash equivalents left over. Thus, the company is well-positioned to overcome unforeseen difficulties, strengthen its business lines or create new businesses. Thanks to this, Apple's share price has risen about 75% in the past 12 months.
Apple's earnings are now generating a P/E ratio of just under 30. It's a significant increase for a company that for most of the 2010s has been unable to raise its P/E ratio above 20.
Nevertheless, its valuation is now quite comparable to that of other tech giants such as Microsoft and Google's parent company, Alphabet.
Of course, a market value of $2.15 trillion might scare off some growth-oriented investors. For a new investor to double their money in Apple stock, the market value must rise to $4.3 trillion. That's quite a challenge when the market value of not a single company has yet reached $3 trillion.
Despite its scale, Apple continues to produce innovative products, and the demand for these products continues to generate enormous profits and cash flows for Apple. With its enormous market capital, it will be much harder for this technology company to create as many millionaires in the future as it has over the past decade. Nevertheless, both new and longtime Apple supporters can expect Apple's growth story to continue at some level for years to come.
Appleinc
AAPL - You Have Only 45min Hi, this is my update for AAPL. After a big fall today, we have now tested the support level $127, SMA100 and SMA50. We got rejected first time we tested the 70.2% retracement level from the recent fall, but I think in the coming days we are going to break it. Next resistance is between $135-137, if we break it we are ready for $143. So be patient and don't PANIC, AAPL is BULLISH ;)

#APPL Ready for ATH? (All time high) $APPLIf Apple breaks ATH and resizes more than 5% AFTER breaking ATH. There is high probability of 10-20% returns and so I will go LONG by buying ATM Calls.

APPLE Inc.This is an update on Apple Inc., I am still expecting Apple Inc. to hit $200/share - as my target.
Disclaimer:
This must not be taken as a trading signal.

Apple share price analysis - The decision has been made!Hello dear readers,
The correction in Apple ended with a clear positive week. The cross support of the golden pocket and trend line was tested hard, but held.
Now the price is showing the appropriate reaction and can clearly pull away.
The medium-term outlook is therefore positive!
The price target of the current movement can be derived on the one hand from the Fibonacci expansion and on the other hand from the trend channel and thus lies at approx. 158 points.
As long as the trend channel is not broken downwards, the chart remains positive. Only a break of the trend channel would put the long scenario in danger.
Don't forget to Like & Follow if you like what you read :)
Best wishes & success!
Chartdigger

$AAPL AMAZING WEEK! Whats Next? Walking through a few differently potentials going into the second week of April! Congrats to those following along This week

$AAPL Last Video HIT! Target in Range! 4/7-8 ( UPDATE TA)Video Breakdown again on $AAPL Last video was a hitter!

AAPL roads to 130 dollar again apple will grow fastTarget price is solid $130
There is no stop but just adjust your position's amount if it breaks $116
However I will hold the position until $130

AAPL - Apple inc.When the Crypto market is consolidating and you can't find any main coin interesting enough to long or short, Take some time off and study the charts of some powerful companies.
That's what I do and I've never regretted this.
For example right here we've got AAPL as a very good example. right now it's already got rejected by a resistance, fell and got support and consolidating to go back up. I'd buy some shares because it looks powerful. and also, It's never a bad choice to buy AAPL, no matter what. (Chart speaks for itself)
Good Luck 🎲
Tell me your ideas. Like and Share 🗣✅


Is APPL getting setting up for another crash?Personally I think Apple just like many other tech and speculative stocks are setting up for some major corrections. Personally I see Apple going down to $80 within the next year.
First I want to talk about why historically we about due for one. I have the 50 and 200wma pulled up on the chart. You'll notice Apple has been in a Constant uptrend since April of 2003. Its first Rally was from April 2003 until march 2009. That was the first time it tested the 200wma. Then you have another rally from the bounce off the 200ma all the way till 2013 when it crashes off the 200wma again. That was Close to a 4 year rally. then we go from the bounce off the 200ma in Jun of 2013 until it crashes and touches the 200ma again in may of 2016. So basically a 3 year rally. the next one was the bounce off the 200wma in Jun of 2016 till December of 2018. So this rally lasted about 2.5 years. Now we are in the Current run up from Jan 2019 till today. That's a little over 2 years. As you can see each bull rally since the tech crash has gotten smaller and smaller in time. Personally I see nothing on the charts, economically or anything going on with Apple that would justify this rally lasting longer then the last one at 2.5 years. Its been in a downtrend since the beginning of the year basically which I think is hinting it will touch that 200wma sooner then later.
Also when you look at the tops of each rally over the years they do look a little similar and I don't think the downtrend it is in now looks much different.
Best of luck on your trades!


Apple inc SHORTAccording to my analysis and the strategy that i am using, the market is still going to drop
As we can see the buyers have tried to push the price but they failed to do so


Apple offers an excellent risk reward ratioAAPL might be a hated stock currently.
Everybody is a yield rate expert nowadays and the narrative that all tech must crash, better today than tomorrow is told everywhere you listen.
However, if we look at it from a risk reward perspective, it offers an excellent entry currently.
Stops could be placed as tight as 115, with an upward potential of 155, making us a nice 7:1 dog on our bet...
I mean, come on, the bullish flag is even upwards.... :)

APPLE INC. BREAKS BELOW ASCENDING TRIANGLEIn my Previous Post, I said Price could Push higher from the 50% fib zone. Having Re-visited the charts, I have now identified an Ascending Triangle and Price has pushed below, retested, and now continues to fall. We could see a Gap appear at the Open after the weekend with Price potentially pushing as low as $99.
#appleinc #applestocks #appleshares #stocksandshares #stockmarket #investing

$AAPL Follow Up Video 2/3 Continuation? $AAPL Last Video hit! Looking for continuation within the market to fuel $AAPL past some key resistances


AAPL LONGHi friends.
NASDAQ:AAPL in corrective wave now, expect going down to 115$, triangle-pattern will finish at 145$-155$.
In point: 116$-115$
Out point: 145$-155$
Please comment below what you thinking.
If this analysis is useful please click the like.
Trade with profits.

Apple shortThe breaking of the purple channel pushes the price down. The formation of a red channel is another sign of the strength of the sellers. The third sign is the increase in volume within the red resistance range.
in return
The center line of the green channel, which is orange, has usually been strong, and the Trend Magic line has sometimes been a good support line
The lower shadow of the one-hour candlestick was large when hitting the resistance of the red descending channel
These are also signs of the power of buyers.
But the power of buyers seems to be less than that of sellers because the signs of the body are weaker.
We can wait a little longer until everything is clear, but in this case we may lose a lot of profits!
Apple stock prices will probably go yellow. The range of $ 100 to $ 103 is good to buy, but people who want to take the risk to buy the stock cheaper and of course they may not be able to buy! They can wait until Apple shares hit the bottom of the green channel!
Also, if during the first 2 or 3 days of next week and the price manages to break the red downward channel upwards or the price manages to return completely to the purple channel, it is a good time to buy!
Personally, I find the yellow route more probable. But for more investments, I am waiting for the market to determine its path better and more!

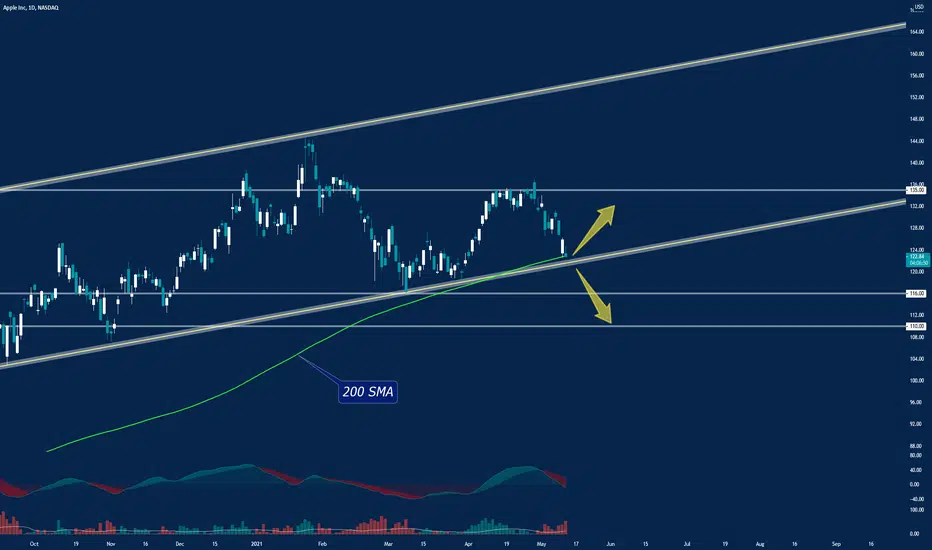
Apple Price at Trend line Support`Apple stock price is now at the trend line support it can bounce from here as well as break down below will can send the price lower.
apple stock chart looks bad with RSI indicator .. heavy selling at the 140 dollar zone which is big resistance for the apple to cross.
we will check the price reaction at the trend line support than will take decision accordingly

NUMBER ONE - APPLE $AAPL - 3 Trillion Mcap ComingQuick Technical View:
Watching Apple closely...
Apple affects the broader market greatly after all.
Possible trading opportunities will present themselves.
I would love to add much lower of course...

APPLE entry levels LONGAPPL stock correction before EARNINGS is a good opportunity to enter.
ENTRY LEVELS LONG:
$126
$120
$113 STRONG BUY
