Appleinc
A 37% Drop Is in store For APPLEApple has finished its 5 waves up for the uptrend.
We would see some major selling between this level: 270-285. I would place some shorts there.
Target is a 37% drop from the high at 166 USD.

Apple stock continues to rally, $295 is the target! 100% in 2019Over the last 14-weeks, Apple stock has had 2 red weeks, and they've been almost negligible. The stock is up nearly 80% this year alone!! We can see the stock gain 100% by the end of the year if this continues, especially around the holiday season. Since Apple is on all-time highs, the only instrument to help us with the potential upside target is the Fib extension, we've used two different levels to identify levels at which Apple may get attracted to and/or stall.
The first target level is $275 based on the Fib extension from the impulse that brought price up to this high.
The second target is $295 based on the Fib extension from the move that managed to drop price heavily in December 2018.
Where could a trader get in? The logical level is where the last slight pullback happened and the broken high at $240-$250 however that is pretty far from the current price, if the equity market does see a pullback then Apple may be more prone to retrace.
Disclaimer: This trade idea is for educational purposes exclusively, this does not constitute investment or trading advice. TRADEPRO Academy is not responsible for any market activity.

Apple SHORTWe have an incredible opportunity to short the stocks of Apple. Just look at how distinct are the divergences between the price and oscillators, i believe 2020 will be a tough year for Apple. We can expect a decline all the way down to $150. Someone is going to make a big money.

Analysis of APPLE 28.11.2019The price above 200 MA, indicating a growing trend.
The MACD histogram is above the zero lines.
The oscillator Force Index is above the zero lines.
If the level of resistance is broken, you should follow the recommendations below:
• Timeframe: H4
• Recommendation: Long Position
• Entry Level: Long Position 267.40
• Take Profit Level: 269.00 (160 pips)
If the price rebound from resistance level, you should follow the recommendations below:
• Timeframe: H4
• Recommendation: Short Position
• Entry Level: Short Position 266.00
• Take Profit Level: 265.00 (100 pips)
USDJPY
A possible long position at the breakout of the level 109.60
GOLD
A possible short position in the breakdown of the level 1452.00
USDCHF
A possible long position at the breakout of the level 1.0000
EURUSD
A possible short position in the breakdown of the level 1.0990


AAPL Shows Professional Trader SetupProfessional Traders initiate trigger action on quiet market days. AAPL is testing new highs.

AAPL SHORT OPPORTUNITY Apple seems to be reaching its major resistance trendline. Seems to be overbought with higher RSI and Simple moving average. Apple, in general, follows this particular channel that I posted not too long ago. Since its the same channel, historical patters will show a bearish outlook of the stock due to its current price mark.

AAPL Runs to New All-Time HighsHeavy buybacks with HFT action has driven AAPL to new highs with a steep Angle of Ascent™. Pro Traders are likely to take profits soon.

AAPL Going ShortApple is in an strongest channel.
Representing two plans...
It could have a huge down for later broke that channel and make new historical highs.
Risk managmenten is our friend.!!

Will Apple begin to Fall?Hello, Traders!
Monfex is at your service and today we overview Apple .
AAPL is forming an ascending wedge which target is the local support zone and 50% Fibonacci with MA200. It also can be a double top pattern inside this wedge .
The local resistance zone ~ $249.6
The local support zone ~ $235
Market Cap
1124.191
Share your thoughts, ideas about the market under the chart.
Watch for our Updates to be the first who gets well-timed signals !
GOOD LUCK AND LOTS OF PROFITS !!
Disclaimer
This report is for information purposes only and should not be considered a solicitation to buy or sell any trading assets. Monfex accepts no responsibility for any consequences resulting from the use of this material. Any person acting on this trade idea does so entirely at their own risk.

AAPL - Irrational Exuberance - Watch for a Pullback - Gapfiller Quick one on AAPL:
- Tagging 3 ATR on the weekly and daily time frames, suggesting that a pullback is likely
- The trend (as shown from the curved line) has gone parabolic, which is impossible to continue on that path
- Price has become detached from the 9 ema, suggesting that the run has reached a stopping point (most likely for a breather before moving higher)
- There is also a gap on the daily chart visible at around $232-$231, which is likely to be filled
My target would be around the $235 range on the daily time frame (a pullback to the 21 ema)
My broader target (requires a more substantial pullback to occur) is around the $230 range (retracing to the 9 ema on the weekly time frame).
Bear in mind that when the weekly candle ticks over, these targets will change (because they are based on the dynamic targets of the moving average).

APPLE (AAPL) | Take Profit Area For Short-, Mid Term Holders!Hi,
If you have struggled to take out some profits from Apple then here is a possible hint for you.
It could be also a possible "short" opportunity but definitely, if you have a "long" position and you cannot hold it for the long term (you need money or something...), then the area between $250-$260 should be your TP.
Several channels upper trendlines starts to work as a resistances. The middle number of $250 should play an important role in this area. Some AB=CD pattern D points are inside the marked area. Basically, this area can stop the current rally.
Regards,
Vaido

Apple Trading Vision : to the New Records !Hello, dear stock Trader!
Monfex is at your service and today we overview Apple.
AAPL broke the strong resistance level - All-Time High , has already tested it locally and going to the 127% Fibonacci level. But we have on many indicators the strong bearish divergence and is sign that near $ 250-255 we will can suggest a sell position to the support zone of levels Fibo and the support line ~ $ 225-220 .
Market Cap
1068.379B
Share your thoughts, ideas about the market under the chart.
Watch for our Updates to be the first who gets well-timed signals !
GOOD LUCK AND LOTS OF PROFITS !!
Disclaimer
This report is for information purposes only and should not be considered a solicitation to buy or sell any trading assets. Monfex accepts no responsibility for any consequences resulting from the use of this material. Any person acting on this trade idea does so entirely at their own risk.


Analysis of APPLE 15.10.2019The price above 200 MA, indicating a growing trend.
The MACD histogram is above the zero lines.
The oscillator Force Index is above the zero lines.
If the level of resistance is broken, you should follow the recommendations below:
• Timeframe: H4
• Recommendation: Long Position
• Entry Level: Long Position 237.50
• Take Profit Level: 240.00 (250 pips)
If the price rebound from resistance level, you should follow the recommendations below:
• Timeframe: H4
• Recommendation: Short Position
• Entry Level: Short Position 231.60
• Take Profit Level: 230.00 (160 pips)
USDJPY
A possible long position at the breakout of the level 108.50
GOLD
A possible short position in the breakdown of the level 1487.00
USDCHF
A possible long position at the breakout of the level 0.9995
EURUSD
A possible short position in the breakdown of the level 1.1000

My AAPL play has worked out GREAT!YouTube: Dumb Money Trader
twitter.com/dumbmoneytrader
facebook.com/dumbmoneytrader (New FB group. Very few restrictions, unlike a lot of other investment groups)
www.dumbmoneytrader.com

APPLE (AAPL) | ~15% Growth Potential!Hi,
Historically, September has been a great month for Apple. For short-, mid-term traders/investors it could be a great spot to buy it.
After the fall, which occurred at the end of 2018, the price has started to move on a pretty clean upwards channel(s).
The last Weekly candle close (~213) was highest since October 2018 and it shows that the buying pressure is quite high.
Different channels and criteria will cross at 244 which is also the major target!
Regards,
Vaido

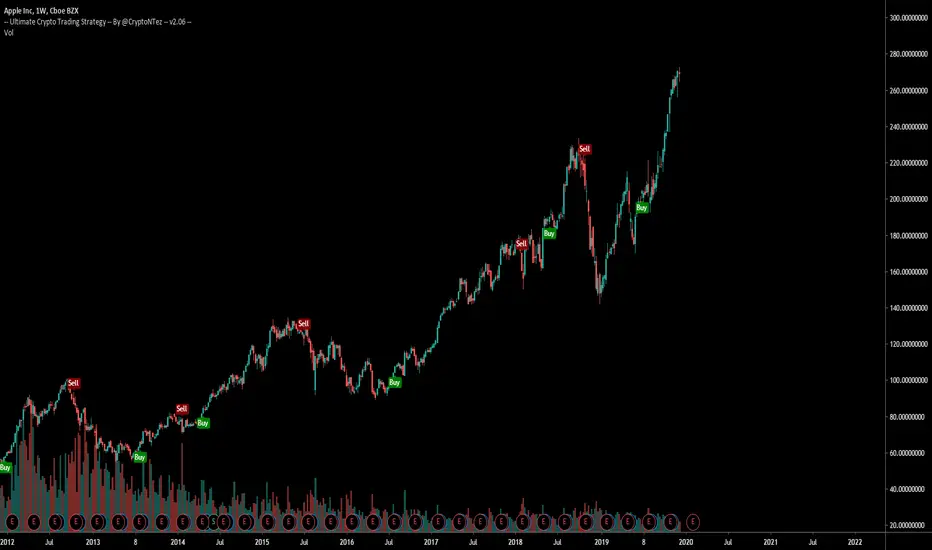
Apple: Testing All Time Highs. Next Target $300-$350.AAPL is a step closer this week to its $233.47 All Time High. The market is skeptical, investors proceed with caution on this Resistance especially since the 1W RSI is just above the 70.000 barrier, but should they?
History shows that every time the 1W (weekly) RSI of Apple Inc breaks 70.000 after after a specific sequence and following a Higher Low on the long term Channel Up that started in 2012, it moves on to new highs, specifically chasing to price a new Higher High within the Channel.
It is astonishing how the date range (time interval) of each of those times (when the RSI hit 70.000 after a Higher Low) is exactly 987 days. Assuming the lowest % increase out of the past 2 occurrences takes place (i.e. +145%), we have a Target Zone for Apple at $300 - $350.
** If you like our free content follow our profile (www.tradingview.com) to get more daily ideas. **
Comments and likes are greatly appreciated.

Apple inc Possibility of next move."In the name of Allah, the Most Gracious, the Most Merciful".
Apple inc Possibility of next move.
Note: This is only for Educational purposes; this is not investment advice.
"Pain is silence"
Thanks
Adil Khan.

Apple near All-Time Highs!Hello, Traders!
Monfex is at your service and today we overview AAPL.
What do you expect from Apple ?
Loud presentation, nothing special, no new products, no revolutionary technologies... Stocks simply continue to grow, the artificiality of this growth is very felt.
On the chart, we see how a small bullish flag was formed, inside a large ascending channel, which is aimed at the previous highs and highs for the entire history of Apple of trading on the stock exchange.
A deep triple bearish divergence is visible on the RSI indicator, which gives us reason to doubt the continued growth of such a strong mark of price resistance.
The expected reversal is possible near the zone of annual resistance of the zone and at the resistance of the ascending channel, upon reaching which it will be an overly strong sell signal!
By breakout the support line we can assume a target near ~ $146.
Share your thoughts, ideas about the market under the chart.
Watch for our Updates to be the first who gets well-timed signals !
GOOD LUCK AND LOTS OF PROFITS !!
Disclaimer
This report is for information purposes only and should not be considered a solicitation to buy or sell any trading assets. Monfex accepts no responsibility for any consequences resulting from the use of this material. Any person acting on this trade idea does so entirely at their own risk.

APPL _ I saw a pattern In my experience, such triangles fall down.
I saw a pattern and decided to make a post to save the idea

