Appleinc

Ending with some stocks for the week...Waiting for breakout on either side, short term targets.
NASDAQ:AAPL

Relaction between apple stock and factsRelaction between apple stock and facts, movies and new devices.

Apple Inc Daily Update (15/8/17)This a tough one.
But we have to agree upon something that, it looks pretty weak as well.
Now I want to wait till it goes below 158.1x first, and I will see if it start to goes below 150. (To stay BEAR, we need it to stay below 158.1x)
Once 150 is broken strongly, going to 143 is the matter of time.
Trade Safe,
s0nic
Disclaimer :
This analysis not include personal feeling/opinion, and pure base on technical analysis
Trading foreign currencies can be a challenging and potentially profitable opportunity for investors. However, before deciding to participate in the Forex market, you should carefully consider your investment objectives, level of experience, and risk appetite. Most importantly, do not invest money you cannot afford to lose.
please inform me with post a comment if it reach some critical point/break pattern, reach target/reach stop level.
or if there is any question about this analysis/need new update.
Because im not monitoring this chart all time.

Where Will APPL go NEXT?AS explained on the chart, APPL's Stock has
TWO POSSIBILITES. Quite clear huh? It's either bullish or bearish, but how much?
FIRS we get a retrace towards 147-148.50.
if we get this, with a bullish divergence on 1 hour chart,
I believe we are headed to 156.78 (first target)
if we retrace BELOW 147-148.50,
our three targets ARE
first- 142.50 area
second- 138.60 area
third- 130.75


APPLE : Double top When can notice a bearish divergence on the RSI;
If the market breaks the 140.5 level, the divergence will be confirmed.
The final target is 137.24.


APPL - Time to short Apple?Apple just hit top of the trendline at about $140, indicating a possible BIG shorting opportunity.
MACD is very bearish ... WaveTrend also... and the RSI is insanely high at 88-ish, and the volume seems to be going down slowly.
All indicators telling me to SHORT.... And if thats not enough, the SP500 just hit the top of the trendline at 2400 yesterday!
My first target will be $132... If indicators are still bearish at this point, I will move target to $122
Wish me luck :)


AAPL @ 1h @ new BIG EARNING GAP should be defend, at firstTake care
& analyzed it again
- it`s always your decision ...
(for a bigger picture zoom the chart)
Best regards :)
Aaron

APPLEOn this moment were sold over 700 millions Iphones and it is getting closer to 1 billion. Every year created big boom aroud this as well. My offer to open position before the big investment inside the company.
APPLE New Max HighIf apple beat with decision the 120 level, could touch the $134 level and even make a new high.

AAPL @ daily @ are 120$ only a quest of time this week ?Take care
& analyzed it again
- it`s always your decision ...
(for a bigger picture zoom the chart)
Best regards
Aaron


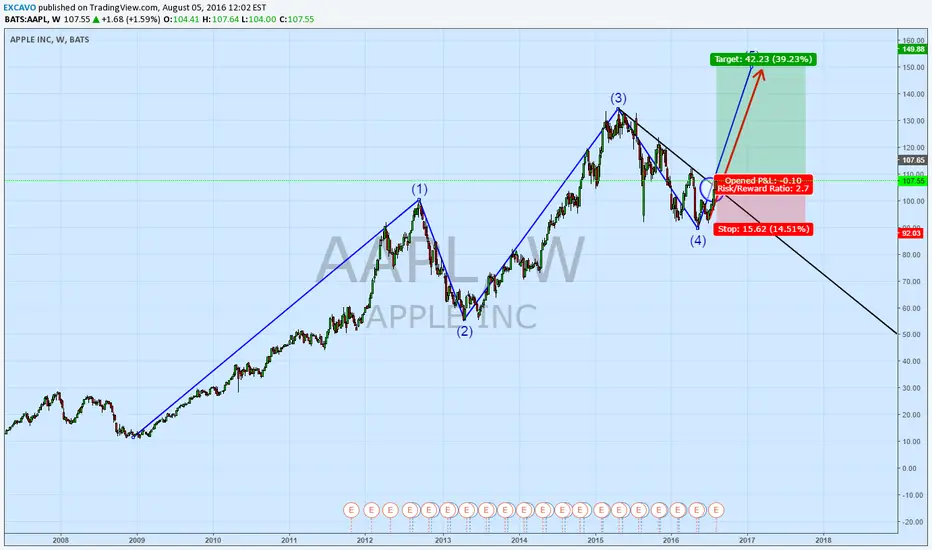
AAPL Long 2016/20172016/11/17. Apple stock predictions for next months and years.
Apple stock price predictions for November 2016.
The forecast for beginning of November 113. Maximum value 124, while minimum 107. Averaged Apple stock price for month 115. Price at the end 117, change for November 3.54%.
Apple stock predictions for December 2016.
The forecast for beginning of December 117. Maximum value 128, while minimum 114. Averaged Apple stock price for month 120. Price at the end 121, change for December 3.42%.
Apple stock price predictions for January 2017.
The forecast for beginning of January 121. Maximum value 135, while minimum 119. Averaged Apple stock price for month 126. Price at the end 127, change for January 4.96%.
Apple stock predictions for February 2017.
The forecast for beginning of February 127. Maximum value 137, while minimum 121. Averaged Apple stock price for month 129. Price at the end 129, change for February 1.57%.
Apple stock price predictions for March 2017.
The forecast for beginning of March 129. Maximum value 143, while minimum 127. Averaged Apple stock price for month 134. Price at the end 135, change for March 4.65%.
Apple stock predictions for April 2017.
The forecast for beginning of April 135. Maximum value 137, while minimum 121. Averaged Apple stock price for month 131. Price at the end 129, change for April -4.44%.
Apple stock price predictions for May 2017.
The forecast for beginning of May 129. Maximum value 143, while minimum 127. Averaged Apple stock price for month 134. Price at the end 135, change for May 4.65%.
Apple stock predictions for June 2017.
The forecast for beginning of June 135. Maximum value 136, while minimum 120. Averaged Apple stock price for month 130. Price at the end 128, change for June -5.19%.
Apple stock price predictions for July 2017.
The forecast for beginning of July 128. Maximum value 142, while minimum 126. Averaged Apple stock price for month 133. Price at the end 134, change for July 4.69%.
RED-Weekly
BLUE-Monthly Channel from 2009
Purple- Daily Channel

AppleApple is the most poppular technology company in the word. The largest banks from USA invest to the company. It works on US National Security Agency. The company does not produce anything innovative phones, laptops, Apple watches.So, what is innovative? The marketing with the help of which occur great technical sales. But this is just a small part of its market capitalization. At the moment, there is another bubble inflating . By this, I believe that the Apple as a financial instrument is not interesting to a sensible investor.
SMA 20 complements by SMA 200The SMA 200 is used in daily charts and 15 minutes intraday charts. Stocks with SMA 20 (drop) represents a good starting point to be sold.
Apple alert this clear signal, stay tuned for the next moves in the price ... forewarned!
Stay tuned for more info, visit: www.southment.com
Sign up for The Big News


APPLE @ daily Chart @ with new Yearly High (last Monday)
from 2016-04-24 to 2016-07-26
- between 89.46 and 101.01
w-formation was created
Usually a w-formation is an trend-reversal-formation.
And this w-formation was even created under the extended downside trendline after alltime highs in 2015
132.84 (2015-07-21): start of the downside trendline after alltime highs in 2015
123.60 (2015-11-04): end of the downside trendline after alltime highs in 2015
112.71 (2016-09-23): Friday (last trading) Closed
After the breakUP of the downside trendline after alltime highs in 2015 the breakUP was etablished by two new lows
(a) even above the w-formation (101.01)
(b) even above the downside trendline after alltime highs in 2015 (102.24)
Right here right now we got a short term trading box
116.19 (2015-09-19): yearly high of 2016
112.71 (2016-09-23): Friday (last trading) Closed
111.55 (2015-09-23): intraday low of friday
To trade new yearly highs is the mid-term trading zone essentiel
False breakOUT of the downside trendline after alltime highs in 2015
112.71 (2016-09-23): Friday (last trading) Closed
112.38 (2016-04-14): highs while the false breakOU-formation in april`16
108.07 (2016-04-17): lows while the false breakOU-formation in april`16
1st target is 119.19
112.71 (2016-09-23): Friday (last trading) Closed
only if the share falls while october (or while the next 4th quarter`16)
under 103.91 (gap before the w-formation was created)
under 102.87 (gap after the w-formation was created)
under 102.47 (low after the the w-formation was created)
the big technical picture will not be constructive. So even above 102.47, even above 102.87 & even above 103.91 the big techical picture is still sugessting higher prices. Higher prices until 119.19 and higher - while this year 2016.
Long-Term BUY Signal
Meanwhile also the 100 SMA is only 70 Cent under the 200 SMA !!!
Usually a 100 SMA upside cross over the 200 SMA is suggesting also higher prices ...
112.71 (2016-09-23): Friday (last trading) Closed
102.06 (2016-09-23): 200 Daily SMA
101.36 (2016-09-23): 100 Daily SMA
Take care
& analyzed it again
- it`s always your choice ...
Best regards
4XSetUps

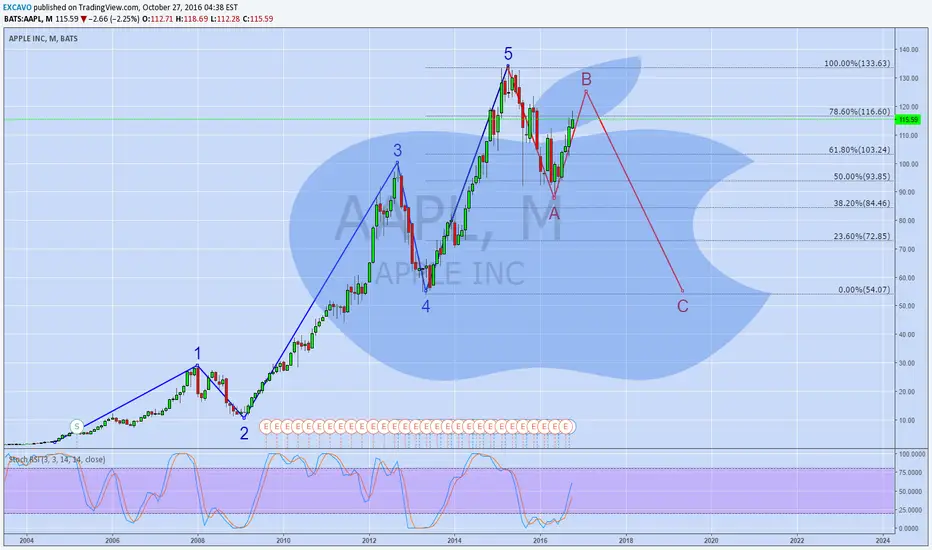
APPLE @ basic Scenario since ATH (freestyle)134.63 alltime high
132.84 start of the downside trendline
123.79 end of the downside trendline
123.79 trading box between the downside trendline & 1st low after alltime high
119.94 trading box between the downside trendline & 1st low after alltime high
119.19 low price of the alltime high trendreversal formation
112.52 trading box after false breakout of the downside trendline
108.13 trading box after false breakout of the downside trendline
The 1st target ist 119.19
- but i am thinking that the share will oscialating between 112.52 & 119.19 in september`16.
In the 3rd Quarter should be the trading box (119.19 & 123.79) only a question of time. So that the shares should raise up into new alltime highs 2017 - even 134.62
Take care
& analyzed it again
- it`s always your choice ...
Best regards
4XSetUps

AAPL pulling back to HELLA valueAppears as tho AAPL should now pullback to key support for a retest of the confirmed wedge aswell as the fib retrace. You could certainly short this on the way down as well.
Look for AAPL to pullback with the S&P500, with both likely bottoming around the same time during september.
