Appleinc

The Big Apple Goes Rotten?I've been following Apple over the last 6 months and I can't help but shake the feeling this ascending broadening wedge "could" end up playing out. I know it's incredibly popular to be bearish now, which is usually a sign for me to put on the contrarian hat, but I still see this a decent probablity.

Apple stonks possible roundtripI checked M1 and W1 timeframes in chart just to set possible next supports and resistances in order to trace a roundtrip to long-term invest for Apple stonks.
We can also see in chart that squeeze momentum has a bearish divergence BUT we can also see that CRSI is overselled which makes me think about current bearish trend has not enough strength to imagine (for now) a big price fall.
Also Wyckoff gives us a clue about future moves for Apple stonks because we can expect SOW in Phase B after ST (not confirmed yet) but it seems a typical Wyckoff’s Distribution Schema.
As per expected moves are bearish and bullish ones so i decide to tag this idea NEUTRAL.

simple signal moving average on largest cap is remaining sellthis is a big chunk of the market all byitself. if we look to it for broader implication we find most equity is still a sell. im not looking to long stocks right now until $TICK is far below the price again.

Apple - Will next earnings reinforce the selling pressure?After the 242% run-up from its lows during the 2020 crash to its high in January 2022, Apple gave up almost 20% in regard to the current value. In addition to that, the introduction of the new iPhone 14 has not created much hype among consumers and market participants. Since the release of the new product, the price has continued to be choppy and seemingly returning to its 2022 lows.
Because of that, we will continue to monitor the Apple stock in the coming weeks and provide a more detailed update on the price and its potential future direction. However, at the moment, we abstain from setting a price target for this stock title.
Illustration 1.01
Illustration 1.01 displays the daily chart of Apple stock and two moving averages, 20-day SMA and 50-day SMA. In addition to that, two yellow arrows point to natural retracements toward the price's moving averages, acting as a correction of the downward move. If the price fails to break above the 20-day SMA and then subsequently above the 50-day SMA, then it will add to a bearish consensus.
Illustration 1.02
The picture above shows the weekly chart of Apple stock and two simple moving averages; now, 20-week SMA and 50-week SMA. The yellow arrow pinpoints the similar retracement toward (and even above) these SMAs; in this particular example, the retracement represents a strong correction of the downtrend.
Please feel free to express your ideas and thoughts in the comment section.
DISCLAIMER: This analysis is not intended to encourage any buying or selling of any particular securities. Furthermore, it should not be a basis for taking any trade action by an individual investor. Therefore, your own due diligence is highly advised before entering a trade.

AAPL over the hill. AAPLOut of momentum, with massive velocity to the downside, volatility shift to the negative on the 4 hourly. Betting on Elliott Wave C here. Down, down, down. SPX picture for background.
We are not in the business of getting every prediction right, no one ever does and that is not the aim of the game. The Fibonacci targets are highlighted in purple with invalidation in red. Confirmation level, where relevant, is a pink dotted, finite line. Fibonacci goals, it is prudent to suggest, are nothing more than mere fractally evident and therefore statistically likely levels that the market will go to. Having said that, the market will always do what it wants and always has a mind of its own. Therefore, none of this is financial advice, so do your own research and rely only on your own analysis. Trading is a true one man sport. Good luck out there and stay safe.

AAPL Apple Inc. Technical Rebound before $130Maybe the timing wasn`t perfect, but AAPL eventually reached the price target and went even lower:
Now i am expecting a technical rebound, Apple being oversold on the RSI; before dropping to $130 once again.
Looking forward to read your opinion about it.

Apple for SaleAfter almost a V-Shape recovery in the stock, it reached the point of resistance and now showing it's reaction. Expecting a follow through to the downside with 150 as the first target.

AAPL Long Re posting This as my last one seems to have been blocked for some reason. AAAPL Appears to be approaching oversold territory, $200 price target or a potential continuation below Sl.

Things are getting a bit fruity (AAPL)Apple
Short Term
We look to Buy at 153.98 (stop at 149.64)
Preferred trade is to buy on dips. Previous support located at 153.00. The 50% Fibonacci retracement is located at 152.51 from 128.86 to 176.15. The 50 day moving average should provide support at 155.40.
Our profit targets will be 163.76 and 176.00
Resistance: 165.00 / 176.00 / 180.00
Support: 153.00 / 140.00 / 129.00
Disclaimer – Saxo Bank Group. Please be reminded – you alone are responsible for your trading – both gains and losses. There is a very high degree of risk involved in trading. The technical analysis, like any and all indicators, strategies, columns, articles and other features accessible on/though this site (including those from Signal Centre) are for informational purposes only and should not be construed as investment advice by you. Such technical analysis are believed to be obtained from sources believed to be reliable, but not warrant their respective completeness or accuracy, or warrant any results from the use of the information. Your use of the technical analysis, as would also your use of any and all mentioned indicators, strategies, columns, articles and all other features, is entirely at your own risk and it is your sole responsibility to evaluate the accuracy, completeness and usefulness (including suitability) of the information. You should assess the risk of any trade with your financial adviser and make your own independent decision(s) regarding any tradable products which may be the subject matter of the technical analysis or any of the said indicators, strategies, columns, articles and all other features.
Please also be reminded that if despite the above, any of the said technical analysis (or any of the said indicators, strategies, columns, articles and other features accessible on/through this site) is found to be advisory or a recommendation; and not merely informational in nature, the same is in any event provided with the intention of being for general circulation and availability only. As such it is not intended to and does not form part of any offer or recommendation directed at you specifically, or have any regard to the investment objectives, financial situation or needs of yourself or any other specific person. Before committing to a trade or investment therefore, please seek advice from a financial or other professional adviser regarding the suitability of the product for you and (where available) read the relevant product offer/description documents, including the risk disclosures. If you do not wish to seek such financial advice, please still exercise your mind and consider carefully whether the product is suitable for you because you alone remain responsible for your trading – both gains and losses.

APPLE: Detailed Fundamental Analysis - Long viewWith a market capitalization of $2.8 trillion, some investors may have a hard time realizing that Apple stock could be a good buy today. But investors may change their minds after scrutinizing the company's underlying cash flow relative to this valuation, as well as Apple's growth opportunities.
While investors will want to do their own due diligence before buying the stock, here are some eye-opening points about the company that will make it easier for you to get started.
Incredible cash flow
Apple's free cash flow, which is the cold, hard cash left over after all regular business operations and capital expenditures, was about $108 billion in 12 months. That implies that the stock trades at a ratio of 28 to free cash flow-a reasonable, if not an attractive valuation for a company with a diverse product mix, a loyal customer base, and a long history of disciplined and value-creating capital allocation decisions by management.
Apple's substantial cash flow gives it ample opportunity to choose how it creates shareholder value. While some cash from operations is reinvested back into the business through capital expenditures, the remaining free cash flow allows the iPhone maker to either pay dividends, repurchase stock or do both. Apple, of course, has done both for years. Over the past 12 months, the company has spent $91 billion on stock buybacks and paid out $15 billion in dividends over the same period.
Despite Apple's aggressive program to return capital to shareholders, the company still has $179 billion in cash and marketable securities. Moreover, even if you subtract the company's debt from its cash position, its net cash position is still $60 billion.
High demand
Apple's strong earnings performance at a time of global macroeconomic uncertainty is also impressive. The tech company's fiscal Q3 earnings rose 2 percent YoY -- and that's on top of a 36 percent increase in the year-ago quarter.
That growth, however, still underestimates the demand for Apple products. In fiscal Q3, sales were limited to production. "Macs and iPads were so limited in supply that we didn't have enough production to meet demand," Apple CEO Tim Cook said during the company's fiscal Q3 earnings call. Cook even said that iPhones, the company's largest segment, saw no signs of weakening demand because of macroeconomic factors.
Significant growth potential
The last point is perhaps the most important. There is one area in which the company seems to have room to strive: monetizing its installed base of active devices. Apple executives see its installed base as a key growth lever for the company going forward. " is the engine of our company, and it continues to grow," Apple CFO Luca Maestri explained during the company's latest earnings call. He also noted that it has reached "historic highs in every geographic segment, in every product category.
The larger the installed base, the more users the company is able to monetize through its own and third-party services. And Apple is doing just that. "The number of transactional accounts paid accounts, paid subscriptions is growing, so the level of engagement continues to grow," Maestri said.
That trend should help Apple's services segment, which accounts for about a third of the company's gross revenue, continue to post double-digit YoY growth rates in most quarters for the foreseeable future."
So is Apple justifying its $2.8 trillion market capitalization? Well, it does. Moreover, there is likely a clear path to $3 trillion or more. And thanks to stock buybacks, the stock price could grow faster than Apple's market capitalization.

$AAPL $AAPL - Who doesn't love a good 'Juicy' $APPL?!
We at clear resistance zone, I'd ideally like a PB.
Key Tip: You can't actually learn by those Instagram profiles full of 'strategies'. The only way of learning how to trade would be getting hands on experience by validated traders with track record. There're various stages in learning it's like mountain you learn the technicals, fundamentals and then you got the psychology aspects which a lot of manipulations in general happens regarding in the market and outside of the market, which very few understand... This industry is full of 'social media gurus' but make sure you tread carefully.
Here's a great statistic for you: 80% of all day traders quit within the first two years.
All the best,
TJ

$AAPL - What's going to happen next?LT View: $AAPL - What's going to happen next?
This a LT view of APPL - Monthly chart we are within a range, now here's thing why am I looking at stocks right now well as we have the key rates escalating higher, the further I want be keeping an eye on LT stocks I want part of my portfolio and one of them is APPL It's a company I firmly believe it isn't just 'phones' there's various other stocks that's very interesting within the company and there so many others but this is one of them I am showing you today.
Now we are technically within a range of: H = 160 / L = 130 a break to either direction is my key intrust - i'd love a dip below 50 EMA 110 Areas. However, it is one I am keeping an eye on technically and fundamentally as we see Nasdaq brewing nicely as well.
TJ
(Not Investment Advice)

AAPL Apple Inc Options Ahead Of EarningsLooking at the AAPL Apple Inc options chain today, i would buy the $130 puts with
2023-1-20 expiration date for about
$5.20 premium.
Looking forward to read your opinion about it.

Short term Target 153.27I got a long signal in weekly chart from my RSI strategy.
TP 153.27
SL 138.93

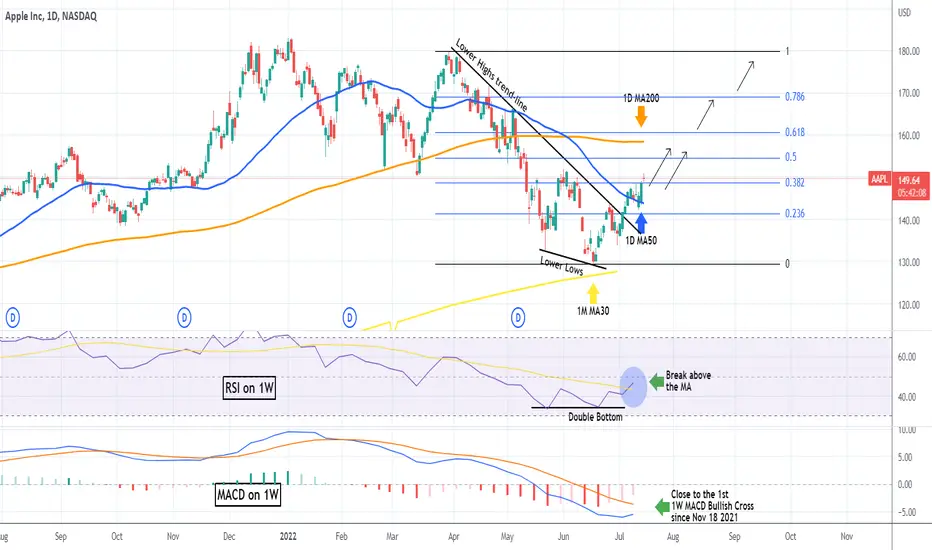
AAPLE holding the 1D MA50, targeting 158 short-term.Apple (AAPL) had a very strong 1D green candle yesterday, rebounding off the 1D MA50 (blue trend-line), which has been the Resistance since April 21, turning it into the Support. The break-out took place after the RSI on the 1W time-frame broke above its MA line on the widest margin since January 04. With the 1W MACD about to make the first Bullish Cross since November 18 2021, this could be the long-term buy signal that the market has been waiting for, for a sustainable recovery.
The technical short-term target is the 1D MA200 (orange trend-line) at around 158.00. The Fibonacci retracement levels can provide the next targets and pull-back/ buy levels. Overall the stock has the potential to reach its All Time High level before the end of the year.
--------------------------------------------------------------------------------------------------------
Please like, subscribe and share your ideas and charts with the community!
--------------------------------------------------------------------------------------------------------
APPLE FORECAST (DEPRECIATED)SPX500 declined in further projection on Yr-to-Yr basis due to investor's doubt on economic recession.
My POV's on AAPL towards 70$ price depreciated.
P/S: THIS IS NOT AN INVESTMENT ADVICE. PLEASE CONSULT ON YOUR OWN ANALYSIS.

Apple Analyze 🍎!!!(Timeframe 4H)I expect that 🍎 Apple 🍎will go UP at least to around 148.7$ or even near 200 SMA ( Daily Timeframe ).
I specified the growth 🎯 Targets 🎯 in my chart.
🎯 Target 1 🎯: 153$ until 148.7$ (around 148.7$ , we can have a Bearish AB=CD Harmonic Pattern ).
🎯 Target 2 🎯: Around 158$ = Near 200 SMA ( Daily Timeframe )
Apple Analyze Timeframe 4H ( Log Scale /Heikin Ashi) ⏰
🟢 Support zone 🟢: 145.1$ until 138$
Do not forget to put Stop loss for your positions (For every position you want to open).
Please follow your strategy , this is just my idea, and I will be glad to see your ideas in this post.
Please do not forget the ✅' like '✅ button 🙏😊 & Share it with your friends, Thanks, and Trade safe

$AAPL Apple Inc Stock is giving MEGA Bullish Patterns$AAPL Apple Inc. is showing multiple bullish indicating reversal patterns.
Lots going on in this chart lets review:
1. I'm spotting a FALLING WEDGE (marked in white). This could drop lower and tap the bottom trendline on the wedge for a third time before reversing, however, it held the $135.50 support Friday indicating a higher probability for upside. The first target/resistance level on the falling wedge is marked in white horizontal line.
2. Diamond bottom pattern is forming. Any sideways movement will only mark the probability of this pattern higher for a breakout.
3. Inverse Head & Shoulder. IF THE FALLING WEDGE reaches the first target and rejects, that will form another neckline to a inverse head and shoulder and the rejection could form the right shoulder. So far there is a more slanted inverse h&S that has currently formed on the chart, in addition, the selling volume is highest on the left shoulder indicating a textbook inverse H&S.
The RED bar marked near the top of the high is a GAP.
I'm adding APPLE to the top of my watch list for Tuesday morning and I will be observing these patterns closely for breakouts.
Apple has taken a big hit as all of the tech sector has in the stock market.
As far as fundamentals, no brainer that Apple is a leader in TECH.

APPLE INC. AAPLHello Traders,
prices has formed a M pattern and retested the neckline.
You can see on the chart how I'll trade this pattern on NASDAQ:AAPL
Respect stop loss.
Apple Should Mark the bottom of the markets here. AAPL AAPL at about $130 is a beautiful channel that should mark the bottom of the markets, we're almost touching it.

Apple needs more juiceApple
Short Term - We look to Sell at 154.48 (stop at 160.14)
Further downside is expected although we prefer to set shorts at our bespoke resistance levels at 155.00, resulting in improved risk/reward. Posted a Double Top formation. The bias is still for lower levels and we look for any gains to be limited. Intraday rallies continue to attract sellers and there is no clear indication that this sequence for trading is coming to an end.
Our profit targets will be 137.56 and 130.14
Resistance: 155.00 / 171.00 / 182.00
Support: 137.00 / 123.00 / 118.00
Disclaimer – Saxo Bank Group. Please be reminded – you alone are responsible for your trading – both gains and losses. There is a very high degree of risk involved in trading. The technical analysis, like any and all indicators, strategies, columns, articles and other features accessible on/though this site (including those from Signal Centre) are for informational purposes only and should not be construed as investment advice by you. Such technical analysis are believed to be obtained from sources believed to be reliable, but not warrant their respective completeness or accuracy, or warrant any results from the use of the information. Your use of the technical analysis, as would also your use of any and all mentioned indicators, strategies, columns, articles and all other features, is entirely at your own risk and it is your sole responsibility to evaluate the accuracy, completeness and usefulness (including suitability) of the information. You should assess the risk of any trade with your financial adviser and make your own independent decision(s) regarding any tradable products which may be the subject matter of the technical analysis or any of the said indicators, strategies, columns, articles and all other features.
Please also be reminded that if despite the above, any of the said technical analysis (or any of the said indicators, strategies, columns, articles and other features accessible on/through this site) is found to be advisory or a recommendation; and not merely informational in nature, the same is in any event provided with the intention of being for general circulation and availability only. As such it is not intended to and does not form part of any offer or recommendation directed at you specifically, or have any regard to the investment objectives, financial situation or needs of yourself or any other specific person. Before committing to a trade or investment therefore, please seek advice from a financial or other professional adviser regarding the suitability of the product for you and (where available) read the relevant product offer/description documents, including the risk disclosures. If you do not wish to seek such financial advice, please still exercise your mind and consider carefully whether the product is suitable for you because you alone remain responsible for your trading – both gains and losses.

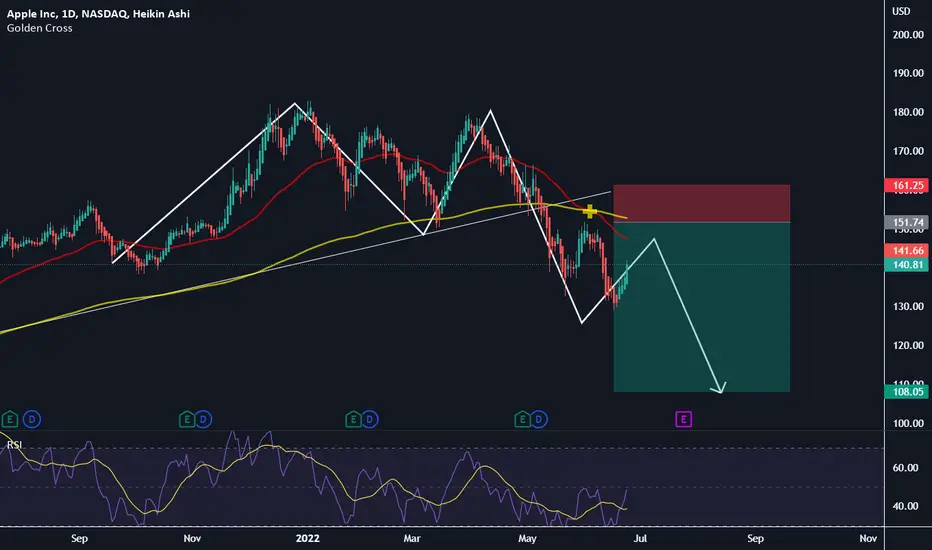
AAPL Apple : Short-term buy to key retest level 16.5Very straight-forward technical analysis .
Apple broke below substantial support trend-line beginning of May 2022.
The support was stretching higher with higher lows since early 2020, this changed just about a week ago.
The drop below the trend-line continued with a sharp drop from 155 to 139 at the lowest.
Connecting short-term lows provided support around 139.
Currently, short-term highs and lows converge into a 'falling wedge' pattern which may be bullish .
The only confirmation of bullish substantial movement would be with a break higher than 155 back to the long-term trend-line and therefor the breakout up of the 'falling wedge'.
A more likely scenario and the projection of this chart, is a retest of 155 post breakout - Which once retest confirms, would be the continuation of the down-trend.
In summary, Apple with high probability is going back to retest the long-term breakout, which makes for a very short-term buy.
**We must remember Apple went from $54 in March 2020 all the way to $180 early 2022.
There's plenty of room for Apple to correct down.
-----------------------------------------------------------------------------------------------------------------------------------------------------------
Thank you so much for reading! If you found my idea useful, please like and follow! It would mean a lot :)
I encourage you to do your own research and be cautious when trading, this is not financial advice but meant for educational purposes.
My goal is to help as many traders as I can become a profitable investor.
------------------------------------------------------------------------------------------------------------------------------------------------------------
