Apple, Will we see 150$ ???Hello traders, Hope you're doing great. What are your thoughts about
AAPL ?
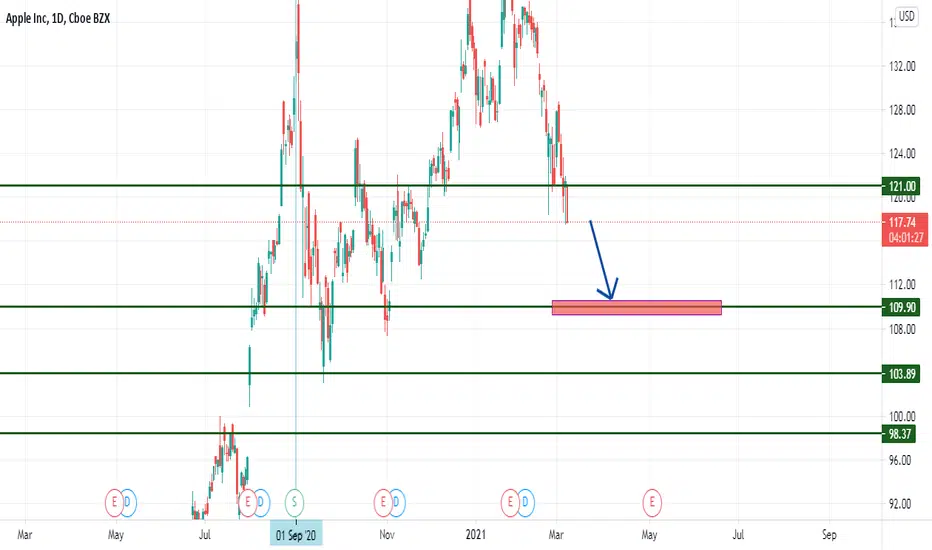
Our last analysis went exactly as we predicted and hit our target; But what's the next target ?
For upcoming weeks, I expect an upward correction at first and after that I expect another SELL OFF situation in the market that causes a huge drop in stock market, my first Target is 157$.
This post will be Updated.
Trade Safe and have a great week.
Applesell

ApplePair : AAPL - Apple Index
Description :
Completed " 12345 " Impulsive Waves
Resistance Level
Break of Structure
RSI - Divergence
Rising Wedge as an Corrective Pattern in Short Time Frame

AAPLPair : Apple Index
Description :
Completed " 12345 " Impulsive Waves
Break of Structure
RSI - Divergence
Fibonacci Level - 161.8%
Rising Wedge in Short Time Frame

APPLE will sell like punctured balloonAPPLE - BEARISH INTERNAL CYCLE
Price crossed and it's on Panic Area (-0.382 - 0.00%) from Bearish Internal Cycle
I Suggest open SELL positions / take profits from bought stocks at current price
- SL: ABOVE PANIC LIMIT AREA (195.81)
- TP 1: 150.00 - 144.00 (50-61 %)
- TP 2: 128.00 - 122.00 (100 %)
ADDITIONAL CONFIRMATIONS:
- STAGE 3 => STAGE IV @ US10Y

AAPL Apple waiting for selling a stop order !According to my chart analysis AAPL Apple will go down if price reached entry level .

APPLE SELLPeace be upon you, merchants. Apple stock is negative. with a fracture. Double BOTTOM. It is a strong model and was unable to break a very strong resistance. At the price of 156. There is the possibility of re-testing. The price is 150. And re-disembarkation. to the level of 143. what do you think

Is Apple about to be 'bitten'?Apple is one of the companies whose stock price is overvalued, and the company is facing several severe issues:
1. Big tech layoffs. If US tech is doing quite poorly and companies are laying off people, they probably won't buy new equipment or software. The fired tech workers probably won't be buying stuff for themselves either, and neither will those that see their colleagues fired.
2. Apple's production in China faces significant problems due to lockdowns or because the 'employees' are revolting. These disruptions hurt the reliability of Apple, as well as its image. Unfortunately, many employees are working and living in awful conditions, which is being exposed. Many ESG funds that hold Apple could end up having to dump their shares based on these concerns.
3. Some US politicians are increasingly worried about the connections between Apple and the CCP. With Apple 'threatening' to remove Twitter from its Appstore while supporting the CCP in an era where tensions between US and China aren't great, we could see Apple face more pressure to move away from China. That could increase their costs significantly while also disrupting production even further.
4. As retail consumers are affected by inflation and high-interest rates, they will spend less on buying new stuff, and many devices/apps aren't necessary. At the same time, Apple has been raising its prices due to increased costs (of production), which might further incentivize customers not to purchase their products/services. As if these weren't enough, some of its new products aren't that much of an upgrade to the previous versions.
5. As the world is moving closer toward open source and open technologies/marketplaces, the 30% tax on the Apple app store looks worse and worse by the day. Based on the above, the free market and politicians in the US might try to break Apple's monopoly, which could initially lower its revenue.
6. Current Apple valuation is 3.4x that of the entire crypto market (stablecoins excluded). This is just too large.
AAPL is trading below all its major moving averages, has broken its old uptrend, and has plenty of room to move down toward that major gap at 96$. Most major US companies have fallen more than 30% and have filled many significant gaps, yet Apple has not. Therefore it is possible to see the stock price go down to those levels in the next few months.

AAPLNot financial advice. The essence of investing & trading is the intelligent and patient preying on the greed, fear, impatience, addiction and ignorance of the majority. It's definitionally Darwinian.

APPL Time to sellafter we have had elliott wave LH '' Low high '' we will see a continuation of the downtrend after a fundamental and techinical analysis


AAPL Time to sellAfter the effect of the rejection on a strong resistance and the confirmation of the breakout of the VWAP we can take the sell position after the opening of the market

Apple Short ScenarioNASDAQ:AAPL Signal
Entry - $154
Target - $103
Invalidation - $180
Risk to reward ratio - 1.9
Technical confirmations
RSI divergence showing the weakness.
Price formed a lower high since All Time High.
If the price breaks the upward channel and support then it should continue dropping to 0.618 Fib zone.
Fundamental confirmations
Why should price reach Target level?
82.5% shares being held by institutions and Top 5 institutional investors share volume change in the past reporting date is -6.5%.
Cash of company increased due to a debt, but financing and investing sectors of a company fell a lot during Q1 22.
Estimated earning of 2022 1.43 (0.7 lower than 2021).
China COVID lockdown increase delay of Apple product shipments.

APPLEHello dear, I hope so nice everyone today I have an Analysis from the apple chart I See this area of action because the price near-daily supply zone we want to price has a correction.
of course, apple is always bullish so we looking to buy for the long term.
good luck.

CRAPPLE A BIT SHORT IN ONE SIDE :DHello trenders,
Here my ridiculous and funny chart showing a dramatic STFS (short the fuc.in stock).
Necessity is the mother of the economic growth. Left for use to 1 billion people market only the IOS devices are not enough to pay creativity, especially with the raw material missing.
Solution... try to crucify tesla on battery cars or follow the Nokia route.
Good luck
The best short is the one you avoid.

Apple Analysis 18.01.2022Hello Traders,
welcome to this free and educational analysis.
I am going to explain where I think this asset is going to go over the next few days and weeks and where I would look for trading opportunities.
If you have any questions or suggestions which asset I should analyse tomorrow, please leave a comment below.
I will personally reply to every single comment!
If you enjoyed this analysis, I would definitely appreciate it, if you smash that like button and maybe consider following my channel.
Thank you for watching and I will see you tomorrow!

Apple should go little bit down again!after 8% gain for apple because of icar news the stock should go back little bit, its overbought and hits resistend zone now

Apple The chart warned us 3 weeks agoHello everyone, as we all know the market action discounts everything :)
_________________________________Make sure to Like and Follow if you like the idea_________________________________
On August 24 I posted my analysis on the Apple stock and warned that a big divergence has been found between the market and the RSI and MACD indicators which usually indicates a drop in the market value and we can clearly see that it turned out to be a true sign.
Fear of contagion from China's Evergrande's potential collapse drove investors out of equities in a rush for safety on Monday, with the S&P 500 and Nasdaq suffering their largest daily percentage drops since May.
(NASDAQ:AAPL) was among the biggest drag on the Nasdaq and the S&P 500, Where the stock price dropped from 156.80 to 141.05. That's more than a 10% drop in less than 10 days.
The short-term trend is negative, but the long-term trend is still positive. So although the long term is still positive, this may be a trend turning.
Possible Scenarios for the market :
Scenario 1 :
The Market has broken the support line at 144.94 and now it looks like it will be headed to the support zone located at 138.42 where the Main battle will happen that will determine the direction of the market for the next period of time. If the bulls were able to gain control back over the market then we will be seeing a bounce in price that could lead the market to go back up but the buyers will have to show great power to be able to drive the price back up.
Scenario 2 :
The Market is nearing the second support at 141.88 and it looks like the bears are gathering more power by the minute and they will be able to push the market to 138.42 line the Bears will try to break that support in hope to push the market even lower and if there were able to do so then we might see a big drop happening in the stock price.
Technical indicators show :
1) The market is below the 5 10 20 50 MA and EMA (bearish short-term signs) but above the 100 and 200 MA and EMA (still bullish for the long-term)
2) The RSI is at 35.70 and looks like it could be headed to the oversold zone. A big divergence has been found before the drop
3) The ADX is at 22.42 showing that the market is trending with a negative crossover between FI+ (14.60) and DI- (31.11).
Daily Support & Resistance points :
support Resistance
1) 144.94 1) 148.00
2) 143.82 2) 149.94
3) 141.88 3) 151.06
Fundamental point of view :
The S&P 500 suffered its biggest slump since May, amid fears a debt crisis at China Evergrande Group could spark credit crunch in China's crucial real estate sector, leading to a potential economic crisis in the world's second-largest economy.
China Evergrande Group, the second-largest property company in China, has more than $300 billion in liabilities, and reports suggest it won’t hit an interest payment deadline on its offshore bonds due Thursday.
Tech participated in the broad-based selloff as investors appeared to take a breather from the ‘buy the dip’ mentally ahead of the Federal Reserve’s two-day meeting starting Tuesday. Google-parent Alphabet (NASDAQ:GOOGL), Apple (NASDAQ:AAPL), Facebook (NASDAQ:FB), Amazon (NASDAQ:AMZN) and Microsoft (NASDAQ:MSFT), ended mostly more than 3% lower. According to investing.com
This is my personal opinion done with technical analysis of the market price and research online from Fundamental Analysts and News for The Fundamental point of view, not financial advice.
If you have any questions please ask and have a great day !!
Thank you for reading.

AAPL Daily TimeframeSNIPER STRATEGY (new version)
It works ALMOST ON ANY CHART.
It produces Weak, Medium and Strong signals based on consisting elements.
NOT ALL TARGETS CAN BE ACHIEVED, let's make that clear.
TARGETS OR ENTRY PRICES ARE STRONG SUPPORT AND RESISTANCE LEVELS.
ENTRY PRICE BLACK COLOR
TARGETS GREEN COLOR
STOP LOSS RED COLOR
DO NOT USE THIS STROTEGY FOR LEVERAGED TRADING.
It will not give you the whole wave like any other strategy out there but it will give you a huge part of the wave.
The BEST TIMEFRAMES for this strategy are Daily, Weekly and Monthly however it can work on any timeframe.
Consider those points and you will have a huge advantage in the market.
There is a lot more about this strategy.
It can predict possible target and also give you almost exact buy or sell time on the spot.
I am developing it even more so stay tuned and start to follow me for more signals and forecasts.
START BELIEVING AND GOOD LUCK
HADIMOZAYAN

Apple will break out soon!Hello Boys and Girls :)
Today we take a look at the chart of apple. It had a nice run up until now but boy... look at that RSI. It is one hell of a divergence to the price action.
So for now we see the full pattern of this run and we can also see the near breakout in the chart. With the divergence and everything we see in the actual world, i will take some profits here.
Hope you all are good and safe out there.
Best Regards,
Jan

i'm selling apple stock .. do you ?!the complete analysis for apple stock starting from monthly, weekly, daily, and 4hr chart.
searching for the best trades with the lowest risk.
I'm waiting for confirmation in a smaller time frame and i will sell immediately
---
full analysis on related idea on my tradingview profile
WATCH IT
#eg_finance

i'm selling apple stock .. do you ?!the complete analysis for apple stock starting from monthly, weekly, daily, and 4hr chart.
searching for the best trades with the lowest risk.
I'm waiting for confirmation in a smaller time frame and i will sell immediately

Is APPL getting setting up for another crash?Personally I think Apple just like many other tech and speculative stocks are setting up for some major corrections. Personally I see Apple going down to $80 within the next year.
First I want to talk about why historically we about due for one. I have the 50 and 200wma pulled up on the chart. You'll notice Apple has been in a Constant uptrend since April of 2003. Its first Rally was from April 2003 until march 2009. That was the first time it tested the 200wma. Then you have another rally from the bounce off the 200ma all the way till 2013 when it crashes off the 200wma again. That was Close to a 4 year rally. then we go from the bounce off the 200ma in Jun of 2013 until it crashes and touches the 200ma again in may of 2016. So basically a 3 year rally. the next one was the bounce off the 200wma in Jun of 2016 till December of 2018. So this rally lasted about 2.5 years. Now we are in the Current run up from Jan 2019 till today. That's a little over 2 years. As you can see each bull rally since the tech crash has gotten smaller and smaller in time. Personally I see nothing on the charts, economically or anything going on with Apple that would justify this rally lasting longer then the last one at 2.5 years. Its been in a downtrend since the beginning of the year basically which I think is hinting it will touch that 200wma sooner then later.
Also when you look at the tops of each rally over the years they do look a little similar and I don't think the downtrend it is in now looks much different.
Best of luck on your trades!