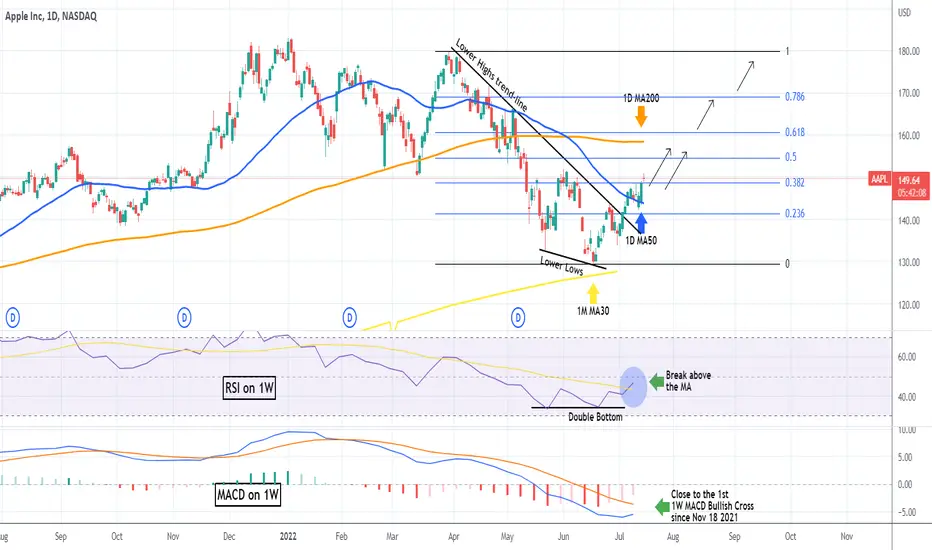
AAPLE holding the 1D MA50, targeting 158 short-term.Apple (AAPL) had a very strong 1D green candle yesterday, rebounding off the 1D MA50 (blue trend-line), which has been the Resistance since April 21, turning it into the Support. The break-out took place after the RSI on the 1W time-frame broke above its MA line on the widest margin since January 04. With the 1W MACD about to make the first Bullish Cross since November 18 2021, this could be the long-term buy signal that the market has been waiting for, for a sustainable recovery.
The technical short-term target is the 1D MA200 (orange trend-line) at around 158.00. The Fibonacci retracement levels can provide the next targets and pull-back/ buy levels. Overall the stock has the potential to reach its All Time High level before the end of the year.
--------------------------------------------------------------------------------------------------------
Please like, subscribe and share your ideas and charts with the community!
--------------------------------------------------------------------------------------------------------
Applesignals
Apple needs more juiceApple
Short Term - We look to Sell at 154.48 (stop at 160.14)
Further downside is expected although we prefer to set shorts at our bespoke resistance levels at 155.00, resulting in improved risk/reward. Posted a Double Top formation. The bias is still for lower levels and we look for any gains to be limited. Intraday rallies continue to attract sellers and there is no clear indication that this sequence for trading is coming to an end.
Our profit targets will be 137.56 and 130.14
Resistance: 155.00 / 171.00 / 182.00
Support: 137.00 / 123.00 / 118.00
Disclaimer – Saxo Bank Group. Please be reminded – you alone are responsible for your trading – both gains and losses. There is a very high degree of risk involved in trading. The technical analysis, like any and all indicators, strategies, columns, articles and other features accessible on/though this site (including those from Signal Centre) are for informational purposes only and should not be construed as investment advice by you. Such technical analysis are believed to be obtained from sources believed to be reliable, but not warrant their respective completeness or accuracy, or warrant any results from the use of the information. Your use of the technical analysis, as would also your use of any and all mentioned indicators, strategies, columns, articles and all other features, is entirely at your own risk and it is your sole responsibility to evaluate the accuracy, completeness and usefulness (including suitability) of the information. You should assess the risk of any trade with your financial adviser and make your own independent decision(s) regarding any tradable products which may be the subject matter of the technical analysis or any of the said indicators, strategies, columns, articles and all other features.
Please also be reminded that if despite the above, any of the said technical analysis (or any of the said indicators, strategies, columns, articles and other features accessible on/through this site) is found to be advisory or a recommendation; and not merely informational in nature, the same is in any event provided with the intention of being for general circulation and availability only. As such it is not intended to and does not form part of any offer or recommendation directed at you specifically, or have any regard to the investment objectives, financial situation or needs of yourself or any other specific person. Before committing to a trade or investment therefore, please seek advice from a financial or other professional adviser regarding the suitability of the product for you and (where available) read the relevant product offer/description documents, including the risk disclosures. If you do not wish to seek such financial advice, please still exercise your mind and consider carefully whether the product is suitable for you because you alone remain responsible for your trading – both gains and losses.

Apple: Are we at the bottom yet?!Apple
Short Term - We look to Buy a break of 140.40 (stop at 136.34)
Although the bears are in control, the stalling negative momentum indicates a turnaround is possible. Posted a Bullish Hammer Bottom on the 4 hour chart. This is positive for sentiment and the uptrend has potential to return. A break of 140.00 is needed to confirm follow through bullish momentum.
Our profit targets will be 149.76 and 156.00
Resistance: 140.24 / 149.76 / 156.00
Support: 136.00 / 132.61 / 123.00
Please be advised that the information presented on TradingView is provided to Vantage (‘Vantage Global Limited’, ‘we’) by a third-party provider (‘Signal Centre’). Please be reminded that you are solely responsible for the trading decisions on your account. There is a very high degree of risk involved in trading. Any information and/or content is intended entirely for research, educational and informational purposes only and does not constitute investment or consultation advice or investment strategy. The information is not tailored to the investment needs of any specific person and therefore does not involve a consideration of any of the investment objectives, financial situation or needs of any viewer that may receive it. Kindly also note that past performance is not a reliable indicator of future results. Actual results may differ materially from those anticipated in forward-looking or past performance statements. We assume no liability as to the accuracy or completeness of any of the information and/or content provided herein and the Company cannot be held responsible for any omission, mistake nor for any loss or damage including without limitation to any loss of profit which may arise from reliance on any information supplied by Signal Centre.

AAPL Weekly AnalysisDrawing this curved channel we can see consistent rejections along the top (red) line, price has recently hit this line and been rejected
There are two options now for price recovery, at the yellow line, which is a trend established from previous price points
Or the 200MA (in green) which has conversely seen a lot of support touches
The 200MA entry is a more reliable choice in my pov
The breakdown is a result of a rising wedge pattern

Apple Short ScenarioNASDAQ:AAPL Signal
Entry - $154
Target - $103
Invalidation - $180
Risk to reward ratio - 1.9
Technical confirmations
RSI divergence showing the weakness.
Price formed a lower high since All Time High.
If the price breaks the upward channel and support then it should continue dropping to 0.618 Fib zone.
Fundamental confirmations
Why should price reach Target level?
82.5% shares being held by institutions and Top 5 institutional investors share volume change in the past reporting date is -6.5%.
Cash of company increased due to a debt, but financing and investing sectors of a company fell a lot during Q1 22.
Estimated earning of 2022 1.43 (0.7 lower than 2021).
China COVID lockdown increase delay of Apple product shipments.

APPLE STOCK ANALYSIS MEDIUM TERMHEY GUYS, I HOPE YOU'RE ALL DOING WELL.
this is my general outlook on the market i am currently bullish on the stocks market and looking to buy the dips as far as i can see a retracement is due in both indexes and some profit taking so that happens this is my plan of attack keep in mind that this is an idea a plan in a uncertain chaotic environment out of multiple plans to be cirtainedif anything happens that changes the fundamentals of this idea, i will update.
please note that this is not financial advice. do your own research and use this information as conformational biase on top of your own analysis.
like for support!!!!

APPLEHello dear, I hope so nice everyone today I have an Analysis from the apple chart I See this area of action because the price near-daily supply zone we want to price has a correction.
of course, apple is always bullish so we looking to buy for the long term.
good luck.

Apple at Trend Line? Apple - Short Term - We look to Sell at 165.65 (stop at 170.37)
We look to sell rallies. 50 1day EMA is at 164.00. Prices expected to stall near trend line resistance. The next barrier is the trend of daily lows at 150.00.
Our profit targets will be 150.18 and 141.15
Resistance: 165.00 / 170.00 / 182.00
Support: 150.00 / 140.00 / 135.00
Disclaimer – Saxo Bank Group. Please be reminded – you alone are responsible for your trading – both gains and losses. There is a very high degree of risk involved in trading. The technical analysis, like any and all indicators, strategies, columns, articles and other features accessible on/though this site (including those from Signal Centre) are for informational purposes only and should not be construed as investment advice by you. Such technical analysis are believed to be obtained from sources believed to be reliable, but not warrant their respective completeness or accuracy, or warrant any results from the use of the information. Your use of the technical analysis, as would also your use of any and all mentioned indicators, strategies, columns, articles and all other features, is entirely at your own risk and it is your sole responsibility to evaluate the accuracy, completeness and usefulness (including suitability) of the information. You should assess the risk of any trade with your financial adviser and make your own independent decision(s) regarding any tradable products which may be the subject matter of the technical analysis or any of the said indicators, strategies, columns, articles and all other features.
Please also be reminded that if despite the above, any of the said technical analysis (or any of the said indicators, strategies, columns, articles and other features accessible on/through this site) is found to be advisory or a recommendation; and not merely informational in nature, the same is in any event provided with the intention of being for general circulation and availability only. As such it is not intended to and does not form part of any offer or recommendation directed at you specifically, or have any regard to the investment objectives, financial situation or needs of yourself or any other specific person. Before committing to a trade or investment therefore, please seek advice from a financial or other professional adviser regarding the suitability of the product for you and (where available) read the relevant product offer/description documents, including the risk disclosures. If you do not wish to seek such financial advice, please still exercise your mind and consider carefully whether the product is suitable for you because you alone remain responsible for your trading – both gains and losses.

CRAPPLE A BIT SHORT IN ONE SIDE :DHello trenders,
Here my ridiculous and funny chart showing a dramatic STFS (short the fuc.in stock).
Necessity is the mother of the economic growth. Left for use to 1 billion people market only the IOS devices are not enough to pay creativity, especially with the raw material missing.
Solution... try to crucify tesla on battery cars or follow the Nokia route.
Good luck
The best short is the one you avoid.

APPLE can hit $185.00 in 3 months. 1D MA200 in focus.I haven't made an analysis publicly on Apple since my September 14 2021 idea:
It was when I first made public of the long-term Channel Up it was trading in and warned about a correction towards the 1D MA200 (orange trend-line), which has been the stocks major Support since the COVID crash of March 2020. Eventually the pattern proved to be a success, as the price corrected and then upon testing the 1D CCI Support Zone, it rebounded above the 2.0 Fibonacci extension target.
Right now AAPL has been correcting since January 04 High. On February 24 it almost hit the 1D MA200 again as well as the CCI Buy level, but the rebound was rejected near the 1D MA50 (blue trend-line) and now is again near the MA200. We can see even in corrections, that the CCI Buy Zone can give short-term buy entries. The key here is for the price to break above the 1D MA50, as in previous corrections that was the start of the new uptrend. The 1D MA50/ MA100 (green trend-line) bearish cross, hasn't affected the uptrend's chances before, in fact when it happened the price was already in rise mode.
It appears that the next 1D MA200 contact would be the next long-term Buy Signal for Apple, unless of course the 1D MA50 breaks first. Either way, the CCI has already give a Buy Signal, and for more than 1.5 year, it has been 100% accurate. The 2.0 Fibonacci extension based on the last low is just over $185.00 and that is our long-term target on AAPL.
--------------------------------------------------------------------------------------------------------
Please like, subscribe and share your ideas and charts with the community!
--------------------------------------------------------------------------------------------------------

Apple Looking to Move Higher? Apple - Short Term - We look to Buy at 156.38 (stop at 151.92)
We look to buy dips. Prices expected to stall near trend line support. Previous support located at 156.38. Intraday signals are mixed. We are approaching the medium term support and look to set longs on an approach to this level.
Our profit targets will be 167.38 and 174.20
Resistance: 170.00 / 176.00 / 180.00
Support: 160.00 / 155.00 / 150.00
Disclaimer – Saxo Bank Group. Please be reminded – you alone are responsible for your trading – both gains and losses. There is a very high degree of risk involved in trading. The technical analysis, like any and all indicators, strategies, columns, articles and other features accessible on/though this site (including those from Signal Centre) are for informational purposes only and should not be construed as investment advice by you. Such technical analysis are believed to be obtained from sources believed to be reliable, but not warrant their respective completeness or accuracy, or warrant any results from the use of the information. Your use of the technical analysis, as would also your use of any and all mentioned indicators, strategies, columns, articles and all other features, is entirely at your own risk and it is your sole responsibility to evaluate the accuracy, completeness and usefulness (including suitability) of the information. You should assess the risk of any trade with your financial adviser and make your own independent decision(s) regarding any tradable products which may be the subject matter of the technical analysis or any of the said indicators, strategies, columns, articles and all other features.
Please also be reminded that if despite the above, any of the said technical analysis (or any of the said indicators, strategies, columns, articles and other features accessible on/through this site) is found to be advisory or a recommendation; and not merely informational in nature, the same is in any event provided with the intention of being for general circulation and availability only. As such it is not intended to and does not form part of any offer or recommendation directed at you specifically, or have any regard to the investment objectives, financial situation or needs of yourself or any other specific person. Before committing to a trade or investment therefore, please seek advice from a financial or other professional adviser regarding the suitability of the product for you and (where available) read the relevant product offer/description documents, including the risk disclosures. If you do not wish to seek such financial advice, please still exercise your mind and consider carefully whether the product is suitable for you because you alone remain responsible for your trading – both gains and losses.

Apple Analysis 29.01.2022Hello Traders,
welcome to this free and educational analysis.
I am going to explain where I think this asset is going to go over the next few days and weeks and where I would look for trading opportunities.
If you have any questions or suggestions which asset I should analyse tomorrow, please leave a comment below.
I will personally reply to every single comment!
If you enjoyed this analysis, I would definitely appreciate it, if you smash that like button and maybe consider following my channel.
Thank you for watching and I will see you tomorrow!

$AAPL Correction Prediction PT $157 to $165 rangeAs Apple continues to absorb the entire global share of wallet, bad things can happen.
When it does dump, it will take indexes and grow with it.
Bear PT = $157-165
Bull PT = $185-200
Odds are this starts next week unless the Fed backtracks on starting tapering.
Time will tell, this is clown world folks. No matter what happens, this is good for no one except those in $AAPL.
Disclosure I have puts.

Apple Analysis 18.01.2022Hello Traders,
welcome to this free and educational analysis.
I am going to explain where I think this asset is going to go over the next few days and weeks and where I would look for trading opportunities.
If you have any questions or suggestions which asset I should analyse tomorrow, please leave a comment below.
I will personally reply to every single comment!
If you enjoyed this analysis, I would definitely appreciate it, if you smash that like button and maybe consider following my channel.
Thank you for watching and I will see you tomorrow!

AAPL | Price is near huge Demand Area.When it comes to AAPL , right now price is near the demand zone, where price got gaped up because of huge demand and the price is likely to get rejected from this area. If you are going in, make sure to place the stop below the demand zone. If the price gaps down and open below the S1, then don’t take the long position.
If you find this technical analysis useful, please like & share our ideas with the community.
What do you think is more likely to happen? Please share your thoughts in comment section. And also give a thumbs up if you find this idea helpful. Any feedback & suggestions would help in further improving the analysis.
Good Luck!
Disclaimer!
This post does not provide financial advice. It is for educational purposes only! You can use the information from the post to make your own trading plan for the market. But you must do your own research and use it as the priority. Trading is risky, and it is not suitable for everyone. Only you can be responsible for your trading.

LONG and Buy Signal for Apple (aapl) !Description as provided in the chart.
Do feel free to let me know your thoughts and comments below :)
Remember to like and follow if it helped!

Apple Analysis 17.12.2021Hello Traders,
welcome to this free and educational analysis.
I am going to explain where I think this asset is going to go over the next few days and weeks and where I would look for trading opportunities.
If you have any questions or suggestions which asset I should analyse tomorrow, please leave a comment below.
I will personally reply to every single comment!
If you enjoyed this analysis, I would definitely appreciate it, if you smash that like button and maybe consider following my channel.
Thank you for watching and I will see you tomorrow!

$AAPL Apple Simple Technical$AAPL Apple Analysis for this upcoming week
NOTES:
- Currently at $178/s after hitting Resistance ALL TIME HIGH
-There is currently a visible RSI Divergence for the past week
-Historically there was another RSI Divergence From Nov 22 followed by a price correction
-Watch a Price Correction from an RSI Divergence this week towards the $173 levels

Apple should go little bit down again!after 8% gain for apple because of icar news the stock should go back little bit, its overbought and hits resistend zone now

APPLE ( AAPL)A great stock with great chart
wait for the stock to reach the yellow support zone (supported with moving average + key zone in daily )
aapl is in the B phase in a correctional wave ,next movement is the C one that is expected to be the impulsive wave .

AAPL Tecnical AnalysisWe are seeing a pullback after the butterfly pattern. This retracement could bounce upwards in response from 0.618. Or it can be as long as 1.27 supply zones.
Therefore, I think that the region above the region I indicated with 0.618 may be suitable for buying, and the region below it may be suitable as the stop loss region.
When we look at the indicator data, it signals that the price will return from here.
Although Rsi is 34, if this descent extends to 0.618, the rsi value will have fallen below 20. A value of less than 35 seems reasonable for a buying opportunity. In other words, starting to collect from here seems like a suitable option to avoid being left out, even if there is a return.
I have an equation that I developed called W*2. I will not go into details, but according to this calculation made with both pattern and indicator data, one more shape should emerge.
The simulation image of this formula is as follows.
If the section that says score on the indicator script I wrote was above +0, it would be necessary to handle this image differently.
Of course, this is a newly developed equation. Your own strategy is always more valuable than the ideas of others. I am already doing this analysis to support you in making the right investment decision by comparing my opinion with your own strategies.
So you shouldn't consider this an investment advice.
Looking at the Aroon indicator, we might think that we might see sellers weakening and buyers getting ready to start a trend. According to my W*2 equation that I just mentioned, if we also calculate the shortness of the climb, I think the aroon up and aroon down will meet in the middle and the sellers will continue to go up again.
The estimated image that I expect to form on the indicators is as follows;
When we look at the trend indicators, we detect a positive dissonance in momentum. In other words, we can think of it as a signal that prices can return from here.
The fact that the ADx is above 30 also indicates that the downward trend has weakened.
When we look at the money indicators, we can think that the money inflow has started in the cmf and that this is a pullback according to the cmf data.
We can also see the falling wedge of the already emerging downtrend. So this decline may actually be a pullback.
I tried to show the angle of price averages with green bars in Atr. This may make us think that there is actually no real pullback in prices.
When the upturn begins and prices start to rise, a bearish line will begin to form at atr.
In summary;
I'm waiting for the prices to return from here.
I believe that the real breakdown will start then, by testing the 158s of the price.
NOTE: This is not investment advice.

APPLE Further correction aheadPattern: Channel Up on 1D.
Signal: Sell towards the 1D MA200 (orange trend-line) and reverse to a buy either upon contact (buy signal last time) or when the CCI hits its Buy Zone (confirmed 3 times since November 2020).
Target: the 0.618 Fibonacci level.
** Please support this idea with your likes and comments, it is the best way to keep it relevant and support me. **
--------------------------------------------------------------------------------------------------------
!! Donations via TradingView coins also help me a great deal at posting more free trading content and signals here !!
🎉 👍 Shout-out to TradingShot's 💰 top TradingView Coin donor 💰 this week ==> Vergnes
--------------------------------------------------------------------------------------------------------

Apple will break out soon!Hello Boys and Girls :)
Today we take a look at the chart of apple. It had a nice run up until now but boy... look at that RSI. It is one hell of a divergence to the price action.
So for now we see the full pattern of this run and we can also see the near breakout in the chart. With the divergence and everything we see in the actual world, i will take some profits here.
Hope you all are good and safe out there.
Best Regards,
Jan
