Apple - Weekly Chart - Long ScenarioLooking to take a long if price should manage to get again above the blue trendline. Would buy on a retest then.
First target is the Resistance level (upper blue line) where i would take out my initial investment.
Second is above the blue level, where i would close the rest of the position.
Dont forget:
- Watch your Risk management
- DYOR (Do-Your-Own-Research)
- This information / article is only for educational purporses and not a recommendation to buy or sell.
I'm not a Financial Advisor.
Thanks for reading!
trader_se
Applestock

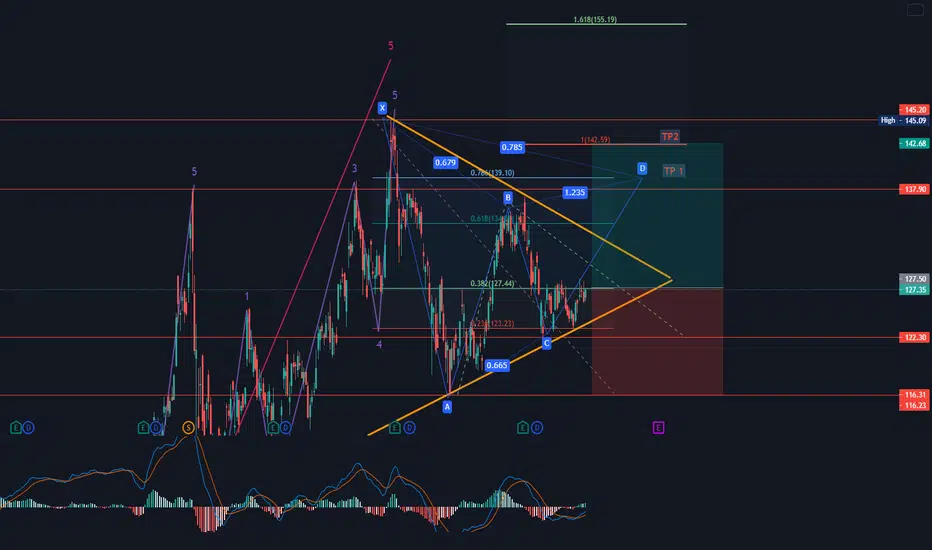
AppleAs you can see in the daily chart, After testing 145.09 the trend has been changed and a bearish one has been started however this downtrend is not strong enough and the Buyers might be still in power.
In my point of view since the retracement is about 61.8%
2 different harmonic pattern might occur
1st scenario:
A Gartley pattern might happen So Apple will experience a rise in price and it increases to 139.10 which is the first TP.
2nd scenario:
A AB=CD pattern might happen therefore Apple will move up at about 142.59 which is the second TP .
However a Crab pattern is likely to happen in order for that the price must pass the previous top which is 145.09.
In any cases, the SL is about 116.31
Please write your ideas in the comment
$AAPL Triple Bottom Bounce? Or Triangle Breakdown? 6/2Technical Analysis update on $AAPL after another day in the red. Taking a non bias look at the chart to see the potential both ways.

APPLE DAILY CHARTAPPLE DAILY CHART
As we head closer to WWDC and rumour start to fly
now is a good time to invest in Apple or go long.
We can already see the incline of a buyers market.
MACD is showing very promising signs of a bullish move
This is the time to watch this stock carefully.


i'm selling apple stock .. do you ?!the complete analysis for apple stock starting from monthly, weekly, daily, and 4hr chart.
searching for the best trades with the lowest risk.
I'm waiting for confirmation in a smaller time frame and i will sell immediately
---
full analysis on related idea on my tradingview profile
WATCH IT
#eg_finance

i'm selling apple stock .. do you ?!the complete analysis for apple stock starting from monthly, weekly, daily, and 4hr chart.
searching for the best trades with the lowest risk.
I'm waiting for confirmation in a smaller time frame and i will sell immediately

$AAPL Quick Aftermarket Update 5/24Brief Video update on $AAPL after a stop out at 128 again. I think a break of 128 will have you back up against resistance around 131.50


$AAPL At Support! Pivotal Bounce Needed! (UPDATE 5/21)Video update and breakdown on AAPL after a strong bounce off support.

$AAPL At Support! Pivotal Bounce Needed! Video update and breakdown on $AAPL after a gap down on support.

Won't buy AAPL till 107This is dream right at the current price. I would love to buy apple at 107 and take it from there.
The more likely senario in the short term is between 116-120 but we could always hope for the best.
Near term that is likely where we see it given the fact that half the US market will not have a passive income stream coming into the holiday season, if i had the time to buy Jan 2022 puts i would.
Short to 116 in the near term


$AAPL Broken Channel, But Have We Broken Trend?Quick Video recap on $AAPl going into this week Alot could Happen between now and then...

Great SHORT Opportunity!!Apple looks OVERVALUED!!!
Tech is going down. People are rotating into companies that have PE multiples that make sense!
Yes they have a ton of cash on hand and will be completely fine, so for most of you it might be a buying opportunity but I see this sucker going down at least -20% to -30%.
That white box is a head and shoulders reversal pattern.
A break below $120 would signal possible confirmation of a new downtrend.
Over time it's been bouncing off the 200 day moving average so that's where I'd aim this time again.


$AAPL WATCH THIS BEFORE YOU BUY THE DIP! We still have a lot of signs for the downside on $AAPL
I see a potential head and shoulders on $AAPL on the weekly
Today felt like a relief bounce but only price action through this week will give us a proper indication of further downside!

$AAPL (5/10-11 UPDATE) LOOKING FOR SUPPORT $126Brief Video update on $AAPL
If you havent caught any of my previous breakdowns I will link them below.
Still on trend since my last video playing off the rounded top here on the daily. Looking for abounce off support around 126. More details within.
If you like this content make sure to leave a like a follow my channel for weekly and daily updates.

a good opportunity to buyBased on the daily frame, VWAP and VOLUME UP DOWN, I recommend you buy, the stock will bounce What a good opportunity

AAPL - You Have Only 45min Hi, this is my update for AAPL. After a big fall today, we have now tested the support level $127, SMA100 and SMA50. We got rejected first time we tested the 70.2% retracement level from the recent fall, but I think in the coming days we are going to break it. Next resistance is between $135-137, if we break it we are ready for $143. So be patient and don't PANIC, AAPL is BULLISH ;)

$AAPL Post Earnings (Technical Analysis) 4/30After what seemed to be a great earnings on $AAPL we have seen a gap up and that gap was lost rather easy due to market conditions. The Global Chip Shortage is impacting some of the largest companies and demand grows and supply is weakening.
Looking at the chart, we have been fighting with the $135 wall for weeks. Holding what seemed to be a cup and handle on the daily. Due to the rejection we saw yesterday, and the FAANGS lackluster earnings we could see a trip down to support before to long.
We are looking to open today on our 20 EMA on the daily (blue line) which is below our marked support of 132. If we loose the 20 EMA I think our first level will be the break of 130 and then we have the 50 EMA directly under at 129.15
I will be watching for bearish momentum today and I will be paying close attention to option flow as to get a better idea of the sentiment going into next week.
Previous ideas linked below
Over all I am bullish on AAPL but market conditions are showing a lack of strength and runs divergent from $SPY as it continues to make new highs.
Good Trading

$AAPL 4/20 Recap! CUP AND HANDLE MAINTAINED Video breakdown on $AAPL after their event today. Still maintaining the handle on the daily timeframe as well as the 9 day moving average. We need to see 133.50 reclaimed to stay in trend tomorrow.

#APPL Ready for ATH? (All time high) $APPLIf Apple breaks ATH and resizes more than 5% AFTER breaking ATH. There is high probability of 10-20% returns and so I will go LONG by buying ATM Calls.
