Quick $AAPL Update 4/13-4/14Video update on $AAPL Great movement today, futures red so we could see a healthy pullback but looking at 133 as a bounce!
Applestock

APPLE Inc.This is an update on Apple Inc., I am still expecting Apple Inc. to hit $200/share - as my target.
Disclaimer:
This must not be taken as a trading signal.

Apple share price analysis - The decision has been made!Hello dear readers,
The correction in Apple ended with a clear positive week. The cross support of the golden pocket and trend line was tested hard, but held.
Now the price is showing the appropriate reaction and can clearly pull away.
The medium-term outlook is therefore positive!
The price target of the current movement can be derived on the one hand from the Fibonacci expansion and on the other hand from the trend channel and thus lies at approx. 158 points.
As long as the trend channel is not broken downwards, the chart remains positive. Only a break of the trend channel would put the long scenario in danger.
Don't forget to Like & Follow if you like what you read :)
Best wishes & success!
Chartdigger

$AAPL AMAZING WEEK! Whats Next? Walking through a few differently potentials going into the second week of April! Congrats to those following along This week

$AAPL Targets Crushed $140 in Sight?Video breakdown on $AAPL ! Last videos have hit and i think we may see a healthy pullback on the lower time frames.

$AAPL Last Video HIT! Target in Range! 4/7-8 ( UPDATE TA)Video Breakdown again on $AAPL Last video was a hitter!


$AAPL $135 In Sight! Technical Analysis!Video breakdown on the $AAPL trade today and what we are watching for tomorrow! Great AH movement!

#APPL crossing the triangle resistance, expected increase#APPL crossing the triangle resistance, expected increase

AAPL - Apple inc.When the Crypto market is consolidating and you can't find any main coin interesting enough to long or short, Take some time off and study the charts of some powerful companies.
That's what I do and I've never regretted this.
For example right here we've got AAPL as a very good example. right now it's already got rejected by a resistance, fell and got support and consolidating to go back up. I'd buy some shares because it looks powerful. and also, It's never a bad choice to buy AAPL, no matter what. (Chart speaks for itself)
Good Luck 🎲
Tell me your ideas. Like and Share 🗣✅

Apple---> this big whale is waking upApple has been consolidating around 120 area. However it still have not got a good momentum. As per my past experience with apple, apple is really unpredictable it can rise when market is falling or vice versa, the reason being it is being traded extensively. Apple divergence on indicator is increasing, it is now apparent in 3 hour and 4 hour chart. However it has also formed a hammer on increased volume which can indicate reversal or short covering or a bearish trend. If we look all the 4 things together and apply knowledge of Bollinger band then we will see that it increased volume was not associated with increased volatility since Bollinger band are very narrow.
This means that short covering was done and no extensive new buying of shares was done that is why volatility is low.
Also the price is moving near to 20 day average on Bollinger band the middle line. Overall it is more bullish. I believe apple will be waking up quickly and usually when it runs it give 7- 8 percent return in a single bull run . Indicator show divergence .
I think usually on these days the best strategy will be a put credit near support or an iron condor will also be good. Also for long term investor this is the time to do the home run
Ideas here are for knowledge and entertainment. Do trading at your own risk

Here we go AGAIN!! Appl Analysis with entriesIm back!!!. If your a new or old trader/investor looking to purchase NASDAQ:AAPL then the following information will serve you well.
Currently NASDAQ:AAPL is trading at $119.58 at the time of this writing. Market volatility levels are HIGH due to the USD inflation being pumped up by the injection of the massive Stimulus Bill that was just signed into law recently. Making for an ideal trading environment for the savy investor which knows what to do. Now if you don't know what to do, let me help you a bit. Let's get straight to it!
You and I both know that NASDAQ:AAPL is fundamentally one the most stable companies if not the most stable company in the world with a cash holding of $195.57 billion dollars as last reported. As well as a remarkable financial statement & balance sheet showing nothing but future growth with out a doubt Even when it is under performing last years Q1 reports NASDAQ:AAPL numbers still do ALL the talking on their own. During times of slow downs like these in stocks due to the US dollars value increasing & stocks retreating to prior prices, it creates the perfect opportunity.
So what is this opportunity I speak of? & what does all this mean for a trader/investor like yourself?
It means, that these market environments are creating the perfect opportunity for a pull back entry that allows traders to purchase the most powerful company in the American stock exchange at a much lower price than it currently averages at. Which is why I chose to break down this stock today.
**Disclaimer**
Before entering a trade three types of analysis should be performed.
Fundamental Analysis = The study of financial statements and economic news. (Overall Trend)
Technical Analysis = The study of chart history. (Entry & Exit Strategies)
Sentimental Analysis = The study of the markets current psychology and traders psychology.(Instinct)
After performing the three analysis below are my results:
NASDAQ:AAPL
Fundamental Analysis = LONG (BUY)
Technical Analysis = SHORT-TERM SELLING (Pull back into our LONG positions)
Sentimental Analysis = Market is taking a breather due to USD valuation increasing.
To better explain:
This means that right now momentum is headed downwards technically but the overall trend is up fundamentally.
So since we know the overall trend is upwards but we are currently headed downwards it creates the perfect timing to use our Fibonacci Retracement tool. A tool that is used to find important entry and exit levels in a trending market. Which is traditionally applied to the low & high of a trend. Here were my results:
As you can see in the chart above we have already retraced heavily down to the 61.8% fib level at $119.14. This area still makes for a great BUY trade. Markets are still showing downwards momentum as dollar keeps heading up. If momentum continues downward we can eventually see an amazing bargain price at the following fib level the 78.6% which is anywhere from $114-$112.09
MY SUGGESTION:
Place LONG orders totaling anywhere from 1-5% of your total trading capital on each retracement level below:
23.6% = $135.00 (BUY)
38.2% = $129.00 (BUY)
50.0% = $124. 00 (Great trade opportunity) (BUY)
61.8% = $119.15 (What i consider the PERFECT IDEAL TRADE) (BUY) *Currently we are here*
78.6% = $112.10 (ABSOLUTE BARGAIN!!) (BUY)
Take profit 1: $125 Secure about 10-25% of profits in this zone
Take profit 2: $145.09 at the previous ATH . (All Time High) Be patient and trust the process. This monster of a tech stock will most definitely return to break more records in the upcoming months when the continuation wave arrives. If not just stand back, take notes and analyze price action.
If you guys enjoyed this break down please drop a LIKE/COMMENT & make sure to hit that FOLLOW button. Cya'

Is APPL getting setting up for another crash?Personally I think Apple just like many other tech and speculative stocks are setting up for some major corrections. Personally I see Apple going down to $80 within the next year.
First I want to talk about why historically we about due for one. I have the 50 and 200wma pulled up on the chart. You'll notice Apple has been in a Constant uptrend since April of 2003. Its first Rally was from April 2003 until march 2009. That was the first time it tested the 200wma. Then you have another rally from the bounce off the 200ma all the way till 2013 when it crashes off the 200wma again. That was Close to a 4 year rally. then we go from the bounce off the 200ma in Jun of 2013 until it crashes and touches the 200ma again in may of 2016. So basically a 3 year rally. the next one was the bounce off the 200wma in Jun of 2016 till December of 2018. So this rally lasted about 2.5 years. Now we are in the Current run up from Jan 2019 till today. That's a little over 2 years. As you can see each bull rally since the tech crash has gotten smaller and smaller in time. Personally I see nothing on the charts, economically or anything going on with Apple that would justify this rally lasting longer then the last one at 2.5 years. Its been in a downtrend since the beginning of the year basically which I think is hinting it will touch that 200wma sooner then later.
Also when you look at the tops of each rally over the years they do look a little similar and I don't think the downtrend it is in now looks much different.
Best of luck on your trades!


AAPL objective long setupAAPL gapping up above the down trend line and making a perfect back test. From the technical perspective, it is an objective long entry. I would enter this trade with a tight stop. If AAPL pushes up to ATH anytime soon, it is very likely to extend the negative divergent. Moreover, it gets there that quickly, it will most likely to be overbought as well. To be clear, I am long AAPL short term but mid term bearish.
Have a good trade everyone,
T.s


AAPL LONG OPPORTUNITY THE PRICE WILL GO ON A BULLISH UPTREND AFTER RETESTING FIBO'S 61 & 50 ZONES & ALSO RETESTING SUPPORTS , A CLEAR BULLISH DIVERGANCE CONFIRM OUR PROBABILITY , SO BETTER TO GO LONG !

Apple Stock - Head and Shoulders formation as Investors WaryHi,
AAPL daily chart has completed the formation of Head and Shoulders pattern and it is now breached. If the price goes up in the next few days and pull back on the line, it will confirm the drop. I am in the position of selling some of the portion until the next confirmation.
The drop should be contributed by the the plan of the technology titan to produce electric cars. It is seen as a big innovation as well as big investment to the company due to its reputation as having a penchant on being a disruptive company.
The production was started as a rumor. However, as the news on the company is in discussion with several suppliers to procure the lidar technology emerged, we can assume that the rumor might become reality. For information, Lidar Technology is used in self-driving vehicles.
Happy Trading!

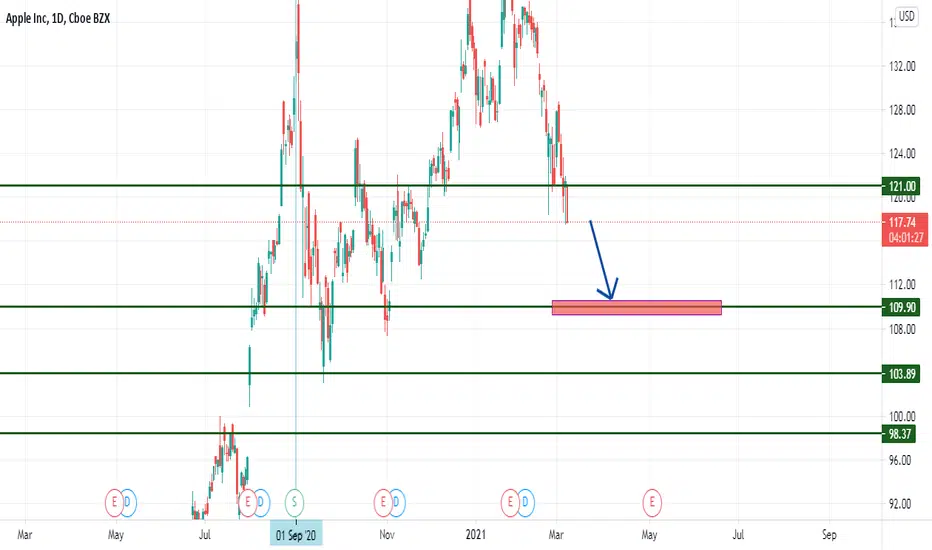
APPLE INC. BREAKS BELOW ASCENDING TRIANGLEIn my Previous Post, I said Price could Push higher from the 50% fib zone. Having Re-visited the charts, I have now identified an Ascending Triangle and Price has pushed below, retested, and now continues to fall. We could see a Gap appear at the Open after the weekend with Price potentially pushing as low as $99.
#appleinc #applestocks #appleshares #stocksandshares #stockmarket #investing

$AAPL Follow Up Video 2/3 Continuation? $AAPL Last Video hit! Looking for continuation within the market to fuel $AAPL past some key resistances

Apple why you saw nothingJust playing arround with Eliot impulse and corrective abc only.
Even with such basic tool you could had avoid this little market correction.
So what is to see , a good bounce on the 200 ma should be a good entry trigger since the global structure remain pretty bullish

Apple shortThe breaking of the purple channel pushes the price down. The formation of a red channel is another sign of the strength of the sellers. The third sign is the increase in volume within the red resistance range.
in return
The center line of the green channel, which is orange, has usually been strong, and the Trend Magic line has sometimes been a good support line
The lower shadow of the one-hour candlestick was large when hitting the resistance of the red descending channel
These are also signs of the power of buyers.
But the power of buyers seems to be less than that of sellers because the signs of the body are weaker.
We can wait a little longer until everything is clear, but in this case we may lose a lot of profits!
Apple stock prices will probably go yellow. The range of $ 100 to $ 103 is good to buy, but people who want to take the risk to buy the stock cheaper and of course they may not be able to buy! They can wait until Apple shares hit the bottom of the green channel!
Also, if during the first 2 or 3 days of next week and the price manages to break the red downward channel upwards or the price manages to return completely to the purple channel, it is a good time to buy!
Personally, I find the yellow route more probable. But for more investments, I am waiting for the market to determine its path better and more!
