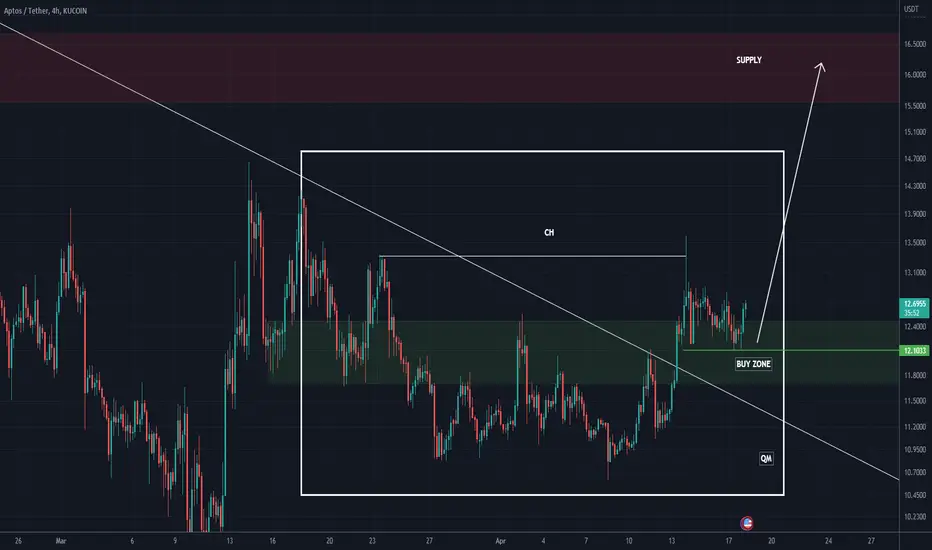
🔥APTOS READY TO PUMP AFTER 3 MONTHS RANGE: BULLISH SCENARIO🔥Hi, friends! Aptos is in 90 days consolidation now. It's borring for retail traders and investors who bought this coin above $ 12-13. I think that whales accumulate enough altcoins that they sold at $ 18-20.
📊 TRADING PLAN FOR APT:
1. trap the long traders through growth to value area $ 12.1-13.7 and fall below local low to collect their sl
2. volume growth at the bottom
3. bullish BTC
🚩 If BTC will start to grow, our 3 targets will be reached very fast.
✅ THE MAIN TARGETS FOR APT:
🔥$ 12.3-13.7 - the value area
🔥$ 16.8 - the key level
🔥$ 20.4 - the key level
💻Friends, press the "boost"🚀 button, write comments, and share with your friends - it will be the best THANK YOU.
P.S. Personally, I open an entry if the price shows it according to my strategy.
Always do your analysis before making a trade.
Aptos

APTUSDT SCALP/SHORT TERMShort term i will wait apt to break diagonal trendline and to break 8.77$ level once that happen it can go easy to 10.8$.
Also there is chance to make another leg down something around 7.61$
Thats my view on the short term.
This is my own analysis nor financial advise or anything like that just Dyor before make any action or your own trade.
With Respect your Rhino.

APT SWING-MID TERM ANALYSISI'm personaly deep ball into apt. That doesn't mean that's good decision. Till apt don't break above 10.8$ level it can heading down and more down.
So there is always few kind of traders. Traders which trade with confirmation in that case i will buy apt only once it break 10.8$ level and hold above that level atleast 2-3 candlesticks on 4h timeframe. DCA or Knife catcher in that case i will start buying apt from 8$ to 7$ and hold it till or 24-26$.
Apt for now is holding good between 8.3-7.4$ and should get bounce every day. First and main resistance is 10.8$ once we break that level we can consider there is very big chance for reversal trend. Break above 16.4$ would be confirmation for that apt is going to new high which would be atleast 24-26$.
Thats my personal view and DYOR before make any action about your own trade.
With respect your Rhino.

APT higher high soon ?Hello Traders,
APT was running on a critical support level which is 9.7$
Now it looks like it`s forming a double bottom pattern.
So I am waiting to see APT back at 18$ soon, even higher is possible but lets take it step by step
You can enter now, SL 1D under 9.7
If the key support 9.7 is broken, next tartget would be around 5$ (just in case)
PLEASE NOTE THAT I AM A SPOT TRADER NOT FUTURES. *****
Hope you have a nice day.
Follow for more and check other alts ideas

Aptos(APT) fall by Expanding Triangle Pattern👇Aptos was able to make an expanding triangle near the 🟢 support zone($ 10.44-$ 9.70) 🟢.
It seems that Aptos broke the support zone after verifying point E of expanding triangle.
I expect Aptos to fall to the 🟢 next support zone($ 7.57-$ 6.76) 🟢after breaking the lower line of expanding triangle.
💡If you want to know more about the Aptos project, I suggest you read the following post.👇
Aptos Analyze ( OKX:APTUSDT ), 2-hours time frame ⏰.
Do not forget to put Stop loss for your positions (For every position you want to open).
Please follow your strategy, this is just my Idea, and I will be glad to see your ideas in this post.
Please do not forget the ✅' like '✅ button 🙏😊 & Share it with your friends; thanks, and Trade safe.

APTOS Cryptocurrency SHORT Opportunity | 40% Downside Potential The APTOS Cryptocurrency or APT coin looks ready for a huge fall.
The coin is currently trading below the support level of 9.42-9.77. But to execute the short, we need to first wait for Daily Candle close below.
It is always better to wait for the candle close, as sometimes the price reverses and creates a wick.
Also, observe how price was making lower highs into the support which signifies sellers are getting strong and buyers are weak. The price action forms a DESCENDING TRIANGLE which is a bearish pattern if breaks down.
PLAN TO EXECUTE THE SHORT SETUP
-Wait for the daily candle ( 6/5/2023) to close below the support area.
- Once the candle closes below support, enter into short position with half the risk per trade you usually take. Support if you take 5% risk per trade, then take 2.5% in this entry
- Enter another half on retest of support as new resistance. You may place a short order in advance or wait for the price to come there and give another short signal ( depends on you trading strategy)
Stop Loss- Above 10.15
Targets:-
1. 7.6
2. 5.6
THIS IS A SWING TRADE
Keep trailing your stop loss
Let me know in the comments section if you want me to analyse any other cryptocurrency.
WARNING:-
ALWAYS FOLLOW RISK MANAGEMENT AND POSITION SIZING WHILE TAKING ANY TRADE.

$APT targets $44-50 to the upside?AMEX:APT looks like it's putting in a bottom here.
If it can break out of it's current range to the upside and break the top resistance, I think price can move all the way up to the $44-50 range.
Let's see if it plays out.

APTOS - TIME TO BUY MOREIn a previous trade idea linked below, we have identified a breakout of a downtrend structure followed by some upside movement but price didn"t continue to rise.
Now, APTUSDT is at a very strong support which may be the start of a leg up towards new highs if you hold for the long term.

APT breaking upAPT (Aptos) found its support level and now trying to break up the rejection levels one by one.
This can be epic for it.

aptusdt dailyHi Guys , hope you well
Aptos one off the new coin and i think one of the best in future ,it have some fundamental news next week ,
and chart in on support level, it will be good for hold ,
SecondChanceCrypto
⏰25/April/23
⛔️(DYOR)
always do your research.
If you have any questions, you can write them in the comments below, and I will answer them.
And please don't forget to support this idea with your likes and comment

🔥 APTOS Preparing For Further Drop: Ideal Bounce Area LocatedAPT has been in a steady decline since late January. With BTC taking a more bearish stance, it's to be expected that APT will also drop further.
Long-term, I'm still bullish on APT. However, there's little technical reason to buy now.
I'll start to be interested again once APT reaches the bottom support of the channel. Note that the bottom diagonal line is a direct copy of the top line, which makes it a perfect parallel channel.

APT/USDT Technical Analysis: Is the Bearish Trend Here to Stay?APT/USDT Technical Analysis: Is the Bearish Trend Here to Stay?
$APT/USDT is currently trading at $11.40 and the technical analysis suggests that there could be a potential bounce in the short term. However, the overall trend remains bearish and there is a possibility of a breakdown below the HKEX:11 support level. In this article, we will take a closer look at the $APT/USDT chart and provide some key takeaways for investors.
Key Takeaways:
$APT/USDT is currently trading at $11.40
The chart suggests a potential bounce in the short term, with a possible test of HKEX:13 resistance level.
However, the overall trend remains bearish, with a possible 50% down move if there is a breakdown below the HKEX:11 support level.
There are two potential support levels to watch out for at $7.55 and $5.20.
The resistance level at $13.30 should be closely monitored as a break above this level could invalidate the bearish scenario.
Technical Analysis:
The $APT/USDT chart suggests that there could be a potential bounce in the short term, with the possibility of a test of the HKEX:13 resistance level. However, the overall trend remains bearish, with a possible breakdown below the HKEX:11 support level. If this happens, there could be a 50% down move from the breakdown level.
Investors should also keep a close eye on the potential support levels at $7.55 and $5.20. These levels could offer buying opportunities for investors who are looking to enter the market. However, if the trend reverses and breaks above the $13.30 resistance level, the bearish scenario would be invalidated.
Conclusion:
In conclusion, the $APT/USDT technical analysis suggests that the bearish trend could continue in the short term. Investors should closely monitor the HKEX:11 support level and the $13.30 resistance level for potential buying and selling opportunities. As always, it is important to conduct your own research and seek professional advice before making any investment decisions.
Follow us for More Quality Content.
Thank you.


APT IS BULLISHHi, dear traders. how are you ? Today we have a viewpoint to BUY/LONG the APT symbol.
For risk management, please don't forget stop loss and capital management
When we reach the first target, save some profit and then change the stop to entry
Comment if you have any questions
Thank You

ARBUSDT H2Hi , Guys
So Hype , Good project and fundamental, and at the end nice volume
SecondChanceCrypto
⏰16/April/23
⛔️(DYOR)

nearusdt H4Hi Guys , hope you well
Chart show you everything's
SecondChanceCrypto
⏰16/April/23
⛔️(DYOR)

DYDXUSDT H4Hi Guys, Hope you well,
One of the best currencies in the crypto market with a very good exchange project. It will definitely see much higher price in the future.
SecondChanceCrypto
⏰16/April/23
⛔️(DYOR)

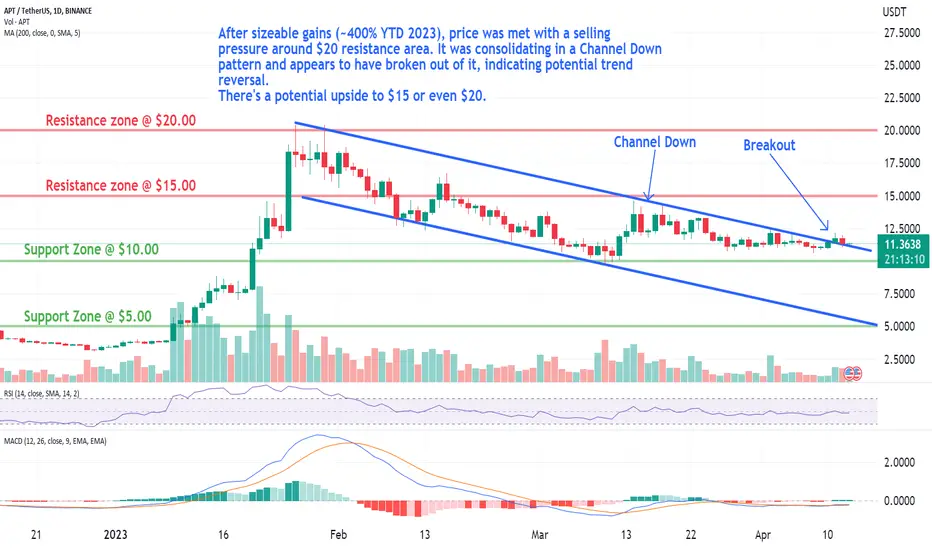
APT: Channel Down BreakoutTrade setup : After sizeable gains (~400% YTD 2023), price was met with selling pressure around HKEX:20 resistance area. It was consolidating in a Channel Down pattern and appears to have broken out of it, indicating potential trend reversal. There’s potential upside potential to $15 or even $20.
Pattern : Price was trading in a Channel Down pattern. With complete patterns (i.e. a breakout) – initiate a trade when the price breaks through the channel’s trendlines, either on the upper or lower side. When this happens, the price can move rapidly in the direction of that breakout.
Trend : Downtrend on Medium-Term basis and Uptrend on Short- and Long-Term basis.
Momentum is Bullish (MACD Line is above MACD Signal Line and RSI is above 55).
Support and Resistance : Nearest Support Zone is $10.0, then $5.0. The nearest Resistance Zone is $15.0, then $20.0.

Whether it can rise above the volume profile is keyHello?
Traders, welcome.
If you "Follow", you can always get new information quickly.
Please also click "Boost".
Have a good day.
** Analysis of the BTC chart publishes new ideas once a week.
** However, we publish new ideas when volatility occurs or when we show signs of diverging from our expectations.
** Excluding the above situation, BTC analysis is listed as a daily update.
-------------------------------------
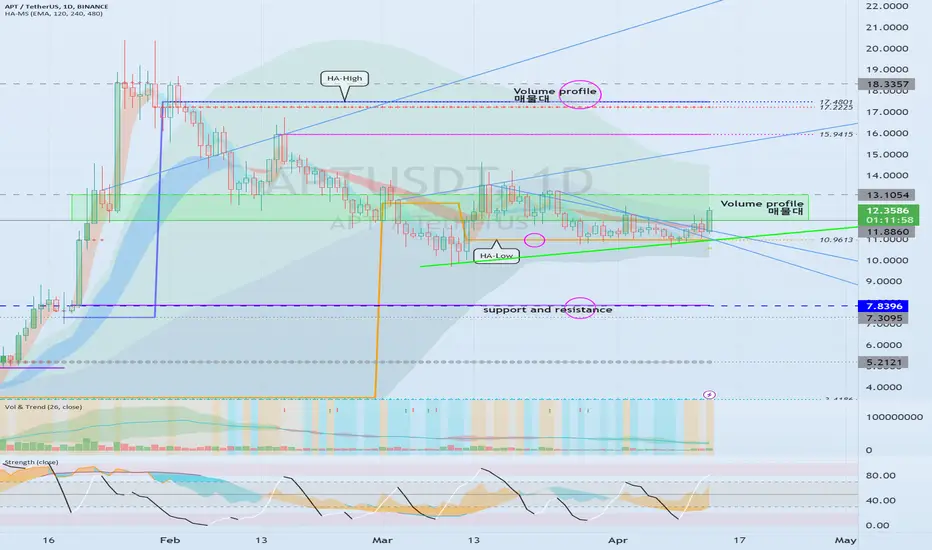
(APTUSDT chart)
The key is whether it can rise above the volume profile section formed in the 11.8860-13.1054 section.
If it declines, you should check for support around 7.8396.
Since it was supported and rose near the HA-Low indicator of the 1D chart, if it rises above the selling range of 11.8860-13.1054, it is expected to rise to the vicinity of the HA-High indicator of the 1D chart.
However, it may be created by moving the HA-High indicator as it rises.
-------------------------------------------------- -------------------------------------------
** All descriptions are for reference only and do not guarantee profit or loss in investment.
** Even if you know other people's know-how, it takes a considerable period of time to make it your own.
** This is a chart created with my know-how.
---------------------------------
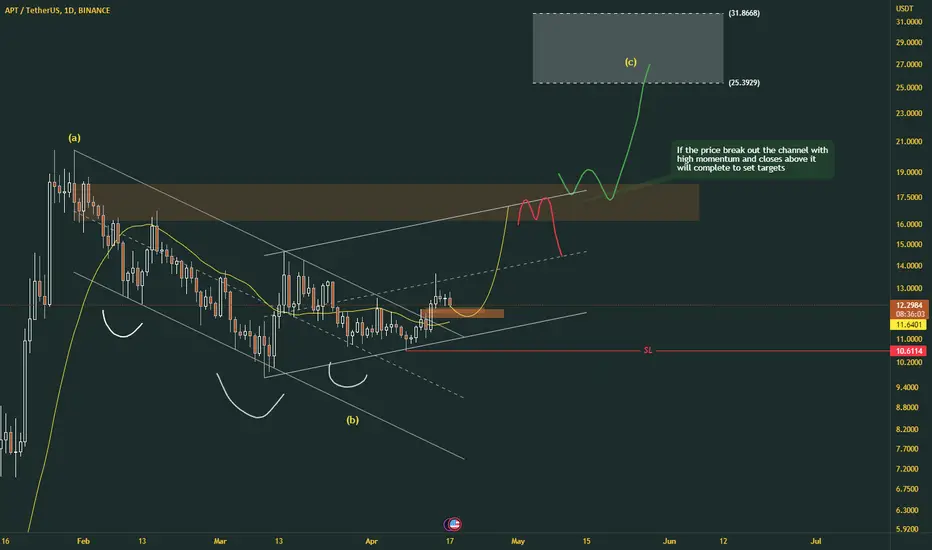
APTOSUSDT Potential Bullish ActivityHi Guys, welcome to my TA analysis on a crypto thats been on the spotlight of late. This analysis looks at the USDT pair, not the BTC pair. Its important to state that though i am looking at the USDT pair, it is particularly important when trading crypto especially longer term trades like swings or investing to pay attention to what the BTC/Altcoin pair is doing.
With that i am looking at this trade after the BTC pair is at an uptrend and potential strong support area with indicators at relatively oversold areas. Also with BTC moving this high, reaching overrbought areas, its probable that profit taking occurs with money from BTC, moving into alts.
With that in mind, this chart pulled me in.
Lets first look at PRICE ACTION
We are currently breaking out of the downtrending resistance trend line from the HKEX:20 top in January 2023. Keep in mind it has not yet confirmed and its on the Daily timeframe ( todays candle has not yet closed). We need to wait and see if it confirms with some bullish candle patterns which ill be observing closely. If it confirms above this red trend line and or acts as support (meaning price action comes down to test it and wicks up), both scenarios i buy positions. Our first target will be the $13.80 level indicated by white line.
Also note higher lows are intact.
BTC moving sideways with APTOSBTC pair moving up will validate this and absolutely push this up.
Now lets look at the 2 indcators i got on my screen
1. RSI - Notice the RSI bounced off the moving average yellow line breaking over the red horizontal trend line. WHen ever white RSI line is above the yellow moving average, we tend to move up in price. The red horizontal line, though we dont have enough data on this coin, when we are above it and it acts as support we move massively up as noted with the previous price action to the HKEX:20 area.
NOTE, we have established higher lows on RSI as well, as long as we stay above the white horizontal line, we are good.
2. MACD - this is a momentum indicator, we have been flat for some time indicating in my opinion consolidation. But notice we also have higher lows forming on the blue/orange line. Currently we have crossed bullish and we are below the 0 line. If we end up moving above 0 line with bullish cross, i believe there will be massive uptrend momentum.
CONCLUSION: Overall price action is breaking out of this major 4 monthish resistance line. Note that todays candle has not yet closed, but will do so in 4 hours-ish. Also, If we can confirm above, this indicates a trend change to the upside or at the very least sideways action. However altcoins are dependent of how BTC acts so we must pay attention to BTC. Overall, in my opinion dictated by my trading principles we have not yet confirmed a trade setup but getting reallly close. I believe we will know more info in the next couple days to week (give or take couple days). So stay tuned.
Hope this gave some insight. If you liked my analysis please boost, follow and comment. Let me know if you want continual updates on this. Let me know if you want a BTC pair analysis. Check out my other analyses on BTC and if your into stocks, check those out too.
DISCLAIMER - This is not financial advise. I am not a financial advisor. This is for educational purposes and is my opinions only. When trading please do manage your risk well and trade safe with stop loss.

APT: Channel Down BreakoutTrade setup : After sizeable gains (~400% YTD 2023), price was met with selling pressure around HKEX:20 resistance area. It was consolidating in a Channel Down pattern and appears to have broken out of it, indicating potential trend reversal. There’s potential upside potential to $15 or even $20.
Pattern : Price was trading in a Channel Down pattern. With complete patterns (i.e. a breakout) – initiate a trade when the price breaks through the channel’s trendlines, either on the upper or lower side. When this happens, the price can move rapidly in the direction of that breakout.
Trend : Downtrend on Short- and Medium-Term basis and Neutral on Long-Term basis.
Momentum is Mixed as MACD Line is above MACD Signal Line (Bullish) but RSI ~ 50 (Neutral).
Support and Resistance : Nearest Support Zone is $10.0, then $5.0. The nearest Resistance Zone is $15.0, then $20.0.