APT - trapped sellers after 36% dropAPT - trapped sellers after 36% drop
APT dropped 36% since high $19.33
at this moment open interest started rising a lot with the NEgative delta
In most cases after such a drop short sellers become trapped and prices go oppositely to take their SL
In a video i share with u 3 ideas of how to take trades and potential targets
Aptos

APT - Best are for LONG nearly 7.4APT - Best are for LONG nearly 7.4
In a video u can see that price liquidate a lot of buyers also dropped by 60%
at that key level u have a best opportunity to take LONG for LONG terrm

Long AptosAptos has suffered during the last couple of weeks making the price especially attractive here. Additionally, we are nearing a good area of support both price-wise and on our RSI. An entry here at 11.87 with a target of 18.00 and a SL of 9.87 puts our RRR over 3 to 1. I like these odds.

APTUSD 5DAPT ~ 5D 📈
#APT We expect the Cup and Handle pattern to form from here. Make purchases gradually in this Support Zone with a minimum target of 20%+ 📈

APT: Pullback in UptrendTrade setup : After a bearish breakout from Channel Up pattern, price has pulled back to $13.00. However, it remains in an Uptrend. Momentum is inflecting bullish again (MACD Histogram rising) and price could swing back up to $16.75 for +25% potential upside. Stop Loss (SL) level at $11.90.
Trend : Downtrend on Short-Term basis and Uptrend on Medium- and Long-Term basis.
Momentum is Bearish (MACD Line is below MACD Signal Line, and RSI is below 45).
Support and Resistance : Nearest Support Zone is $13.00, which it broke, then $11.00. The nearest Resistance Zone is $16.75, then $20.00.

#APT/USDT#APT
The price is moving in a downward channel on a 4-hour frame, about to break upward
The area in green is a very strong support area from which the price rebounded at price 14
We have a downtrend on the RSI indicator about to occur. The fraction is up
We have a higher stability moving average of 100
Entry price: 14.1
First goal 15
Second goal 16.6
Third goal 18.23

🔥ID is Another TOP Altcoin on BinanceSpaceID fell by -85% from it's highs. That's much more then most of fresh altcoins on Binance (which has a top growth potential): WLD, ARKM, EDU etc.
It means that not to much people to pay attention to this altcoin and don't want to buy it now...still. The retailers want to buy such altcoins when it pump by 3-4x which is end of the growth.
The same pattern with Aptos supposes these target for ID:
1. $0.36 (+97%) - the key level
2. $1.05 (+457%) - the local high
💥 The bull market is alredy in action and will take just 1-2 years. Please use this time to your advantage!
like❤️ and follow
Check the links and get a BONUS🎁 from me👇

APTUSDTHi guys
It seems that the two price areas that we have identified are very low risk for buying.
According to the issued divergences, the possibility of a downward trend should be considered.
Interestingly, this cryptocurrency does not have any resistance range after the price area of $20.4!
What do you think?

APT/USDT Ready to Claim its Thrown? 👀🚀Aptos Analysis💎Paradisers, let's examine the recent market trends for #APTUSDT, which has impressively broken free from its descending channel pattern.
💎At this moment, #Aptos is advancing towards the descending resistance from within the demand zone. This situation presents a chance for the price to rebound from this area and embark on an upward journey, aiming for the bearish Order Block (OB) as its forthcoming milestone.
💎If AMEX:APT does not achieve the anticipated bounce and instead dips below the demand zone, we could see a fallback to the Bullish OB region around the $7.57 mark, where it would seek rejuvenated impetus for an ascent.
💎The Bullish OB zone has historically been a key factor, reliably initiating significant market recoveries upon interaction. Yet, a failure of this zone, indicating a shift towards bearish trends, may lead to a pursuit of bullish momentum from a more subdued position.
💎In case #APT doesn't harness the momentum from this or any subsequent level, a continued descent might ensue. Rest assured, Paradisers, your ParadiseTeam is vigilantly monitoring these developments, ready to offer insights and guidance through these market shifts

[APTUSDT] - Massive round bottom pattern3D chart showing a massive round bottom pattern and not get out yet
price need to breakout the 0.5 fib resistance for bullish rally
our main target is 100$
Thank you, and for more ideas, hit "Like" and "Follow"!🎯

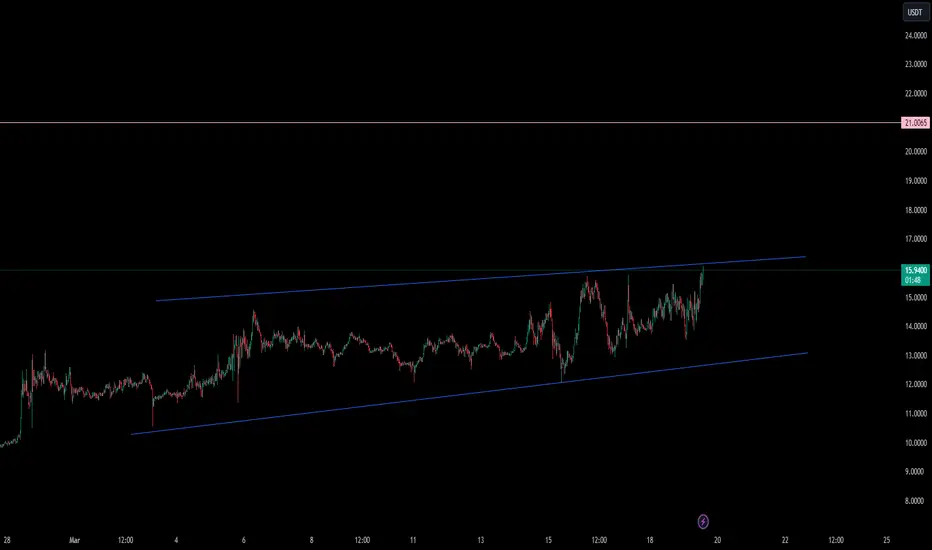
APT: Channel UpTrade setup : Price is in an Uptrend, showing relative strength as it continues to advance even during an overall market correction. We would be buyers on pullbacks to Channel support trendline (~$16.00). Stop Loss (SL) at $14.50.
Pattern : Price is trading in a Channel Up pattern. With emerging patterns, traders who believe the price is likely to remain within its channel can initiate trades when the price fluctuates within its channel trendlines. With complete patterns (i.e. a breakout) – initiate a trade when the price breaks through the channel’s trendlines, either on the upper or lower side. When this happens, the price can move rapidly in the direction of that breakout.
Trend : Uptrend across all time horizons (Short- Medium- and Long-Term).
Momentum is Bullish (MACD Line is above MACD Signal Line and RSI is above 55).
Support and Resistance : Nearest Support Zone is $15.00 (previous resistance), then $13.00. The nearest Resistance Zone is $16.75, which it broke, then $20.00.


APT - 15% rise of Open interest - big move is comingAPT - 15% rise of Open interest - big move is coming
In a video i compared it with LINK example
watch full update


APT: Channel UpTrade setup : Price is in an Uptrend, showing relative strength as it continues to advance even during an overall market correction. Bullish break above $15.00 resistance signals continuation of an Uptrend with +10% upside potential to $16.75 near-term. Stop Loss (SL) at $13.90.
Pattern : Price is trading in a Channel Up pattern. With emerging patterns, traders who believe the price is likely to remain within its channel can initiate trades when the price fluctuates within its channel trendlines. With complete patterns (i.e. a breakout) – initiate a trade when the price breaks through the channel’s trendlines, either on the upper or lower side. When this happens, the price can move rapidly in the direction of that breakout.
Trend : Uptrend across all time horizons (Short- Medium- and Long-Term).
Momentum is Bullish (MACD Line is above MACD Signal Line and RSI is above 55).
Support and Resistance : Nearest Support Zone is $13.00 (previous resistance), then $11.00. The nearest Resistance Zone is $15.00, which it broke, then $16.75 and $20.00.

APT (Y24.P1.Video1).Cup and Handle, or just parabolic?Hi Traders,
Here are my thoughts on what is taking place, what levels are worth taking a long and what assumptions I have to think these target levels are possible.
All the best,
S.SAri

APT (Y24.P1.E2) Potential parabolic or Cup&HandleHi Traders,
#APT has been going well and held up with the recent pulbback...it didn't.
Its at resistance and like RNDR, has the makings of a parabolic structure along with a potential cup and handle.
A pullback to the grey zone would be the handle for wave 4.
All the best,
S.SAri

APT NEW INCREASE VOLUMEAPT shows a new increase in volume, which could be confirmed in the coming time frames.
We will follow the coin to see if it's able to confirm.
The reason for the volume is the trend data that this coin shows.
This coin is at basic choice on daily trends.
APTUSD 1WAPT ~ 1W 📈
#APT Make purchases gradually after breaking through this resistance line, with a target of at least 20%++

APT: 2-type position📊Analysis by AhmadArz:
🔍Entry:
buy: 13.409
sell: 13.952
🛑Stop Loss:
buy: 13.173
sell: 14.604
🎯Take Profit:
buy:13.62-13.95
sell: 13.45-13.06-12.62-12.19
🔗"Uncover new opportunities in the world of cryptocurrencies with AhmadArz.
💡Join us on TradingView and expand your investment knowledge with our five years of experience in financial markets."
🚀Please boost and💬 comment to share your thoughts with us!

APT / APTUSDTGood Luck >>
• Warning •
Any deal I share does not mean that I am forcing you to enter into it, you enter in with your full risk, because I'll not gain any profits with you in the end.
The risk management of the position must comply with the stop loss.
(I am not sharing financial or investment advice, you should do your own research for your money.)

APT: Resistance BreakoutTrade setup : Price resumed its Uptrend. Bullish break above $13.00 resistance signals continuation of an Uptrend with upside potential to $15.00 near-term and $16.75 mid-term. Stop Loss (SL) at $12.00.
Trend : Uptrend across all time horizons (Short- Medium- and Long-Term).
Momentum is Bullish (MACD Line is above MACD Signal Line and RSI is above 55).
Support and Resistance : Nearest Support Zone is $11.00 (previous resistance), then $10.00. The nearest Resistance Zone is $13.00, which it broke, then $15.00.

Aptos $12.20 ➥ $20.00 - $125.00Aptos $12.20 ➥ $20.00 - $125.00
Take profit - $20.00 (10%)
Take profit - $27.50 (10%)
Take profit - $29.00 (10%)
Take profit - $36.00 (10%)
Take profit - $50.00 (10%)
Take profit - $60.00 (10%)
Take profit - $70.00 (10%)
Take profit - $90.00 (30%)
