APT/USDT Keep an eye on the support, If bounce APT will back UP!💎APT has recently shown significant market dynamics. Currently, APT is facing rejection after testing the Bearish OB zone and is now retesting the support area around 10.85 to generate new momentum for a breakout.
💎 If APT successfully breaks above the supply area, its probability could signal a continuation of the upward movement, potentially leading to reaching our target area.
💎 However, if APT fails to maintain the support area and breaks below it, the next critical level is the Bullish OB area. APT must bounce from this area, as failure to do so could result in losing the support trendline.
💎 If this occurs, APT may switch back to a downward trajectory, continuing further downward movement.
Aptos

APTOS (Y24.P1.E1).Support level to go longHi traders,
We have 2 levels of interest. if it dips to the 0.5, its a buy otherwise I see this nPOC holding it up on the 0.382 fib.
I also has MAs coming up ... refer to some screen shots.
All the best,
S.SAri

APT/USDT Potential Uptick from Key Demand Zone? 🚀APT💎 Paradisers, gear up for a thrilling trade with #APTUSDT, now finding its footing at an essential demand zone, signaling a possible market move.
💎 Diving into #APTOS latest moves, it's apparent that it fell short of breaking past its previous high, stirring up bearish vibes. Yet, a bullish shift seems on the horizon from the demand level of $9.3298. With momentum on our side, we're eyeing a climb capable of surpassing the looming resistance.
💎 Should momentum for AMEX:APT begin to fade, a bullish revival from the solid support at $7.8646 is what we're looking out for. However, dipping below this critical level may indeed mark a transition towards a deeper bearish phase

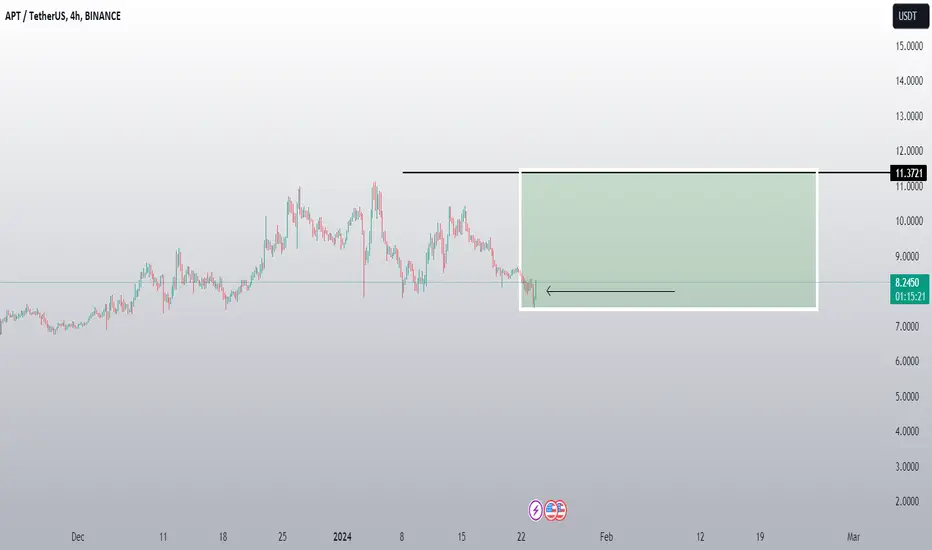
APT/USDT: APT Trade EntryWe are considering a scenario of the beginning of APT purchases.
Since the beginning of the second half of October, the asset has been demonstrating an upward trend, starting from the price level of $4.7926 and reaching $11.0934. This growth amounted to over 130%.
At the moment, APT is undergoing a correction and is trading around the inclined resistance level. The POC volume level is also close to this resistance level.
We are entering a trade on APT with the expectation of growth to the price level of $11.0934, which is more than 16%. Upon reaching this price, we plan to partially close the position, leaving it open in case of buyer activity and positive market sentiment.
Then we will hold the position until the next target at the price level of $12.9259.

Aptos APT Big DirectionAptos is a strong project but with hidden motives.
We are in a very long acummulation phase for the next big move.
There are 2 scenarios that I look to:
1) We settle the ground between 8.5$ and 10$ and go to a new ATH, slowly.
2) We revisit the lower Line I have drawn around 5.7~6$ for a quick retest and go for 34$+.
My plan is to go very big on purchasing once APT touches 6$, since I already have a good amount bought at 9.7$ and Hold long term.

Longing Aptos to $11I’ve got another trade for you all here in Aptos. Nearly all of my signals are flashing green on APT. I can’t sit the sidelines waiting on Bitcoin here. I’m in at $9.50. Targeting $11+. SL is $8.73 (just under the VRVP PoC) for a 2/1 rrr.

APT/USDT BYBIT:APTUSDT.P
This idea has a medium-term profit target.
All targets are indicated on the graph.
- Risk 1% on deposit
- R/R 1/2
P.S (This is not an investment recommendation, this is my personal opinion.)

crypto portfolio 01 : (aptos)hello dear trader
this price action for aptoos with btc pair
there are two senario for aptos buy with btc pair ...
What Is Aptos?
Aptos is a Layer 1 Proof-of-Stake (PoS) blockchain that employs a novel smart contract programming language called Move, a Rust-based programming language that was independently developed by Meta (formerly Facebook)’s Diem blockchain engineers.
Aptos’s vision is a blockchain that brings mainstream adoption to web3 and empowers an ecosystem of DApps to solve real-world user problems.
The PoS blockchain can achieve a theoretical transaction throughput of over 150,000 transactions per second (tps) through parallel execution.
In March 2022, Aptos raised $200 million in a seed round led by the venture capital firm Andreessen Horowitz (a16z). Other crypto heavyweights like Tiger Global and Multicoin Capital took part in the funding round. Fast forward to July, the startup raised another $200 million in a Series A round with participation from Dragonfly, Apollo Global, Franklin Templeton, Animoca, Jump Crypto and others.
Two months later, Binance Labs made a strategic investment of an undisclosed amount in Aptos.
good luck
mehdi

APTUSDT.P Long on 1hr TFLet’s go!
Long signal triggered on the 1 hour chart for APTUSDT.P
Stop loss, entry and TP’s all shown in the chart.
After hitting TP1 i will close 80% of my position, and move SL to break even.
Im using 10x leverage and risking only a small portion of my account (2-3%)
Order’s for both TP and SL are set, in case of high volatility!
**This is not financial advice! Just my personal opinions and thoughts being shared! You are responsible for your own trades and should do your own research before entering.**
And remember: Risk management is the key to success!

APT ANALYSIS (4H)From where we have inserted "Start" on the chart, a correction has been created, which looks like a diametric (or symmetrical) one.
We now seem to be in the G wave of this diametric. We expect to move from the specified supply side to the Demand side.
For risk management, please don't forget stop loss and capital management
When we reach the first target, save some profit and then change the stop to entry
Comment if you have any questions
Thank You

APT: Descending TriangleTrade setup : Trends are mixed. Price is consolidating in a Descending Triangle pattern. We wait for a breakout.
Pattern : Price is trading in a Descending Triangle pattern. Typically, a breakout will occur in the direction of the existing trend. Most traders will take a position once the price action breaks through the bottom line of the triangle with increased volume, which is when the price should decline an amount equivalent to the widest section of the triangle.
Trend : Neutral on Short- and Medium-Term basis and Uptrend on Long-Term basis.
Momentum is Mixed as MACD Line is above MACD Signal Line (Bullish) but RSI ~ 50 (Neutral).
Support and Resistance : Nearest Support Zone is $8.00 (previous resistance), then $5.40. The nearest Resistance Zone is $10.00, then $12.50.

APT is going bullish if this scenario happenedfirst thing we need to see move up and break the ressistance of 8.70 $ and we see the first higher high if that happened then apt is goin bollish, first target will be 10.17$
this is my analyse it's not a recomandation to buy or sell !!


In mid big candle(APT)📊Analysis by AhmadArz:
🔍Entry: 8.186
🛑Stop Loss: 8.080
🎯Take Profit: 8.311 -8.418 -8.610 -8.742
🔗"Uncover new opportunities in the world of cryptocurrencies with AhmadArz.
💡Join us on TradingView and expand your investment knowledge with our five years of experience in financial markets."
🚀Please boost and💬 comment to share your thoughts with us!

APT NEW VOLUME INCREASEThank you for reading this update.
Depending on our study we see that APT has a good chance of volume increase.
This updates depending on day trade, And the market should confirm with time the right market way.
We did follow before more coins, and these coin seems to have an increase of break in the coming time.
#Nottradingadvice
#For Day traders take always profits when the market increase
#Expect nothing from the markets, but follow what it shows.
I Cannot Short This !!! situation+next targets.Hi.
Time to break out of the rounding bottom on weekly & also above the key level.
AB=CD
✅Thank you, and for more ideas, hit ❤️Like❤️ and 🌟Follow🌟!

APT: Channel UpTrade setup : Price is in an Uptrend, trading in a Channel Up pattern. Swing Traders: can trade the Channel (enter near $8 support and exit near $11 channel resistance trendline), Stop Loss (SL) level at $7.40 (just below prior swing low and nearest support). Trend Traders wait for a breakout from Channel Up pattern.
Pattern : Price is trading in a Channel Up pattern. With emerging patterns, traders who believe the price is likely to remain within its channel can initiate trades when the price fluctuates within its channel trendlines. With complete patterns (i.e. a breakout) – initiate a trade when the price breaks through the channel’s trendlines, either on the upper or lower side. When this happens, the price can move rapidly in the direction of that breakout.
Trend : Neutral on Short-Term basis and Uptrend on Medium- and Long-Term basis.
Momentum is Mixed as MACD Line is below MACD Signal Line (Bearish) but RSI ~ 50 (Neutral). MACD Histogram bars are rising, which suggests that momentum could be nearing another upswing.
Support and Resistance : Nearest Support Zone is $8.00 (previous resistance), then $5.40. The nearest Resistance Zone is $10.00, then $12.50.

the foolish play....lots of people entered these sub 10 $ Aptos positions like absolute beginners.
with a bearish divergence on the weekly and Bitcoin heading to 35k for a correction..
this will send aptos to the range's wick at 7.8$ ish at least.
NFI DYOR

APT: Channel UpTrade setup : Price is in an Uptrend, trading in a Channel Up pattern. Swing Traders: can trade the Channel (enter near $8 support and exit near $10 resistance), Stop Loss (SL) level at $7.40 (just below prior swing low and nearest support). Trend Traders wait for a breakout from Channel Up pattern.
Pattern : Price is trading in a Channel Up pattern. With emerging patterns, traders who believe the price is likely to remain within its channel can initiate trades when the price fluctuates within its channel trendlines. With complete patterns (i.e. a breakout) – initiate a trade when the price breaks through the channel’s trendlines, either on the upper or lower side. When this happens, the price can move rapidly in the direction of that breakout.
Trend : Neutral on Short-Term basis and Uptrend on Medium- and Long-Term basis.
Momentum is Mixed as MACD Line is below MACD Signal Line (Bearish) but RSI ~ 50 (Neutral).
Support and Resistance : Nearest Support Zone is $8.00 (previous resistance), then $5.40. The nearest Resistance Zone is $10.00, then $12.50.

APT. Correction is overdue.APT has been overbought for several months while simultaneously being in an upward trend. Given the future global correction ahead of the major bull market, it is reasonable to short and expect at least a 20% decline. Also, there is a chance to buy an asset 37% below current prices.

Small traget (APT)📊Analysis by AhmadArz:
Short TP
🔍Entry: 8.915
🛑Stop Loss: 8.83
🎯Take Profit: 9.006
🔗"Uncover new opportunities in the world of cryptocurrencies with AhmadArz.
💡Join us on TradingView and expand your investment knowledge with our five years of experience in financial markets."
🚀Please boost and💬 comment to share your thoughts with us!

APT: Pullback in UptrendTrade setup : Price is in an Uptrend. Now we wait for price to either 1) break above $10 to signal continuation of uptrend, with upside potential to $12.50, or 2) pull back near $8 support for a swing trade entry in Uptrend with upside potential back to $10. Stop Loss (SL) level at $7.40 (just below prior swing low and nearest support).
Trend : Uptrend across all time horizons (Short- Medium- and Long-Term).
Momentum is Bearish (MACD Line is below MACD Signal Line, and RSI is below 45).
Support and Resistance : Nearest Support Zone is $8.00 (previous resistance), then $5.40. The nearest Resistance Zone is $10.00, which it broke, then $12.50.

APT: Pullback in UptrendTrade setup : Price is in an Uptrend. Following a failed break above $10.00 resistance, price has pulled back to $8.00 support, which could be an attractive swing trade entry in Uptrend with upside back to $10.00 near-term and $12.50 medium-term. Stop Loss (SL) level at $7.75 (just below prior swing low and nearest support).
Trend : Uptrend across all time horizons (Short- Medium- and Long-Term).
Momentum is Mixed as MACD Line is below MACD Signal Line (Bearish) but RSI ~ 50 (Neutral).
Support and Resistance : Nearest Support Zone is $8.00 (previous resistance), then $5.40. The nearest Resistance Zone is $10.00, then $12.50.
