APT Main trend. 21 02 2025Logo rhymes. Time frame 3 days. Medium-term work in the horizontal channel range.
Line chart without “market noise”.
Local work in the wedge formation range.
APTUSD

APTUSDT Analysis: Waiting for Lower LevelsI see no reason not to wait for lower levels in APTUSDT. The market conditions suggest that there might be a better opportunity for entries at these levels.
Key Points:
Lower Levels: Waiting for lower levels might provide better risk/reward setups.
Market Conditions: Keep in mind that market conditions can change quickly, so stay cautious.
Confirmation Indicators: Use CDV, liquidity heatmaps, volume profiles, volume footprints , and upward market structure breaks in lower time frames for validation.
Learn With Me: If you're interested in learning how to use these tools for accurate demand zone identification, feel free to DM me.
If this analysis helps you, please don’t forget to boost and comment. Your support motivates me to share more insights!
If you think this analysis helps you, please don't forget to boost and comment on this. These motivate me to share more insights with you!
I keep my charts clean and simple because I believe clarity leads to better decisions.
My approach is built on years of experience and a solid track record. I don’t claim to know it all, but I’m confident in my ability to spot high-probability setups.
If you would like to learn how to use the heatmap, cumulative volume delta and volume footprint techniques that I use below to determine very accurate demand regions, you can send me a private message. I help anyone who wants it completely free of charge.
My Previous Analysis
🎯 ZENUSDT.P: Patience & Profitability | %230 Reaction from the Sniper Entry
🐶 DOGEUSDT.P: Next Move
🎨 RENDERUSDT.P: Opportunity of the Month
💎 ETHUSDT.P: Where to Retrace
🟢 BNBUSDT.P: Potential Surge
📊 BTC Dominance: Reaction Zone
🌊 WAVESUSDT.P: Demand Zone Potential
🟣 UNIUSDT.P: Long-Term Trade
🔵 XRPUSDT.P: Entry Zones
🔗 LINKUSDT.P: Follow The River
📈 BTCUSDT.P: Two Key Demand Zones
🟩 POLUSDT: Bullish Momentum
🌟 PENDLEUSDT.P: Where Opportunity Meets Precision
🔥 BTCUSDT.P: Liquidation of Highly Leveraged Longs
🌊 SOLUSDT.P: SOL's Dip - Your Opportunity
🐸 1000PEPEUSDT.P: Prime Bounce Zone Unlocked
🚀 ETHUSDT.P: Set to Explode - Don't Miss This Game Changer
🤖 IQUSDT: Smart Plan
⚡️ PONDUSDT: A Trade Not Taken Is Better Than a Losing One
💼 STMXUSDT: 2 Buying Areas
🐢 TURBOUSDT: Buy Zones and Buyer Presence
🌍 ICPUSDT.P: Massive Upside Potential | Check the Trade Update For Seeing Results
🟠 IDEXUSDT: Spot Buy Area | %26 Profit if You Trade with MSB
📌 USUALUSDT: Buyers Are Active + %70 Profit in Total
🌟 FORTHUSDT: Sniper Entry +%26 Reaction
🐳 QKCUSDT: Sniper Entry +%57 Reaction
📊 BTC.D: Retest of Key Area Highly Likely
I stopped adding to the list because it's kinda tiring to add 5-10 charts in every move but you can check my profile and see that it goes on..

#APT/USDT#APT
The price is moving in a descending channel on the 1-hour frame and is adhering to it well and is heading to break it strongly upwards and retest it
We have a bounce from the lower limit of the descending channel, this support is at a price of 5.85
We have a downtrend on the RSI indicator that is about to break and retest, which supports the rise
We have a trend to stabilize above the Moving Average 100
Entry price 6.13
First target 6.62
Second target 6.91
Third target 7.31

APTUSDT 6DAPT ~ 6D Analysis
#APT If you still have a Conviction on this coin,. buy gradually from here with a minimum target of 20%+

#APT/USDT Ready to launch upwards#APT
The price is moving in a descending channel on the 1-hour frame and is adhering to it well and is heading to break it strongly upwards
We have a bounce from the lower limit of the descending channel, this support is at a price of 7.20
We have a downtrend on the RSI indicator that is about to be broken, which supports the rise
We have a trend to stabilize above the moving average 100
Entry price 7.54
First target 7.84
Second target 8.17
Third target 8.50

Is APT Preparing to Shock the Market? Key Levels to Watch!Yello, Paradisers! Is #APT setting up for a breakout that could catch sellers completely off guard? Let’s dive in because this move could shape the next big opportunity.
💎#APTUSDT is currently trading inside a bullish falling wedge pattern—a technical setup that often signals a reversal to the upside. This pattern indicates that a potential bullish move could be in the making as the price narrows closer to a breakout point.
💎Right now, the price is approaching a critical support zone between $7.80 and $7.40, a level that has consistently acted as strong support since October 2024. History tells us this region is a key battleground for buyers and sellers, and once again, the bulls have an opportunity to step in and defend it. If they do, a reversal from this zone could catch many sellers by surprise.
💎The breakout level to watch is $8.80, and once the price clears this threshold, momentum could accelerate. The first resistance comes in at $9.30, a moderate barrier that may slow things down briefly. However, if APT powers through this level, the next major target lies at the $10.80 to $11.40 zone, which includes a Fibonacci midpoint resistance and aligns with the pattern’s projected target.
Patience and discipline are key here, Paradisers. The market often tests both bulls and bears before making decisive moves, so stay vigilant.
MyCryptoParadise
iFeel the success🌴

#APT Ready for a Massive Move or Not? Bulls Ready to Push it Yello, Paradisers! Is #APTUSDT gearing up for a breakout, or are we at risk of a bearish breakdown? Let’s dive into the key levels of #Aptos:
💎The 8-hour chart shows a clear falling wedge—a bullish reversal pattern—suggesting a potential breakout could be on the horizon. The multiple liquidity sweeps at the lower boundary (marked by green arrows) indicate the market has already flushed out weak hands. However, to confirm the move, #APTUSD needs a decisive breakout above the wedge’s descending resistance line.
💎#APT is currently approaching a significant resistance at $10.78, sitting just above the descending wedge’s upper boundary. If price action breaks and closes above this level, it could trigger a bullish rally toward the $14.00–$15.00 major resistance zone, where sellers are likely to step in. Watch this level closely, as it holds the key to further upside momentum.
💎On the downside, the $7.2 strong demand zone has supported buyers and remains a key defense area. If this level fails to hold, the next line of resistance for the bulls is $5.69. These support zones have already been held multiple times and the probability is high that these will be held now too.
💎If #APT closes below the $5.69 level, it would invalidate the bullish setup and open the door for a sharper decline toward lower lows.
Stay focused, patient, and disciplined, Paradisers🥂
MyCryptoParadise
iFeel the success🌴

#APT/USDT Ready to go higher#APT
The price is moving in a descending channel on the 1-hour frame and sticking to it well
We have a bounce from the lower limit of the descending channel, this support is at a price of 4.20
We have a downtrend on the RSI indicator that is about to be broken, which supports the rise
We have a trend to stabilize above the moving average 100
Entry price 8.23
First target 8.58
Second target 8.82
Third target 9.08

#APT/USDT#APT
The price is moving in a descending channel on the 1-hour frame and is expected to continue upwards
We have a trend to stabilize above the moving average 100 again
We have a descending trend on the RSI indicator that supports the rise by breaking it upwards
We have a support area at the lower limit of the channel at a price of 8.40
Entry price 8.58
First target 8.87
Second target 9.27
Third target 9.61

#APT(SPOT) entry range(5.95- 7.95) T.(15.99) SL(5.48)BINANCE:APTUSDT
entry range ( 5.95- 7.95)
Target1 (8.90) - Target2 (11.70)- Target3 (13.20)- Target4 (15.99)
SL .1D close below (5.48)
*** collect the coin slowly in the entry range ***
*** No FOMO - No Rush , it is a long journey ***
**** #Manta ,#OMNI, #DYM, #AI, #IO, #XAI , #ACE #NFP #RAD #WLD #ORDI #BLUR #SUI #Voxel #AEVO #VITE #APE #RDNT #FLUX #NMR #VANRY #TRB #HBAR #DGB #XEC #ERN #ALT #IO #ACA #HIVE #ASTR #ARDR #PIXEL #LTO #AERGO #SCRT #ATA #HOOK #FLOW #KSM #HFT #MINA #DATA #SC #JOE #RDNT #IQ #CFX #BICO #CTSI #KMD #FXS #DEGO #FORTH # AST #PORTAL #CYBER #CLV #RIF
ENJ #ZIL #APT ****

The key is whether it can rise above 9.39
Hello, traders.
If you "Follow", you can always get new information quickly.
Please click "Boost" as well.
Have a nice day today.
-------------------------------------
(APTUSDT 1W chart)
It seems that the M-Signal indicator on the 1M chart has started to be created.
Accordingly, the 7.41-9.39 section is an important support and resistance section.
When it shows support in the 7.41-9.39 section, it is a time to buy.
-
In order to turn into an uptrend, the price must be received above the MS-Signal (M-Signal on the 1W chart) indicator.
Therefore, the key is whether it can receive support and rise near 9.39.
-
The high point boundary section is formed in the 12.06-14.50 section, so if it rises above this section, it is expected to create a new upward wave.
If it falls below 7.41, it is expected to enter the mid- to long-term investment area.
Therefore, if possible, I think it would be better to trade when the price is maintained above 7.41 and wait and see if it falls below 7.41.
-
(1M chart)
-
Thank you for reading to the end.
I hope you have a successful trade.
--------------------------------------------------
- Big picture
I used TradingView's INDEX chart to check the entire section of BTC.
(BTCUSD 12M chart)
Looking at the big picture, it seems to have been maintaining an upward trend following a pattern since 2015.
That is, it is a pattern that maintains a 3-year uptrend and faces a 1-year downtrend.
Accordingly, the uptrend is expected to continue until 2025.
-
(LOG chart)
As you can see from the LOG chart, the uptrend is decreasing.
Accordingly, the 46K-48K range is expected to be a very important support and resistance range from a long-term perspective.
Therefore, we expect that we will not see prices below 44K-48K in the future.
-
The Fibonacci ratio on the left is the Fibonacci ratio of the uptrend that started in 2015.
In other words, it is the Fibonacci ratio of the first wave of the uptrend.
The Fibonacci ratio on the right is the Fibonacci ratio of the uptrend that started in 2019.
Therefore, this Fibonacci ratio is expected to be used until 2026.
-
No matter what anyone says, the chart has already been created and is already moving.
How to view and respond to this is up to you.
When the ATH is updated, there are no support and resistance points, so the Fibonacci ratio can be used appropriately.
However, although the Fibonacci ratio is useful for chart analysis, it is ambiguous when used as support and resistance.
This is because the user must directly select the important selection points required to create Fibonacci.
Therefore, since it is expressed differently depending on how the user specifies the selection points, it can be useful for chart analysis, but it can be seen as ambiguous when used for trading strategies.
1st : 44234.54
2nd : 61383.23
3rd : 89126.41
101875.70-106275.10 (Overshooting)
4th : 134018.28
151166.97-157451.83 (Overshooting)
5th : 178910.15
-----------------

#APT/USDT Ready to go higher#APT
The price is moving in a descending channel on the 1-hour frame and sticking to it well
We have a bounce from the lower limit of the descending channel, this support is at 15.50
We have a downtrend on the RSI indicator that is about to be broken, which supports the rise
We have a trend to stabilize above the 100 moving average
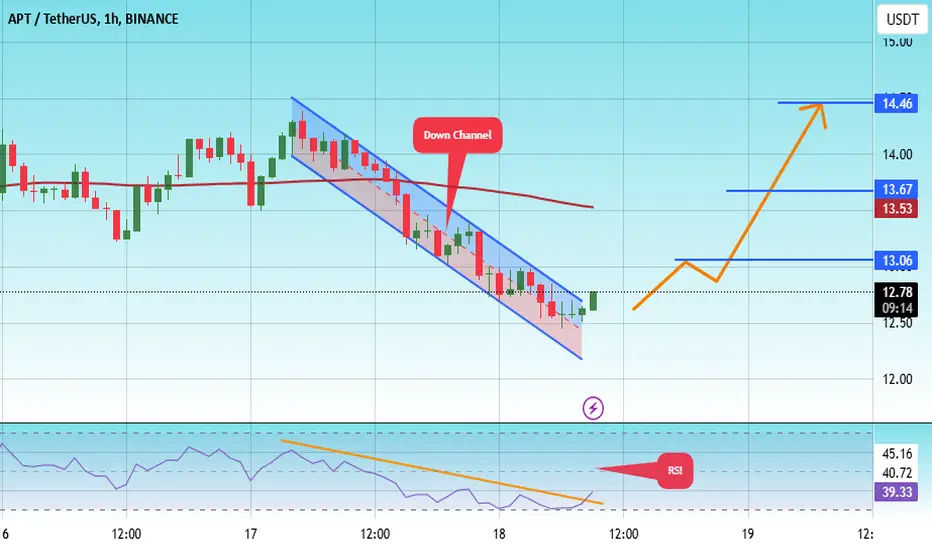
Entry price 12.77
First target 13.06
Second target 13.76
Third target 14.46
Aptus (Apt)Apt usdt Daily analysis
Time frame daily
Risk rewards ratio >2 👈👌
Target 17$
We have a resistance area in 17_18 $
So my target is 17$ and I guess price will move up and down between 17 and 18 $ then will star to upper target 23$

Not yet APT, not yetUnlike its successful cousin SUI, it seems APT needs to take longer to consolidate for any strong upward movement, watch the triangle


APT plan Im expecting a pullback of APT in orange zone where I will do spot buy. Do not trade in leverage right now. I expect btc to go lower at the moment.

#APT/USDT Ready to go higher#APT
The price is moving in a descending channel on the 1-hour frame and sticking to it well
We have a bounce from the lower limit of the descending channel, this support is at 13.20
We have a downtrend on the RSI indicator that is about to break, which supports the rise
We have a trend to stabilize above the moving average 100
Entry price 13.52
First target 14.07
Second target 14.48
Third target 14.94

APTUSDT - Real project ... Potential targets!APT is one of the important coins in layer1 Network with (7.65B marketcap)
if u want to triple ur capital then buy APT!
- Strong project
- Ranked 25 in marketcap
- displays a Cup and Handle pattern in weekly chart
- Hasn't moved strongly yet
Best regards Ceciliones🎯

#APT/USDT Ready to go higher#APT
The price is moving in a descending channel on a 15-minute frame and sticking to it well
We have a bounce from the lower limit of the descending channel, this support is at 13.00
We have a downtrend on the RSI indicator that is about to be broken, which supports the rise
We have a trend to stabilize above the moving average 100
Entry price 13.40
First target 13.73
Second target 14.19
Third target 14.62

#APT/USDT Ready to go higher#APT
The price is moving in a descending channel on the 30-minute frame and sticking to it well
We have a bounce from the lower limit of the descending channel, this support is at a price of 12.33
We have a downtrend on the RSI indicator that is about to be broken, which supports the rise
We have a trend to stabilize above the moving average 100
Entry price 12.80
First target 13.18
Second target 13.57
Third target 13.96

#APT/USDT
#APT
We have a trend to stabilize above the moving average 100 again.
We have a downtrend on the RSI indicator that supports the rise by breaking it upwards.
We have a support area at the lower limit of the channel at a price of
11.00
Entry price 11.50
First target 12.42
Second target 13.07
Third target 13.89

$APT TIME TO RETRACEIn 10 hours, APT has gone up +45%.
I believe it is due for a pullback.
Under $10.50 we should see more downside.

APTOS Broken out from a Hunt Volatility Funnel... $40+Building on #SUI's impressive recent performance, it seems that this new #Blockchain for this cycle is poised to attract supportive investment.
While the technical setup isn't flawless, for a perfect #HVF pattern, with a L2 lower versus L1, it still has a strong chance of reaching its anticipated upper targets during this bullish phase!
