APT / APTUSDTGood Luck >>
• Warning •
Any deal I share does not mean that I am forcing you to enter into it, you enter in with your full risk, because I'll not gain any profits with you in the end.
The risk management of the position must comply with the stop loss.
(I am not sharing financial or investment advice, you should do your own research for your money.)
APTUSD

APT/USDT Main trend. Wedge. Logarithm. Timeframe 3 days. It is forming, as on many mid-liquidity altcoins—a descending wedge.
Here's what it looks like on a line price chart .
Pivot Zones. Trading Strategies. .
At the moment, the drop is -76%. Usually assets of this liquidity fall by -90%, but perhaps now is not the time yet or there is too much hype for cryptocurrency. You can work from the average set/reset price, i.e. allocate money in advance. Another option is to wait for the breakdown of the wedge.
Risk and mani-management.
Remember that with the general market situation, localized takeouts (squeezes) of stop-losses are possible. More globally, do not rule out the possibility of a so-called "black swan" (not a crypto story) since 03 2020 at the dumping of the crown virus. Then the descending wedge can break with one stick - squeeze (like the whole market), and no matter how beautiful the chart of this cryptocurrency looked earlier. If that happens, only buy with a net of orders and disconnect from media news scaremongering.
Scare and save, this is the essence of wolves earning money and loss of funds of illusorily scared and then saved sheep. .
In any case, the descending wedge has been formed (bullish formation), breaking through its resistance (breaking the downtrend) is a matter of time, not the action itself. Moreover, this very HYIP and something "valuable" should be sold (create HYIP and media demand) to those who do not appreciate such things and do not divide cryptocurrencies into good and bad, because they are just tools with the help of which "out of nothing" you can make fabulous money on the faith of fools in something abstract.
Do not catch the lows and highs of the trend. Work logic like the big market participants:
"I never know the exact future, but there is a more likely or less likely scenario, those are the ones I stick to. I am prepared for any localized outcome of events, even the less likely". Absolutely not interested in crypto news and majority opinion" .

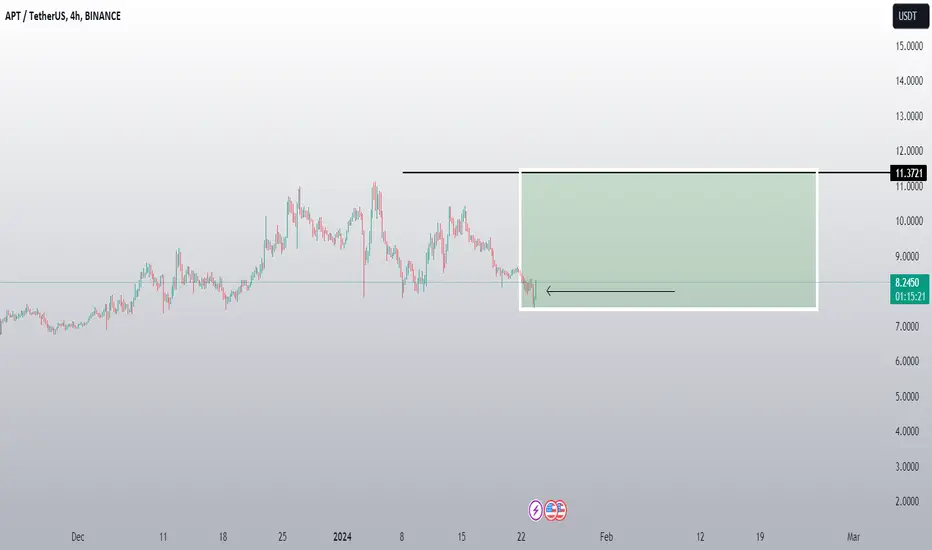
Aptos APT Big DirectionAptos is a strong project but with hidden motives.
We are in a very long acummulation phase for the next big move.
There are 2 scenarios that I look to:
1) We settle the ground between 8.5$ and 10$ and go to a new ATH, slowly.
2) We revisit the lower Line I have drawn around 5.7~6$ for a quick retest and go for 34$+.
My plan is to go very big on purchasing once APT touches 6$, since I already have a good amount bought at 9.7$ and Hold long term.

APT ANALYSIS (4H)From where we have inserted "Start" on the chart, a correction has been created, which looks like a diametric (or symmetrical) one.
We now seem to be in the G wave of this diametric. We expect to move from the specified supply side to the Demand side.
For risk management, please don't forget stop loss and capital management
When we reach the first target, save some profit and then change the stop to entry
Comment if you have any questions
Thank You

APT is going bullish if this scenario happenedfirst thing we need to see move up and break the ressistance of 8.70 $ and we see the first higher high if that happened then apt is goin bollish, first target will be 10.17$
this is my analyse it's not a recomandation to buy or sell !!


In mid big candle(APT)📊Analysis by AhmadArz:
🔍Entry: 8.186
🛑Stop Loss: 8.080
🎯Take Profit: 8.311 -8.418 -8.610 -8.742
🔗"Uncover new opportunities in the world of cryptocurrencies with AhmadArz.
💡Join us on TradingView and expand your investment knowledge with our five years of experience in financial markets."
🚀Please boost and💬 comment to share your thoughts with us!

APT NEW VOLUME INCREASEThank you for reading this update.
Depending on our study we see that APT has a good chance of volume increase.
This updates depending on day trade, And the market should confirm with time the right market way.
We did follow before more coins, and these coin seems to have an increase of break in the coming time.
#Nottradingadvice
#For Day traders take always profits when the market increase
#Expect nothing from the markets, but follow what it shows.
Small traget (APT)📊Analysis by AhmadArz:
Short TP
🔍Entry: 8.915
🛑Stop Loss: 8.83
🎯Take Profit: 9.006
🔗"Uncover new opportunities in the world of cryptocurrencies with AhmadArz.
💡Join us on TradingView and expand your investment knowledge with our five years of experience in financial markets."
🚀Please boost and💬 comment to share your thoughts with us!

APTUSD - Recovery Pattern (INVERTED H&S)A slightly slanted inverted H&S but still valid due to the head being low than both shoulders
I expect a strong right shoulder move up to the solid green line, quite a big move.
I have labelled the points of the head and shoulder structure.
The whole market looks VERY bullish to me right now.

Wait for my confirmations(APT)❤️❤️Thanks for boosting 🚀 and supporting us!
📈My endorsements for selling resistance:
Hoping to reach the roof of the channel
Completing the second movement width from the floor
Last bullish push to sell
📌A small buy position is only to reach resistance.
📊 (sell) : 9.699
🔴 Stop Loss : 10.602
🎯 Take Profit : 8.511-7.373-6.431-5.037
🔗 For more communication with us, In the footnote and send a message in TradingView.
👨🎓 Experience and Education: Our trading team has five years of experience in financial markets, especially cryptocurrencies.

APT ANALYSIS (4H)It seeFrom where I entered START, an ascending pattern has started . ms that we are inside a large diametrical
For wave E, the green range is the range on which you can take risks and enter the buy/long position.
We enter the position only if it reaches the green range Stabilization of a daily candle below the range is our stop
For risk management, please don't forget stop loss and capital management
When we reach the first target, save some profit and then change the stop to entry
Comment if you have any questions
Thank You

APT: DECEMBER 16. 2023A pivotal level has been reclaimed and price has officially exited accumulation phase. IMO, this coin is primed to go parabolic at some point. I have bought a bag. I expect full thrust above 9.5.

Linear Regression Second Derivative and Breakout Signal ScriptsUsing Linear Regression of Second Derivative script, we can see that the momentum is down, but that down momentum is actually decreasing, as the downward histogram is making a higher low compared to prior histogram. Also, Breakout Signals script is showing yellow squares at the bottom. This means that the EMAs are stacked correctly, there is a compression(it’s getting ready for a move), the velocity is increasing(price is accelerating) and the DI+ is increasing and DI- is decreasing. All these factors, when combined, give us a high probability that the coin will go up(although nothing is guaranteed in trading which is why we are using stops to protect ourselves from losses)
Our Target is the top of that Keltner Channel which has a length of 21, multiplier of 2.86 and ATR length of 14.

APTUSDT----->15$ But First 6$ !Hello to all!
I think everything is clear enough in the chart and there is no need for additional explanation.
Of course, the daily candle hasn't been closed yet , and it may be closed in any way. However, this shooting star candle was just one of our confirmations for this BINANCE:APTUSDT analysis.
And next to the specified resistance levels and Fibonacci points and the points mentioned in the BINANCE:TRBUSDT chart analysis, I think this movement is probable.
So, the first target is 6 dollars , then the targets are 12, 15 and 20 dollars .

Reverse in 4 level*-Technical Analysis 📈
4 movement mesuremoving at level break
*Trade (Buy/) 📊
7.03$
*-Stop Loss 🔴
6.64$
*-Take Profit 🎯
7.79 - 8.54 $
*-Risk Management 🚧
3%
👨🎓 Experience and Education: Our trading team has five years of experience in financial markets, especially cryptocurrencie

Will APTOS repeat the scenario of TON?Hello everyone! The situation with APTOS is very similar to the situation I recently published about the TON cryptocurrency.
The asset is currently at a local bottom, which serves as a good support zone.
If Bitcoin doesn't drop below its current levels (which is expected), then after breaking out of the local accumulation zone, there will definitely be growth.
The growth will also be supported by breaking through the descending trendline. Therefore, it is important for the asset to establish itself above it.
Targets are shown on the chart.
This is not a financial recommendation, everything you do is at your own risk.

Aptos APTUSDT Analysis (1d)Greetings, traders! 🌟
In the BINANCE:APTUSDT chart, we've observed a significant breakout from the resistance line. This breakout suggests a potential reversal from the existing bottom structure.
Key support levels to watch are at 1881, 1762, and 1710.
On the upside, key resistance levels that might act as hurdles are at 2211, 2480, 2968, and 3128.
For long-term holders, it's advisable to place your stop-loss levels just below the support zones to safeguard your positions in case of unexpected market fluctuations.
Stay tuned for more updates!
Happy trading!

APT long setupAptos is one of the big projects with huge potential to pump in the bullrun...
In this chart we see a deviation on the lows... Wait for retest of SSL... Then pump

My plan for APTUSDThere is my plan for BINANCE:APTUSDT
⛔"Daily crypto market analyses I provide are personal opinions & not financial advice. Trading carries risks, so do your own research & seek advisor's help.#DYOR"
Don't forget to like and comment

APTUSD ❕ downward movementTD Sequential formed a reversal signal down (30m TF)
50EMA broke down 200EMA at 30m TF.
The asset has fixed under the 200EMA (30m TF)
RSI is moving in the sellers' zone.
I expect a decline after fixing under the support level.

5.2121-5.3743: Support zone for conversion to an upward trendHello?
Hello traders!
If you "Follow" us, you can always get new information quickly.
Please also click “Boost”.
Have a good day.
-------------------------------------
(APTUSDT chart)
(1D chart)
From a short-term perspective, it can be said that an upward trend is currently underway to transition to an upward trend.
Accordingly, the key is whether the price can be maintained above 5.3743 until the MS-Signal indicator switches to a bullish sign.
If that happens, it is expected to lead to a move to rise above 6.3793.
If it falls below 5.2121, there is a possibility that it will fall to around 3.5162, so you need to think about a response plan.
(1h chart)
In order to continue the upward trend, we need to check if we can receive support and rise in the 5.4616-5.6366 range.
However, if resistance is seen below 5.4973, caution is required as it may lead to a further decline.
At this time, it is necessary to check whether support is received around 5.1637-5.2406.
-------------------------------------------------- -------------------------------------------
** All explanations are for reference only and do not guarantee profit or loss in investment.
** Trading volume is displayed as a candle body based on 10EMA.
How to display (in order from darkest to darkest)
More than 3 times the trading volume of 10EMA > 2.5 times > 2.0 times > 1.25 times > Trading volume below 10EMA
** Even if you know other people’s know-how, it takes a considerable amount of time to make it your own.
** This chart was created using my know-how.
---------------------------------

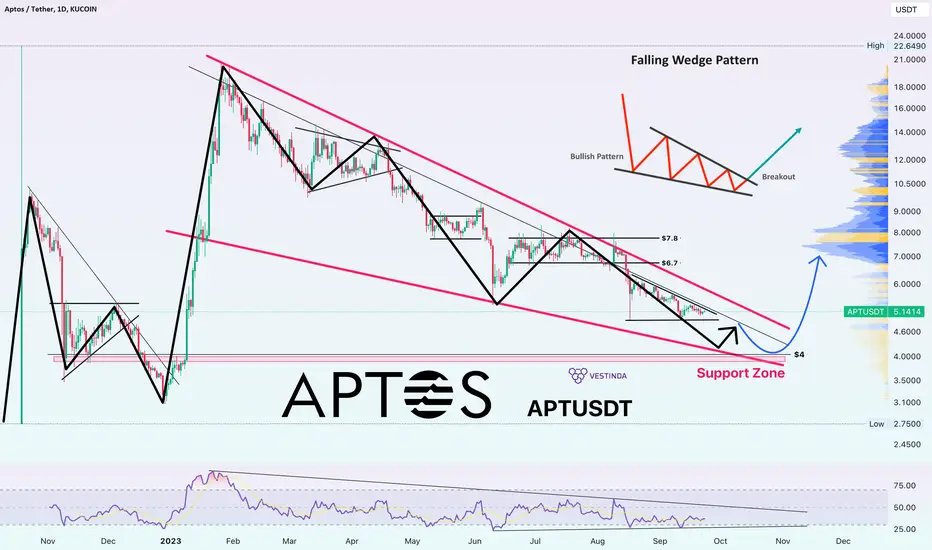
Aptos APTUSDT Price Analysis (1d)APTUSDT Price Analysis:
Aptos Token BINANCE:APTUSDT is currently displaying a descending movement within a Wedge pattern, a renowned bullish reversal formation. The present outlook suggests an impending price rebound, primarily from the Support zone positioned around the $4.0 level. Subsequently, we anticipate multiple price rebounds, ultimately culminating in a breakthrough of the Wedge's resistance.
The question arises: Can we attain our targets at $6.7 - 7.8? The answer lies in time's revelation.
Stay tuned for further updates as the market unfolds its story. 📈🕒