APT/USDT The Next Upward Incoming ?? 💎🚀 Aptos Analysis Today💎 Paradisers, brace yourselves for the trending coin!
💎Aptos has forged a partnership with Microsoft
💎 APT to surge and Break the falling wedge pattern, backed by impressive volume.
💎For the entry, We can entry now or wait for a retest on the support. Should APT showcase bullish indicators, such as a favorable candlestick pattern, we can anticipate a rebound and a continued ascent toward our target.
💎However, if APT struggles to maintain its stance at the support and breaches it, we might witness the price gravitating towards the bullish OB + Demand zone, potentially igniting a robust upward thrust.
💎Stay vigilant, as our bullish perspective would be challenged if APT descends past the 6.4 mark and settles below it. Trade wisely, ParadiseSquad! 🌴
APTUSDT

Aptos bullish rally startedHello Traders,
This is a monthly chart.
APT (Korean giant) has woken up after a six-month correction.
The Microsoft News is the trigger.
People will short every green candle :D Look what happened last time :))
Please hit the boost button and follow me for more ideas.
Thanks

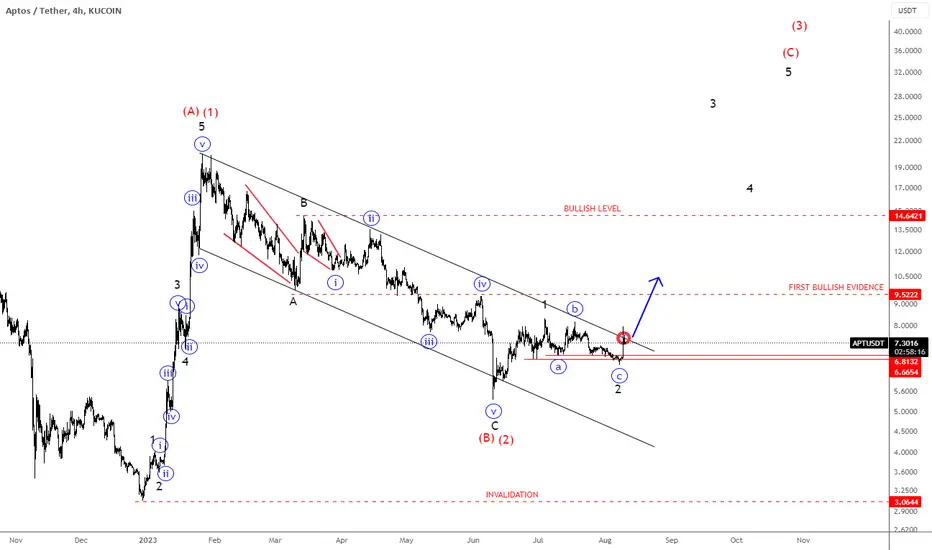
APTOS Bulls Ready?!Aptos Token Surges on Microsoft Partnership Ahead of APT Supply Unlock
Aptos with ticker APTUSD is waking up after a completed higher degree A-B-C correction in (B)/(2). Currently we can see it forming a lower degree bullish setup formation with impulsive wave 1, followed by a-b-c pullback in wave 2 that can push the price into the steepest wave 3 of a five-wave bullish cycle within higher degree wave (C)/(3). Just keep in mind that we still need broken channel resistance line decisively and 9.5 first bullish evidence level to confirm wave 3 of a five-wave bullish impulse.
Bullish confirmation is above 14 level, while invalidation level remains at 3.
APT. Speculation.I don't see how Aptos can get such a capitalization, but it's probably possible. It looks like VC's are pushing their projects forward. Well... Let's see . At the moment, everything looks optimistic for Aptos.

SasanSeifi 💁♂️APT 👉1D
Hey everyone! 🎉 So, there's some exciting news: Microsoft and Aptos Labs are teaming up on new AI Blockchain Solutions! 🔥 Take a look at the daily chart! 😊 As you can see, the price has jumped from the support level of 6.47 with a nice buying demand and has grown by nearly 23%. It looks like the downward trend line is broken, and if the price pulls back or stabilizes, we might see a mid-term increase beyond $6.50. We might even reach resistance levels of 8.50, 9, and even 10$. For now, the support level on the daily chart is pretty crucial. Let's see what happens! 🚀📈
The potential trends are also illustrated in the above image. Let's see where it takes us! 🧐📊"
Just keep these scenarios in mind as you analyze the market. Remember, things can always change unexpectedly, so stay flexible in your trading approach.❗
Wishing you loads of success in your trading adventures, my friend!✌
❎ (DYOR)...⚠️⚜️
Sure, if you have any more questions or need further clarification, feel free to ask. I'm here to help!
And if you found my analysis helpful, I would appreciate it if you could show your support by liking and commenting. Thank you!🙌

What price you bought APTDaily chart
Aptos BINANCE:APTUSDT is in accumulating phase nearly 2 months and it's trading around $7.1
APT's the support around 6.4 and #ApexZone in the same that range
Chart 4H TF
APT's rejected the support at 6.81x with RSI Oversold. That's created Reversal Pattern Double Bottom
It's a resistance at 7.4 ahead
So we wait for a next move

APTUSDT Elliott Waves Analysis (Local Setup)Hello friends.
Please support my work by clicking the LIKE button👍(If you liked). Also i will appreciate for ur activity. Thank you!
Everything on the chart.
Entry: market and lower
Targets: 8.7 and ~9.6
after first target reached move ur stop to breakeven
Stop: ~6.2 (depending of ur risk). ALWAYS follow ur RM .
RR: 1 to 2
risk is justified
Good luck everyone!
Follow me on TRADINGView, if you don't want to miss my next analysis or signals.
It's not financial advice.
Dont Forget, always make your own research before to trade my ideas!
Open to any questions and suggestions

#APTUSDT: Bulls Eyeing a Potential 100% Surge. 💎 On June 10, it appears that #APTUSDT may have indeed discovered a confirmed bottom when the price reached the $5.28 low. Since that time, the price has been gradually ascending, culminating in a daily break and close above the long-term downtrend trendline. This encouraging development was followed by a slight pullback, during which we observed a clean bounce off the 50% Fibonacci support at $6.62.
💎 As long as this crucial support remains intact, there is a high likelihood that #APT will experience a substantial upswing, potentially reaching an impressive 100% surge. However, it is essential to exercise caution as #APTUSDT is currently confined within a narrow trading range, delineated by the wine-colored lines on the chart.
💎 For a perfect bullish setup, we anticipate a definitive break above this range, accompanied by a re-test of the upper boundary, which should then serve as a reliable support level. Until such a break occurs, engaging in either buying or selling #APT is fraught with risk.
💎 Should the price breach the 50% Fibonacci support, representing the range's bottom, sellers may regain control once more. In the meantime Paradisers, it is paramount to exercise patience and discipline, particularly as the crypto market currently experiences a notable lack of trading volume.

APTUSDT - Bullish breakout setup"Adding to the bullish sentiment, APTUSDT is on the verge of a trendline breakout, further enhancing the potential for a significant upward move.
Traders closely monitoring this setup anticipate a surge in buying pressure as the price breaches the key resistance level. With a well-defined risk-to-reward ratio of 1:5, savvy investors are positioning themselves to capitalize on the anticipated breakout, aiming for substantial gains.
As the market eagerly awaits the breakout confirmation, APTUSDT presents an enticing opportunity for traders seeking to ride the bullish wave and maximize their returns."

APTUSD Next Possible MovePair : APTUSD ( Aptos / U.S Dollar )
Description :
Impulse Correction
Completed " 1234 " Impulsive Wave
Break of Structure
Bullish Channel in STF as an Corrective Pattern
S / R Level

BULLS ONE MORE THINGone more test before the bull will take over finally
buy zone as shown
sl - 6.568,
tp all the way to 10.85
i will let you know when the trade starts

APTOS Outlook continued... APT has now reached the first key area of interest, it's still maintaining its structure in a descending wedge pattern respecting the trendlines.
BTC will ultimately decide the near term fate of APTOS as it's important bitcoin stabilises or even bounces before altcoins have any hope of doing so. With BTC having lost the 1D 200EMA support I'm thinking price will drop closer to the bullish OB 2 or even 3 before getting bullish.

Sol Again Preparing For A good rally Also sol is Breaking out of Descending Channel on the 3-days TF Chart.
Solana is now higher than it was vs ETH when the SEC called it a security

Waiting for breakout Apt looks so promising as
🔸It make a descending channel in daily chart.
🔸need to breakout the 0.618 fib level to have fuel to break the channel
🔸Incase that happen my target would be 20$
Dont forget to support us with ur like and comment for more ideas 🎯

Apt is still bullish | short term Aptusdt
Chart is looking still bullish on 4h timeframe
Double breakout on hourly timeframe
Price is trying to break symmetrical triangle pattern on 4h timeframe Incase of successful breakout I am expecting 20-40% short term bullish move
Ideas are personal opinion not financial advice , do your own research and always manage your risk properly
kindly make sure to follow us for more quick updates If you think we are working honestly
Good luck

$APT - Looking like a push to the golden pocket. I'm looking at APT which retraced almost 90% from its All-Time High in January.
Zooming into the the 4h, you can see that there are almost 5 waves in, which implies a deep retrace to .5-.618 fibs (probably). At that point I'll be pinpointing my entry to DCA in those zones.

APTUSDT ready for Bull Run Apt is currently testing a downward trendline. This is the umpteenth attempt to break this trendline, which began approximately 150 days ago.
In the previous post, I mentioned that this cryptocurrency has a good support level, and many traders were waiting to buy at this area.
As we can see, there was strong support from this level. However, the black line on the chart indicates the closing point of the previous monthly candle, which can act as both resistance and, if broken upwards, a strong support.
Considering that most leading cryptocurrencies pump one after another, it is not unlikely for this coin to break the monthly resistance and turn it into a good support level.
Overall, my prediction is that even in the short term, this could be a turning point for the market and transform into a bullish market.
Please only enter a position if the trend break is confirmed.
⚠️ "Daily crypto market analyses I provide are personal opinions & not financial advice. Trading carries risks, so do your own research & seek advisor's help."
Don't forget to like and comment

APT ANALYSIS (12H)Hi, dear traders. how are you ? Today we have a viewpoint to BUY/SELL the APT symbol.
For risk management, please don't forget stop loss and capital management
When we reach the first target, save some profit and then change the stop to entry
Comment if you have any questions
Thank You

APTUSDT APTUSDT has broke through symmetrical triangle and seems like in strong bullish mood. Will the pair continue with this pattern?

Apt Looks Ready Bullish Impulse Breaking Descending Channel In H12 Tf In case Of Successful Breakout Expecting 110 - 120% Bullish Wave Also Breaking Horizontal Resistance

APTOS APT SHORT Can go to 4,70,and lower,if.... Alchemy Pay price prediction sentiment is bearish , with 1 technical analysis indicator signaling bullish signals, and 26 signaling bearish signals.
If you wanna trade my strategy then follow the trading rules:
Once you get short stay until the trend changes of I will publish the opposite signal.The aim of this strategy is only and only trend following and trend trading.Too many buy selling on lower tf will cause many losse. So avoid day trading and instead stay and trend with the trend.
According to current Aptos price prediction, the value of Aptos is predicted to drop by -7.50% and reach $ 6.69 by July 7, 2023. According to technical indicators, the current sentiment is Bearish while the Fear & Greed Index is showing 63 (Greed). Aptos recorded 18/30 (60%) green days with 11.69% price volatility over the last 30 days. Based on our Aptos forecast, it's now a bad time to buy Aptos.
In the best case scenario, APT price prediction for year 2026 is $ 0.145448 if it follows Facebook growth. In case Aptos would follow Internet growth the prediction for 2026 would be $ 0.016685.
Based on data from July 02, 2023 at 18:06, the general Aptos price prediction sentiment is bearish , with 5 technical analysis indicators signaling bullish signals, and 18 signaling bearish signals.
Aptos has been trading for less than 200 days, which means that it’s currently not possible to calculate its 200-day simple moving average (SMA).
The price of Aptos is currently above the 50-day SMA and this indicator has been signaling BUY for the last 74 days, since Apr 19, 2023.
Based on our technical indicators, Aptos's 200-day SMA will rise in the next month and will hit $ 0.00 by Aug 01, 2023. Aptos's short-term 50-Day SMA is estimated to hit $ 6.34 by Aug 01, 2023.
The Relative Strength Index (RSI) momentum oscillator is a popular indicator that signals whether a cryptocurrency is oversold (below 30) or overbought (above 70). Currently, the RSI value is at 51.64, which indicates that the APT market is in a neutral position.
Daily Simple Moving Average (SMA)
Period Value Action
SMA 3 $ 7.25 SELL
SMA 5 $ 7.23 BUY
SMA 10 $ 7.33 SELL
SMA 21 $ 6.95 BUY
SMA 50 $ 7.72 SELL
SMA 100 $ 9.26 SELL
SMA 200 $ 9.84 SELL
Aptos Price Forecast For Tomorrow and Next Week Based on The Last 30 Days
Date Price Change
Jul 3, 2023 $ 7.27 0.57%
Jul 4, 2023 $ 7.33 1.40%
Jul 5, 2023 $ 7.20 -0.37%
Jul 6, 2023 $ 6.60 -8.71%
Jul 7, 2023 $ 6.69 -7.50%
Jul 8, 2023 $ 6.21 -14.08%
Jul 9, 2023 $ 6.25 -13.58%
Jul 10, 2023 $ 4.95 -31.55%
Jul 11, 2023 $ 4.85 -32.98%
Jul 12, 2023 $ 5.02 -30.54%
Jul 13, 2023 $ 5.15 -28.73%
Jul 14, 2023 $ 5.07 -29.84%
Jul 15, 2023 $ 4.92 -32.01%
Jul 16, 2023 $ 4.96 -31.44%
Jul 17, 2023 $ 5.23 -27.64%
Jul 18, 2023 $ 5.54 -23.35%
Jul 19, 2023 $ 5.35 -25.98%
Jul 20, 2023 $ 5.38 -25.57%
Jul 21, 2023 $ 5.71 -21.10%
Jul 22, 2023 $ 5.96 -17.52%
Jul 23, 2023 $ 5.82 -19.47%
Jul 24, 2023 $ 5.98 -17.31%
Jul 25, 2023 $ 6.02 -16.80%
Jul 26, 2023 $ 5.70 -21.21%
Jul 27, 2023 $ 5.71 -21.00%
Jul 28, 2023 $ 5.61 -22.46%
Jul 29, 2023 $ 5.45 -24.68%
Jul 30, 2023 $ 5.66 -21.71%
Jul 31, 2023 $ 5.55 -23.22%
Aug 1, 2023 $ 5.69 -21.35%


APTUSDT.P Trading IdeaHi everyone,
Currently I see possible scenario like this:
- leave current range
- correction to STB area at the bottom side
- then price reverse
The STB worked with internal liquidity, and it should be strong enough to prevent price going down.
Above we have an IMB 4H, which was tested, but the IMB FF, might be our first FTA.
