APT IS BULLISHHi, dear traders. how are you ? Today we have a viewpoint to BUY/LONG the APT symbol.
For risk management, please don't forget stop loss and capital management
When we reach the first target, save some profit and then change the stop to entry
Comment if you have any questions
Thank You
APTUSDT

APTUSDT H4HI Guys, Hope you well
Charts shows you everything's
SecondChanceCrypto
⏰16/April/23
⛔️(DYOR)

ARBUSDT H2Hi , Guys
So Hype , Good project and fundamental, and at the end nice volume
SecondChanceCrypto
⏰16/April/23
⛔️(DYOR)

nearusdt H4Hi Guys , hope you well
Chart show you everything's
SecondChanceCrypto
⏰16/April/23
⛔️(DYOR)

DYDXUSDT H4Hi Guys, Hope you well,
One of the best currencies in the crypto market with a very good exchange project. It will definitely see much higher price in the future.
SecondChanceCrypto
⏰16/April/23
⛔️(DYOR)

aptFor spot buying in two areas, with the specified loss limit. If you made the purchase in the first area, and you wanted to average, the second area and the second loss limit will be activated.

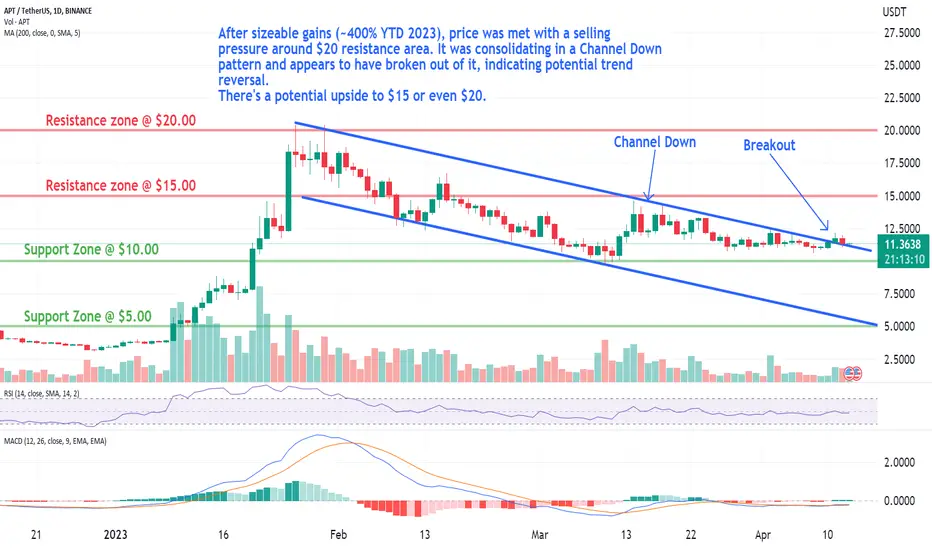
APT: Channel Down BreakoutTrade setup : After sizeable gains (~400% YTD 2023), price was met with selling pressure around HKEX:20 resistance area. It was consolidating in a Channel Down pattern and appears to have broken out of it, indicating potential trend reversal. There’s potential upside potential to $15 or even $20.
Pattern : Price was trading in a Channel Down pattern. With complete patterns (i.e. a breakout) – initiate a trade when the price breaks through the channel’s trendlines, either on the upper or lower side. When this happens, the price can move rapidly in the direction of that breakout.
Trend : Downtrend on Medium-Term basis and Uptrend on Short- and Long-Term basis.
Momentum is Bullish (MACD Line is above MACD Signal Line and RSI is above 55).
Support and Resistance : Nearest Support Zone is $10.0, then $5.0. The nearest Resistance Zone is $15.0, then $20.0.

Target would be 20$🔸We can see apt breakout the descending channel in 12h chart.
🔸Now testing the 0.382 fib level which would be broken soon
🔸My target is 20$
Dont forget to support us with ur like, comment and follow for more ideas like this🎯

APT USDT | Triangle Breakout !!#APT /USDT
- The price Finally break the triangle up with a good bullish potential
🟢Entry price: from now at 12.6 to 11.95
🎯Targets:
|> 13.79
|> 15
|> 16.28
🔴Stop-loss: Daily candle closes under 11.7
➡️Recommended risk: 0.25%
➡️Recommended total Positions Size: 2.5%
-------------------------------------------
if you missed! here are some of our recent Altcoin trades that are available to enter :
#ACAUSDT | ready for a bullish impulse
#COCOS/USDT | full details trade!
#MANA | The breakout of a bullish flag !

Whether it can rise above the volume profile is keyHello?
Traders, welcome.
If you "Follow", you can always get new information quickly.
Please also click "Boost".
Have a good day.
** Analysis of the BTC chart publishes new ideas once a week.
** However, we publish new ideas when volatility occurs or when we show signs of diverging from our expectations.
** Excluding the above situation, BTC analysis is listed as a daily update.
-------------------------------------
(APTUSDT chart)
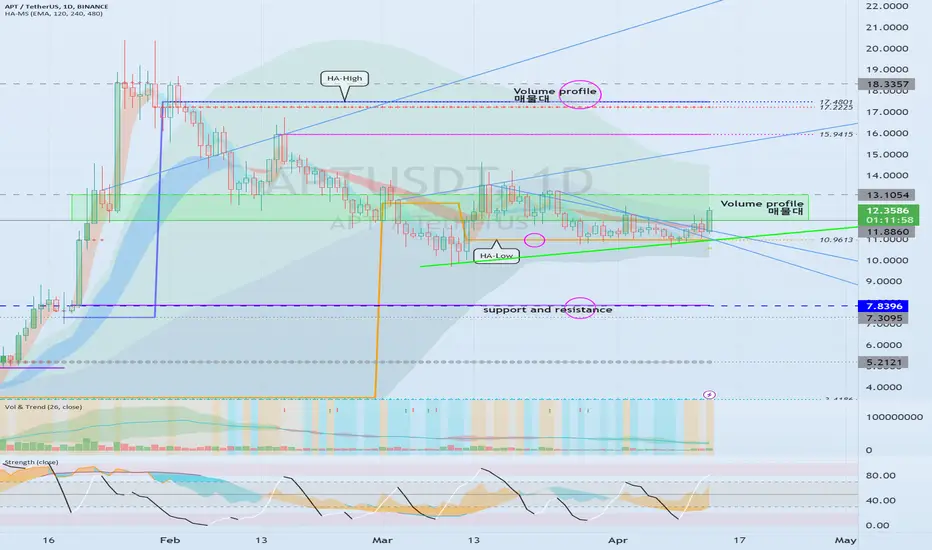
The key is whether it can rise above the volume profile section formed in the 11.8860-13.1054 section.
If it declines, you should check for support around 7.8396.
Since it was supported and rose near the HA-Low indicator of the 1D chart, if it rises above the selling range of 11.8860-13.1054, it is expected to rise to the vicinity of the HA-High indicator of the 1D chart.
However, it may be created by moving the HA-High indicator as it rises.
-------------------------------------------------- -------------------------------------------
** All descriptions are for reference only and do not guarantee profit or loss in investment.
** Even if you know other people's know-how, it takes a considerable period of time to make it your own.
** This is a chart created with my know-how.
---------------------------------
APT: Channel Down BreakoutTrade setup : After sizeable gains (~400% YTD 2023), price was met with selling pressure around HKEX:20 resistance area. It was consolidating in a Channel Down pattern and appears to have broken out of it, indicating potential trend reversal. There’s potential upside potential to $15 or even $20.
Pattern : Price was trading in a Channel Down pattern. With complete patterns (i.e. a breakout) – initiate a trade when the price breaks through the channel’s trendlines, either on the upper or lower side. When this happens, the price can move rapidly in the direction of that breakout.
Trend : Downtrend on Short- and Medium-Term basis and Neutral on Long-Term basis.
Momentum is Mixed as MACD Line is above MACD Signal Line (Bullish) but RSI ~ 50 (Neutral).
Support and Resistance : Nearest Support Zone is $10.0, then $5.0. The nearest Resistance Zone is $15.0, then $20.0.
APT 🚀 IS BULLISH LONG🚀APT/TETHERUS BINANCE
Hi, dear traders. how are you? Today we have a viewpoint to BUY/LONG
This is the time to buy, the downward line was broken with a positive sign, and the 4-hour candlesticks are above mouving avrige 209, which indicates the positivity of the trend. The three goals in the chart

APTUSDT likely to hit 4h support and bounce from thereThe price is currently trading above 4h support 4HS1 as marked on the chart. It is likely that the price will hit this support and bounce from there. A long will be favorable from there for a target towards 11.89. If this support is lost, the price shall hit next 4h support 4HS2 and another long can be attempted from there with a target towards 11.63 area.

APT/USDT🔵🐇 #APT/USDT
🪄 IDK Price Will Reach To The Untouched liquidity magnet zone or not but there are two strong Fresh LQ around 8 -7 & 5.5
and I will think about a solid and strong midterm buy there !
NFA - DYOR
#apt #aptos #eth #btc #bitcoin #ethereum #cryptocurrency #crypto #Trade #trading #Trader #Signal #forex #Scalp #altcoins #chart #RTM #ICT
@aliceinmoneyland

APT/USDT🔵🐇 #APT/USDT
🪄 APTOS Scalp Position Based On Fresh Liquidity and Order Blocks and Structures
#apt #aptos #eth #btc #bitcoin #ethereum #cryptocurrency #crypto #Trade #trading #Trader #Signal #forex #Scalp #altcoins #chart #RTM #ICT
@aliceinmoneyland

APTOS potential long swing aptos went down and taken the liquidity from below and now if the bullish sentiment remains in the market it'll go high to grab the liquidity and then move further...

APTUSDT at daily support but better to wait before going longThe price has hit the daily support as expected in our previous post. This also explains the initial bounce. However it seems price may dip below the support although briefly if not for a long duration. Therefore, I think a bit of patience will be desired before taking a long from this support. If the price reaches 10.14, a long would be more favorable.


APT BULLISHChart looks very good and fundamental is very good too! 3:1 ratio is very good ! Check my other analysis and give me like if you agree!

Apt | Looks Promising hereAptusdt
Looks promising here expecting breakout
Note: expecting means nothing in crypto so please wait fir confirmation incase of succesful breakout 20-30% bullish move probably
Remember: These are just ideas that we share from our experience, it does not mean that they will be 100% perfect, anything can happen in the market at any time.
Always manage your risk and trade with your own research

APT formed Bull Flag Pattern APT formed Bull Flag Pattern
Wait for proper breakout and retest before LONG

APTBTC 12H TIMEFRAME POTTENTIAL BIG REVERSAL 140-180% !!Confluence zone 0.61 - 0.7 fib level.
Also support resistance trendline in that area.
Moving Averages also 7/21 acting as support/resist.
Bull market would be when
ma7 above ma200 + Macd Bull above bear
Buy zone should be good : 3880sats - 4283sats
Breakout level - 4440sats.
Confirmation for breakout - above 5000sats for 3-4candle close
12h timeframe or around 2 to stay above 5000sats.

$APT: PULLBACK 🌊Everyone was in rush to invest in APTOS blockchain but big exchanges like Binance conquired big % of APT supply and it kinda controls price movement, dump $APT until retail traders get vanished then send it higher. This is exactly what happened in first days of $APT trading.
Now, after this breakout and print of a new HH, price is retracing to previous support and has already rejected it multiple times before going up nearly +30%.
Setting buy-limits at this support box. For SL, 5-10% below support should be fine as our TP is targeting a minimum of 50% gain.
Make sure you follow me to get alerts on this trade!
