APT/USDT has inverse head shoulders | Long BiasOn day timeframe
At 7.6, the neckline had broken and wait price to retest
BINANCE:APTUSDT being supported by Ascending Trend Line
Now, wait it pullback to confirm
Wait and see
APTUSDT

Aptos (APT) Among all those red candles and McDonald's chart patterns still altcoins and new projects in crypto rise and pumping each and every single day
Aptos price today is $9 with a 24-hour trading volume of half a billion. APT price is up 23.0% in the last 24 hours. It has a circulating supply of 130 Million APT coins and a total supply of 1 billion
but let see what is this project at all, Aptos is a new, independent high performance PoS Layer one project focused on delivering the safest and most scalable Layer 1 blockchain in the world. The Aptos blockchain leverages the Move programming language and the Move VM for application development, which are created and optimized for blockchain use cases.The team is comprised of the original creators, researchers, designers, and builders of Diem, the blockchain that was first built to serve this purpose. Aptos raised $200 million from a16z, Multicoin, Binance and others. Aptos launched Devnet in mid March, incentivized testnet in late May and targets Q3 for mainnet launch. you can check their whitepaper for more details too.
one thing you should remember in bear market is, always take a profit
tg 9.1 , 9.5 , 9.9

Aptos APT price is preparing to pleasantly surprises👇This is our previous idea for #APT
And today, an update, as it seems that the OKX:APTUSDT price is trying to gain a fix above the trend line
If buyers manage to keep the #APTUSD price above $7.40-7.50 in the coming days, then hello #APTOS per $10, and if you're lucky, at $13-13.50 by the New Year)
_____________________
Did you like our analysis? Leave a comment, like, and follow to get more

APT buy/long setup (1D)It seems that a correction wave has ended.
A tigger line is also broken.
Now we have a POI range on the chart which is our rebuy range
The targets are clear on the chart.
Closing a daily candle below the invalidation level will violate the analysis.
For risk management, please don't forget stop loss and capital management
When we reach the first target, save some profit and then change the stop to entry
Comment if you have any questions
Thank You

#APT/USDT Ready to go up#APT
The price is moving in a descending channel on the 1-hour frame and sticking to it well
We have a bounce from the lower limit of the descending channel, this support is at 0.07342
We have a downtrend, the RSI indicator is about to break, which supports the rise
We have a trend to stabilize above the 100 moving average
Entry price 11.77
First target 12.52
Second target 13.20
Third target 14.02

BULLISH ON APTOS Hi there, AMEX:APT looking strong bullish uptrends and will continue higher.
Price shows a strong rejection on $12 support and its still won’t able to close below it.
This indicates us that the price will continuing up. BINANCE:APTUSDT

APT Long Spot Trade (Retest of Breakout)Market Context: APT has shown strong momentum with an impressive breakout beyond its accumulation range. We are now looking for a retest of the former resistance zone ($9 - $10), expecting this level to hold as new support for the next leg up.
Trade Setup:
Entry: Ladder into a long spot trade between $9 - $10
Take Profit:
First target: $16.5
Second target: $19
Third target: $26
Stop Loss: Daily close below $8
This setup aims to capture further upside as APT establishes support at the retested level. #APT

#APT/USDT#APT
The price is moving in a descending channel on the 4-hour frame upwards and is expected to continue.
We have a trend to stabilize above the moving average 100 again.
We have a descending trend on the RSI indicator that supports the rise by breaking it upwards.
We have a support area at the lower limit of the channel at a price of 8.50.
Entry price 9.10.
First target 9.70.
Second target 10.40.
Third target 11.06.

Aptos APT is ready to take off!Hello, Skyrexians!
Yesterday we considered ADA analysis and today the price of this asset started moving up and surged +14% in less than one day. Hope you were able to make a right decision. Today we will take a look at BINANCE:APTUSDT - another one interesting cryptocurrency with the great potential in the bull market.
On the chart you can see the weekly time frame for Aptos. Technically it is printing the global 2 year sideways. As you know, the sideways movement can be the accumulation or distribution. We suppose that it's accumulation before the mark up phase. Elliott waves analysis gives us the clear answer. We consider the early growth as the impulsive wave 1, after that APT is in flat correction, the wave 2, which consists of zigzag ABC. Look how perfectly wave C collected liquidity below the wave's A bottom and started going up.
Let's also notice the green dot which has been flashed by Bullish/Bearish Bars Indicator . It's is showing us the potential reversal points. Take a look how great it worker previous 2 times, indicated wave's A bottom and wave's B top. Now there is a high probability that it was the global bottom before the expansion to the upside.
The while line of the indicator showing the local support, if price is able to maintain above it, usually it leads to impulse. If our analysis is correct the wave 3 is incoming. We can calculate the targets using Fibonacci extension levels. The minimal one is $42, max target is $64.
Best regards,
Skyrexio Team
___________________________________________________________
Please, boost this article and subscribe our page if you like analysis!

APTUSDT Trade setupreaching to correction point. As we see the momentum we execute the plan in both ways cheers!

I Can’t Stress Enough: Buy APT Now!APT is one of the most promising assets in the current market, and missing this opportunity could cost you in the long run. Here’s why you need to act fast:
1-Strong Fundamentals: APT is backed by a solid project with innovative technology and a growing ecosystem.
2-Bullish Trend: The chart shows a steady uptrend with higher highs, signaling strong buying momentum. 📈
3-Market Sentiment: Institutional investors are starting to show interest this is a sign of big moves coming. 🚀
4-Potential Breakout Zone: It’s near a key resistance level, and once it breaks through, we could see a major price surge.
5-Favorable News Cycle: Positive updates about APT’s development and partnerships are expected soon.
Don’t wait until it’s too late buy APT now and position yourself to profit from the next rally. Timing is everything in this market!

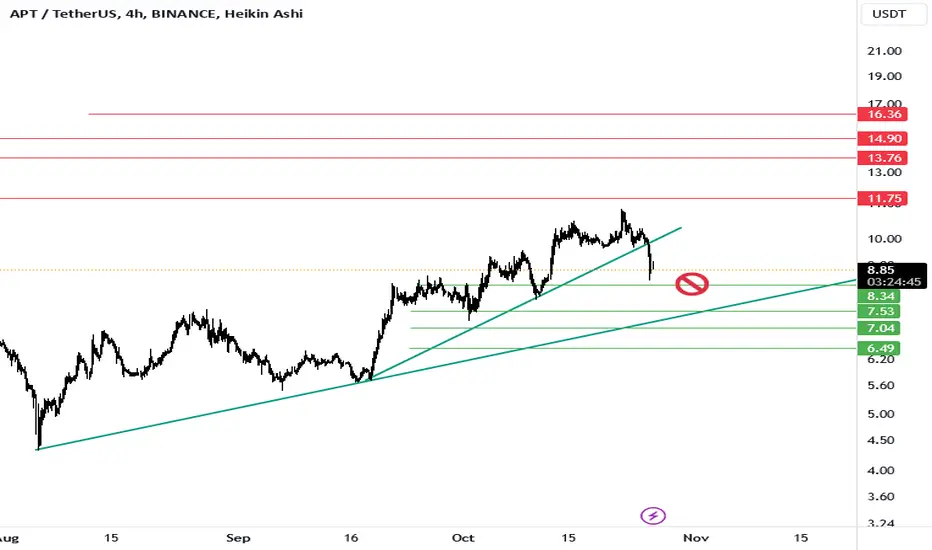
APT Short📈 Current Price and Trend:
The chart shows that APTUSDT is trading around $9.12.
A bullish trend started from a strong support level, as marked with the annotation "Start Latest bull-trend". The price has moved upwards within a channel, breaking through previous resistance levels.
🔄 Pullback to Breakeven:
A pullback to the breakeven zone (highlighted in red) around $9.57 - $9.97 is seen, which may act as a key resistance area if the price attempts to rise again.
🎯 Take Profit Targets (TP):
TP-1: $9.18 📌 – This level might be a short-term resistance where partial profit can be considered.
TP-2: $8.83 📉 – Another potential target within a downward trend.
TP-3: $8.30 📉 – This level aligns with the next support, where a significant pullback could happen.
📊 Key Support and Resistance:
Resistance: Near $10.73, marked by the upper trendline, and also around $9.57 - $9.97 (breakeven pullback zone).
Support: The next strong support level is around $7.49, where a trend reversal could occur if the price drops.
⚠️ Recommendation:
Long Position: Consider entry if the price holds above the breakeven zone with targets at TP-1, TP-2, and TP-3.
Short Position: If the price fails to hold above the breakeven zone, aiming for lower targets around $8.83 and $8.30 could be prudent.
This analysis combines key price levels, potential take-profits, and possible resistance and support zones as per the channel and trendlines shown.

aptI am not very optimistic about the first line, although there is a good support, but the lower order can be more reliable
Aptos | APT vs SUIThe price of Aptos is $10.7 today with a 24hour trading volume of 128 million dollar. This represents a 7% price increase in the last 24 hours and a 6% price increase in the past 7 days
With a circulating supply of 190 Million APT, and YES we back to 2 billion dollar Marketcap. now lets compare SUI and APTOS
Both Aptos and Sui blockchains are designed to address the scalability and efficiency issues faced by the current generation of blockchain networks. They both implement one of the most advanced programming languages – Move, utilize parallel execution for high throughput, and offer low latency. These similarities make them attractive options for businesses looking to build blockchain-based applications. The language used for parallel execution in both Aptos and Sui is Move, which is based on Rust and was initially designed at Meta. The language offers powerful tools and features to build smart contracts and decentralized applications. However, Sui has its own version of the language.
Aptos follows the standard design outlined in Diem’s whitepaper, while Sui has a slightly different object model. Sui’s storage system is object-centric, which means that most things on the blockchain, including addresses and transactions, are represented as objects.Sui’s version of Move clearly indicates when an object is owned, shared, mutable, or immutable, whereas Aptos does not. Additionally, Sui’s ownership API is cleaner than Aptos’s, as it provides a clearer representation of the blockchain design
Sui and Aptos differ significantly in their architecture, particularly in how they utilize distributed ledger technology. Sui’s ledger is stored as a directed a cyclic graph rather than a blockchain like Aptos. While both designs are efficient and share similarities with traditional blockchains, their differences are essential to their consensus mechanism and scalability.aptos has a modular architecture that enables easy upgrades and customizations, while Sui focuses on a multi-layered architecture to separate the consensus, storage, and computation layers. This allows for improved scalability and flexibility in the network.The ecosystems are very different and extensive in both projects. Every day there is something new to discover at both chains. It’s hard to pick out an outsider and a favorite. Aptos blockchain got its popularity before Sui, but at the moment, judging by the number of followers on Discord, Sui is overtaking Aptos.
After a surge in the popularity of Aptos several months ago, many various projects were created and launched exactly using that blockchain. During the year 2022, over 100 projects were developed using Aptos network.the most popular projects built over Aptos include Pontem (a universal wallet) and Pyth (a modern oracle). Aptos boasts a growing ecosystem of tools, libraries, and developer resources, while Sui’s ecosystem is relatively nascent but has the potential to grow rapidly as more developers join the network.as for Sui, the mainnet of the network will only be launched in Q2 2023 and the testnet was launched in the last days of March 2023. Thus, the majority of the project is now TBA. One of the most remarkable Sui projects so far is Sui wallet. Still, the Sui blockchain has great potential to overtake Aptos due to its scalability level.
Aptos and Sui are two blockchain ecosystems with different approaches to their tokenomics. Aptos has released an overview of their tokenomics for their native token APT, but additional information is expected to be published soon. APT is currently used for PoS participation and liquidity incentives, with an initial supply of 1 billion tokens. The majority of the initial supply is currently staked for PoS participation, with the remaining tokens allocated to different categories.
On the other hand, Mysten Labs has published an in-depth whitepaper on the native token of Sui, SUI. SUI will be staked within an epoch to participate in the proof-of-stake mechanism and on-chain voting. Additionally, SUI will be used as the asset denomination to pay for gas fees and other operations on the Sui platform, with a total supply of 10 billion tokens. The exact allocation percentages for the distribution of tokens have not been released, but the presence of the storage fund can create monetary dynamics and reduce the amount of SUI in circulation.
In conclusion, both Aptos and Sui have their unique selling points and hold great potential for businesses looking to adopt blockchain technology. However, Sui and Aptos are rapidly developing ecosystems, they’re still pretty ‘young’ compared to other big players in the industry. Thus, they are definitely expected to settle all security audit issues soon.

#APT\USDT#APT
The price is moving in a descending channel on the 1-hour frame upwards and is expected to continue.
We have a trend to stabilize above the moving average 100 again.
We have a downtrend on the RSI indicator that supports the rise by breaking it upwards.
We have a support area at the lower limit of the channel at a price of 9.70.
Entry price 9.80.
First target 10.19.
Second target 10.50.
Third target 10.88.

APTUSDT: Inverse Head and Shoulders Pattern FormationAPTUSDT technical analysis update
APT has formed an inverse head and shoulders pattern on the daily chart. The price has broken the neckline and is now retesting it as support. Additionally, the price is trading above the 100 and 200 EMAs on the daily chart. A strong bullish move is expected in the coming days.
Regards
Hexa

APTUSDT Surges Above 100 and 200 EMAAPTUSDT technical analysis update
APT's price has crossed above the 100 and 200 EMA on the daily chart. It has now retested the 200 EMA and is bouncing back, having also broken through a major resistance zone. We can expect a strong bullish move in the coming days.
Regards
Hexa

#APT/USDT#APT
The price is moving in a descending channel on the 1-hour frame
And it is sticking to it well
We have a bounce from the lower limit of the descending channel and we are now touching this support at a price of 8.30
We have a downtrend on the RSI indicator that is about to be broken, which supports the rise
We have a trend to stabilize above the moving average 100
Entry price 8.37
First target 8.68
Second target 9.00
Third target 9.45

APTUSDT (Aptos) Updated till 13-10-24APTUSDT (Aptos) Daily timeframe range. PA got into 9.73 level which got free space till 12.40. if 9.73 can be defended than it may have a push there. local support at 7.49.

APTUSDT - successfull retest the supp/res in 3d chart
iam extremly bullish
targets: 10 - 14 - 20 - 30
note: closin below grean area (7.3) is prohibited
best regards Cecilion🎯

APTUSDT Next target?? APTUSDT is currently testing a key resistance level. A breakout here could signal a significant upward movement, potentially doubling investment in the near future.
Always keep Stop loss!!
APTUSDT (1D Chart) Technical analysis
APTUSDT (1D Chart) Currently trading at $7.3
Buy level: Above $7.5
Stop loss: Below $6
TP1: $9
TP2: $11
TP3: $13
TP4: $15
Max Leverage 3x
Follow Our Tradingview Account for More Technical Analysis Updates, | Like, Share and Comment Your thoughts

My point of View For APTDear Follower
I got a multi request to analyze APT
I see APT most likely will hit $50 easily
I recommend liquidate 50% of your fund at that price then start use a trilling stop under each last new bottom for the rest of the fund
Good Luck

APT Bullish Breakout Here is my idea about APTUSDT Bullish breakout
Entry - 9.4-9.5
SL - 8.47 Around
Target - 10.6$, 11.3$, 12.6$
Use Low Levrage & Make sure to Have a Tight SL
