#ARB/USDT#ARB
The price is moving within a descending channel on the 1-hour frame, adhering well to it, and is on its way to breaking strongly upwards and retesting it.
We have support from the lower boundary of the descending channel, at 0.4550.
We have a downtrend on the RSI indicator that is about to be broken and retested, supporting the upside.
There is a major support area in green at 0.4520, which represents a strong basis for the upside.
Don't forget a simple thing: ease and capital.
When you reach the first target, save some money and then change your stop-loss order to an entry order.
For inquiries, please leave a comment.
We have a trend to hold above the 100 Moving Average.
Entry price: 0.4616
First target: 0.4751
Second target: 0.4923
Third target: 0.5135
Don't forget a simple thing: ease and capital.
When you reach the first target, save some money and then change your stop-loss order to an entry order.
For inquiries, please leave a comment.
Thank you.
Arbbtc

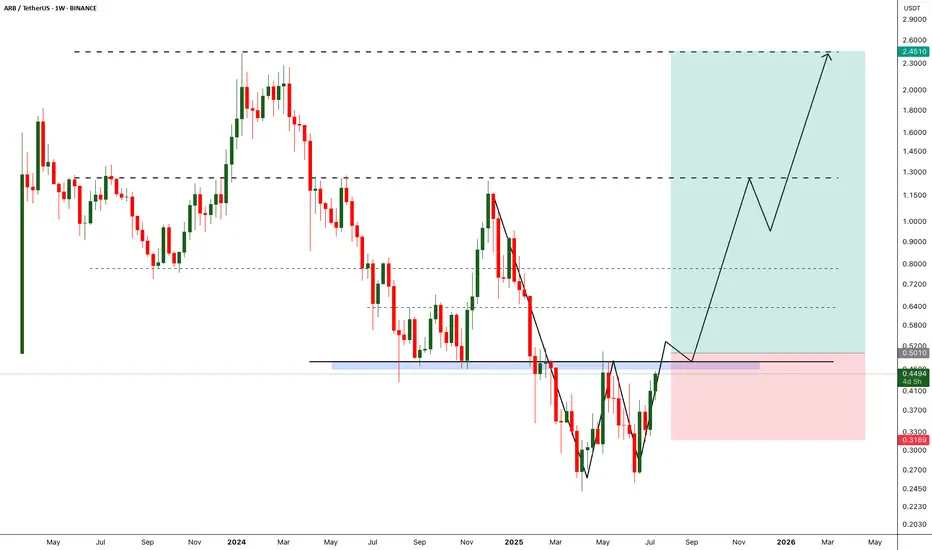
ARB - Breakout will break the market- Arbitrum is one of the fundamentally strong token on ETH L2.
- After back to back crashes finally we are seeing some reversal from the bottom
- A breakout from the local resistance would push the arb price further, we need to wait till the breakout to enter the trade.
Entry Price: 0.5010 (after breakout)
StopLoss: 0.3169
TP1: 0.6300
TP2: 0.7698
TP3: 1.2297
TP4: 1.7566
TP5: 2.3943
Max Leverage: 5x
Don't forget to keep stoploss
Cheers
GreenCrypto
#ARB/USDT Ready for a Major Breakout!#ARB
The price is moving within a descending channel on the 1-hour frame, adhering well to it, and is heading for a strong breakout and retest.
We are seeing a bounce from the lower boundary of the descending channel. This support is at 0.3500.
We have a downtrend on the RSI indicator that is about to be broken and retested, supporting the upside.
There is a major support area in green at 0.3050, which represents a strong basis for the upside.
Don't forget a simple thing: ease and capital.
When you reach the first target, save some money and then change your stop-loss order to an entry order.
For inquiries, please leave a comment.
We are looking to hold above the 100 Moving Average.
Entry price: 0.3640
First target: 0.3828
Second target: 0.4009
Third target: 0.4229
Don't forget a simple thing: ease and capital.
When you reach your first target, save some money and then change your stop-loss order to an entry order.
For inquiries, please leave a comment.
Thank you.

#ARB/USDT#ARB
The price is moving within a descending channel on the 1-hour frame, adhering well to it, and is heading for a strong breakout and retest.
We are seeing a bounce from the lower boundary of the descending channel, which is support at 0.2625.
We have a downtrend on the RSI indicator that is about to be broken and retested, supporting the upward trend.
We are looking for stability above the 100 moving average.
Entry price: 0.2677
First target: 0.2772
Second target: 0.2884
Third target: 0.3033

#ARB/USDT#ARB
The price is moving within a descending channel on the 1-hour frame and is expected to break and continue upward.
We have a trend to stabilize above the 100 moving average once again.
We have a downtrend on the RSI indicator, which supports the upward move by breaking it upward.
We have a support area at the lower limit of the channel at 0.3382, acting as strong support from which the price can rebound.
Entry price: 0.3408
First target: 0.3466
Second target: 0.3523
Third target: 0.3596

ARBUSDT Forming Bullish WaveARBUSDT is currently showing strong bullish momentum, forming a bullish wave pattern that suggests the beginning of a sustained upward trend. The recent price action confirms growing investor confidence, as the coin has started to recover from previous lows with higher highs and higher lows. This type of wave formation is often a signal of accumulation and trend reversal, particularly when combined with increasing volume, as seen on recent daily candles.
The volume profile further reinforces the bullish outlook, with consistent buy-side pressure indicating accumulation by both retail traders and larger market participants. The ARB ecosystem has been gaining traction in the Layer 2 scaling space, and this renewed market attention is now translating into price strength. With the current pattern development, traders could expect a potential price gain of 50% to 60% in the upcoming sessions, assuming the current bullish momentum continues.
From a technical standpoint, the price is carving out a clean impulsive move, commonly referred to as a bullish wave, which is typically followed by a corrective wave before another strong leg upward. Investors who missed the early breakout may find attractive entries on minor pullbacks. Moreover, the broader sentiment across the Layer 2 and Ethereum scaling sectors is improving, giving ARBUSDT a favorable macro tailwind.
As interest in projects with real utility continues to grow, ARB stands out due to its rapid development and growing ecosystem adoption. If this trend persists, ARBUSDT is well-positioned to outperform in the short to mid-term, making it one of the more promising altcoin plays currently on watch.
✅ Show your support by hitting the like button and
✅ Leaving a comment below! (What is You opinion about this Coin)
Your feedback and engagement keep me inspired to share more insightful market analysis with you!

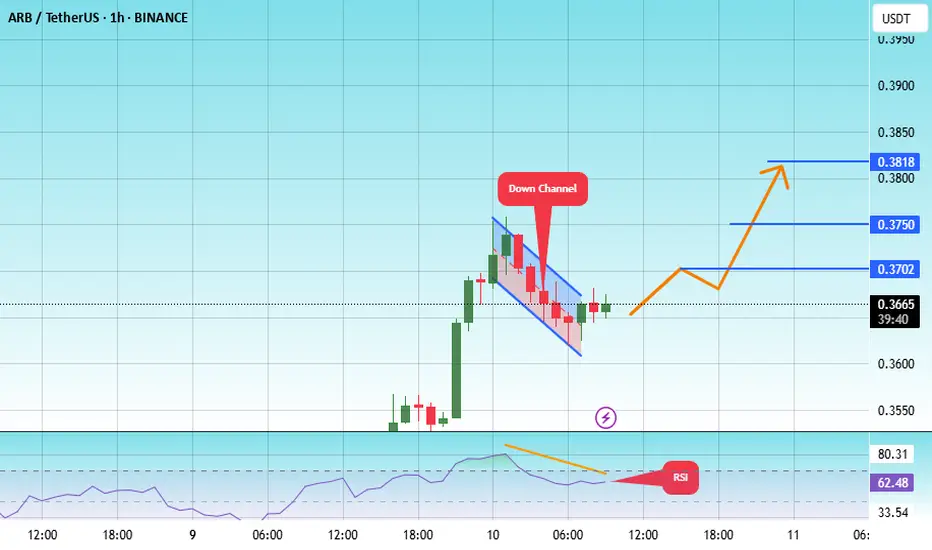
#ARB/USDT#ARB
The price is moving within a descending channel on the 1-hour frame, adhering well to it, and is heading towards a strong breakout and retest.
We are experiencing a rebound from the lower boundary of the descending channel. This support is at 0.3620.
We are experiencing a downtrend on the RSI indicator, which is about to break and retest, supporting the upward trend.
We are heading towards stability above the 100 moving average.
Entry price: 0.3667
First target: 0.3700
Second target: 0.3750
Third target: 0.3820
#ARB/USDT#ARB
The price is moving within a descending channel on the 1-hour frame and is expected to break and continue upward.
We have a trend to stabilize above the 100 moving average once again.
We have a downtrend on the RSI indicator, which supports the upward move by breaking it upward.
We have a support area at the lower limit of the channel at 0.4033, acting as strong support from which the price can rebound.
Entry price: 0.4120
First target: 0.4229
Second target: 0.4373
Third target: 0.4540

ARB - Beautiful Falling Wedge Pattern---------------------------------------------------------------
Description
---------------------------------------------------------------
+ Perfect falling wedge pattern has formed for ARB, a clear breakout from this falling wedge pattern is imminent.
+ breakout from this falling wedge pattern could push the price to previous All time high.
---------------------------------------------------------------
VectorAlgo Trade Details
------------------------------
Entry Price: 0.39
Stop Loss: 0.16
------------------------------
Target 1: 0.6229
Target 2: 0.9196
Target 3: 1.1430
Target 4: 1.6343
Target 5: 2.1129
------------------------------
Timeframe: 1W
Capital: 1-2% of trading capital
Leverage: 5-10x
---------------------------------------------------------------
Enhance, Trade, Grow
---------------------------------------------------------------
Agree or Disagree with the ideas ? lets discuss in the comments.
Like and follow us for more ideas.
Best Regards,
VectorAlgo

#ARB/USDT#ARB
The price is moving within a descending channel on the 1-hour frame, adhering well to it, and is heading for a strong breakout and retest.
We are experiencing a rebound from the lower boundary of the descending channel, which is support at 4050.
We are experiencing a downtrend on the RSI indicator, which is about to be broken and retested, supporting the upward trend.
We are looking for stability above the 100 Moving Average.
Entry price: 0.4436
First target: 0.4700
Second target: 0.4994
Third target: 0.5367

ARB (the strongest weekly candle what next ?)ARB / USDT
The Price printed the strongest weekly candle at horizon trendline after Series of downtrends such price action support the idea of being the bottom !
What next ?
Possible playout in coming weeks we see the price hit the recent high of December and after that if bulls continue showing their strength may hit the next target in my chart
Best wishes

#ARB/USDT#ARB
The price is moving within a descending channel on the 1-hour frame, adhering well to it, and is heading for a strong breakout and retest.
We are seeing a bounce from the lower boundary of the descending channel, which is support at 0.2460.
We have a downtrend on the RSI indicator that is about to be broken and retested, supporting the upward trend.
We are looking for stability above the 100 Moving Average.
Entry price: 0.2720
First target: 0.2850
Second target: 0.2954
Third target: 0.3095

#ARB/USDT Ready to launch upwards#ARB
The price is moving in a descending channel on the 1-hour frame and is adhering to it well and is heading to break it strongly upwards
We have a bounce from the lower limit of the descending channel, this support is at a price of 0.5960
We have a downtrend on the RSI indicator that is about to be broken, which supports the rise
We have a trend to stabilize above the moving average 100
Entry price 0.6220
First target 0.6567
Second target 0.6890
Third target 0.7262

#ARB/USDT Ready to go higher#ARB
The price is moving in a descending channel on the 1-hour frame and sticking to it well
We have a bounce from the lower limit of the descending channel, this support is at 0.7400
We have a downtrend on the RSI indicator that is about to be broken, which supports the rise
We have a trend to stabilize above the moving average 100
Entry price 0.7600
First target 0.7911
Second target 0.8161
Third target 0.8400

#ARB (SPOT) entry range( 0.4650- 0.6150) T.(1.3990) SL(0.4287)BINANCE:ARBUSDT
entry range ( 0.4650- 0.6150)
Target1 (0.9000) - Target2 (1.0740)- Target3 (1.3990)
1 Extra Targets(optional) in chart, if you like to continue in the trade with making stoploss very high.
SL .1D close below (0.4287)
*** collect the coin slowly in the entry range ***
*** No FOMO - No Rush , it is a long journey ***
**** #Manta ,#OMNI, #DYM, #AI, #IO, #XAI , #ACE #NFP #RAD #WLD #ORDI #BLUR #SUI #Voxel #AEVO #VITE #APE #RDNT #FLUX #NMR #VANRY #TRB #HBAR #DGB #XEC #ERN #ALT #IO #ACA #HIVE #ASTR #ARDR #PIXEL #LTO #AERGO #SCRT #ATA #HOOK #FLOW #KSM #HFT #MINA #DATA #SC #JOE #RDNT #IQ #CFX #BICO #ARB ****

#ARB/USDT#ARB
The price is moving in a descending channel on a 30-minute frame and is expected to continue upwards
We have a trend to stabilize above the moving average 100 again
We have a descending trend on the RSI indicator that supports the rise by breaking it upwards
We have a support area at the lower limit of the channel at a price of 0.9861
Entry price 0.9861
First target 1.024
Second target 1.0
Third target 1.10

#ARB/USDT Ready to go higher#ARB
The price is moving in a descending channel on the 1-hour frame and sticking to it well
We have a bounce from the lower limit of the descending channel, this support is at 1.07
We have a downtrend on the RSI indicator that is about to break, which supports the rise
We have a trend to stabilize above the 100 moving average
Entry price 1.07
First target 1.13
Second target 1.17
Third target 1.23

#ARB/USDT Ready to go up#ARB
The price is moving in a descending channel on the 30-minute frame and sticking to it well
We have a bounce from the lower limit of the descending channel, this support is at 0.8400
We have a downtrend on the RSI indicator that is about to be broken, which supports the rise
We have a trend to stabilize above the moving average 100
Entry price 0.8684
First target 0.8922
Second target 0.9288
Third target 0.9647

TradeCityPro | ARBUSDT Analysis Leading in TVL Among Layer 2👋 Welcome to the TradeCityPro channel!
Let’s analyze one of the favorite coins in the crypto world, especially popular among airdrop hunters, ARBUSDT, which has shown strong movement recently. We’ll review future triggers together.
🟢 Bitcoin Overview
As always, before starting the analysis, we take a look at Bitcoin:
It hasn’t moved significantly compared to yesterday and remains range-bound.
However, its dominance has been decreasing, providing an excellent opportunity for altcoins and Ethereum to perform , If Bitcoin’s decline continues, altcoins will likely remain green.
🕒 Weekly Timeframe
ARBUSDT has rebounded from its most critical weekly support and made an upward move, reaching a key resistance at $0.9578.
The RSI has also entered its overbought zone, which isn’t an ideal buy signal and suggests a correction might be necessary.
If you’ve joined after the breakout of the $0.6496 resistance, you can consider pulling out your initial capital, leaving the coin essentially free for you.
If you haven’t entered yet, I’ll explain in the lower timeframes.
🛠️ Daily Timeframe
Previously, ARBUSDT followed a downtrend and reached the $0.4749 support zone with strong trend weakness.
This formed an accumulation zone, and after creating a higher low within it, the coin broke above the range and rose towards the $0.9689 resistance.
Wait for a breakout above $0.9689, accompanied by RSI entering the overbought zone again.
pullback could bring ARBUSDT to $0.8028 in the mid-term. At that point, look for a bullish confirmation candle for a potential buy.
⏱ 4-Hour Timeframe
This is the primary timeframe for futures trading. The price shows a compression pattern, forming higher lows and equal highs, indicating a possible breakout.
📈 Long Position Trigger
position can be taken after breaking $0.9689 , Set a stop-buy order beforehand since whale-driven movements might occur, pushing RSI beyond 75.14.
📉 Short Position Trigger
I do not recommend opening a short position. Even if the trendline breaks, I’d prefer waiting.
As long as the price stays above $0.7980, focus on long opportunities.
🔗 TradingView Chart
💡 BTC Pair Insight
ARBUSDT compared to Bitcoin has been bearish in the long term , However, after the Layer-2 hype cooled, the token showed strong trend weakness, printing several green candles.
The main trigger here is the breakout of 0.00001004, allowing for significant upward movement if the market turns bullish.
📝 Final Thoughts
Stay calm, trade wisely, and let's capture the market's best opportunities!
This analysis reflects our opinions and is not financial advice.
Share your thoughts in the comments, and don’t forget to share this analysis with your friends! ❤️

ARBUSDT Double Bottom Breakout Confirmed!BINANCE:ARBUSDT Technical analsysi update
ARB's price broke above the double bottom neckline resistance on the daily chart with high volume and has since retested this resistance level. A bullish move can now be expected from the current level. The price has also crossed above the 100 EMA on the daily chart, which is another bullish sign for ARB

#ARB/USDT#ARB
The price is moving in a descending channel on the 1-hour frame upwards and is expected to continue.
We have a trend to stabilize above the moving average 100 again.
We have a downtrend on the RSI indicator that supports the rise by breaking it upwards.
We have a support area at the lower limit of the channel at a price of
0.5700.
Entry price 0.5290.
First target 0.6113.
Second target 0.6346.
Third target 0.6583.

#ARB/USDT#ARB
The price is moving in a descending channel on the 4-hour frame
And it is sticking to it well
We have a bounce from the lower limit of the descending channel and we are now touching this support at a price of 0.5170
We have a downtrend on the RSI indicator that is about to be broken, which supports the rise
We have a trend to stabilize above the moving average 100
Entry price 0.5390
First target 0.5642
Second target 0.5912
Third target 0.6240

Target 7,5-8 usdAfter etf approved, ETH is on the move and ARB is under ETH with huge volume and interest + price discovery mood. This can run a lot.
NOT A FINANCIAL ADVICE, MANAGE YOUR RISK AND USE STOPLOSS
