#SNP500 #SPX Weekly Analysis & Forecast For The Week AheadTraders, SNP500 has been moving exactly to the levels that we have been predicting. We see that it has completed a W pattern and now is falling. We do have 2 opportunities long and short at the moment. So which one is better one?
Lets find out.
If you found this idea useful, hit the like button and subscribe. If you have your own ideas to share on this market or have a question, comment below so that we can discuss.
Disclaimer:
The content on this analysis is subject to change at any time without notice, and is provided for the sole purpose of education only. Not a financial advice or signal. Please make your own independent investment decisions.
____________________________________________________
Arcs, Circles And Spirals

NYSE:WTI P-Modeling Pt 2. Harmonic Strings of The Illusive CajunWelcome Hyperspace Agent.
This is an analysis of WTI OIL.
In order to understand where we are now, you must see the entire time-series of Part One.
Press Play first.. Then View Snapshots In Order
Then scroll to see Time-Series Snapshots In order. This idea is from Sept 2019.
If you skip the step above.. you won't understand... how i progressed to what I am presenting now.
Or if you simply don't care.. That is perfectly ok! No one is forcing you.
But you prob won't get it either way. And if you do...? well.. gold star for youuu. .
_______________________________________________________________________________________________________
Nothing is placed randomly. The original idea *PART ONE* nailed the targets, but was incorrect on timing. However, once adjusted it can be viewed in Time-Series fashion how the targets were indeed hit quite in an interesting manner. Both Part One and Two are on the same time-frame. The inverted cup and handle was executed. It had a harmonic exit.. so my initial timing was off. This was validated with the snapshots in Part One. But then it deviated after completing the original harmonic goals.. So two propositions began to develop.
Proposition A is in the yellow trend.
Proposition B is in the Red trend.
We inch a tad higher? and Wham..Bam. Slapped down..
Catalyst.. Dropped demand of oil as USA and globe enters Wave Two of Covid-19. or
The idea is we have a second bottom. But a true Bottom. That is outlined in Proposition B. Adam and Eve as they may call it I guess?..
I think we are going to execute Proposition B. Mere Penny's.
However, keep an eye on proposition A and the structure of the chosen fractal vs the actualization of the trending.
It will not be exact... Not always at least. ;)
This is simply an update to see how the rest of the story plays out.
There is def a lot of validity to it. Now let's see if we can refine it further..
Trial and Error.
Failure is a necessary component of success.
Thanks for Pondering the Unknown with Me,
Glitch420

Crude Oil melting zonesitting on 0.618 zone. looks like its ready to retrace. 3rd time hit this resistance now. No reason for it to push through ... tp1 green tp 2 pink

Fib circles explanation - Short and sweetSimple explanation on chart. All you need to do really is find the strongest trend between two extreme points.

EURUSD is GOING to be IN THE FLOOR! BH-STAfter analyzing Fibonacci, Gannbox , and FishPattern ... we have a great entry for SELLING.
I've found this 'qantum-gravity-price-zone', and ... just don't let it go. Let's wait for #Bloodhound'sEffect! And #BePatient!
For me, analyzing markets is an art, I just draw it-. -JBPip


BTC/USD Short Term Break out Discussion Zoom in to find out more .
Target point comes from Parent Trend DNA
Accumulation point is a result of three different analysis (fib ret ,fib spiral , lower boarder of main trend channel )
if you find it useful plz like or share . comments for more idea .
BTW today analysis is not against the main trend analysis from previous job , its just covering market current situation.
cheers

Modified Sell and Buy TargetsBITBAY:BTCUSD
Modified version of my last two Ideas Now with two opposite Fibonacci Spirals when they are unveiling the accurate location of the next big Bearish trend, Return Point and The Pick Point .
Thanks

The next down Falling is startedSpiral Fibonacci pasterns are saying the forth but not the last falling down scenario is started

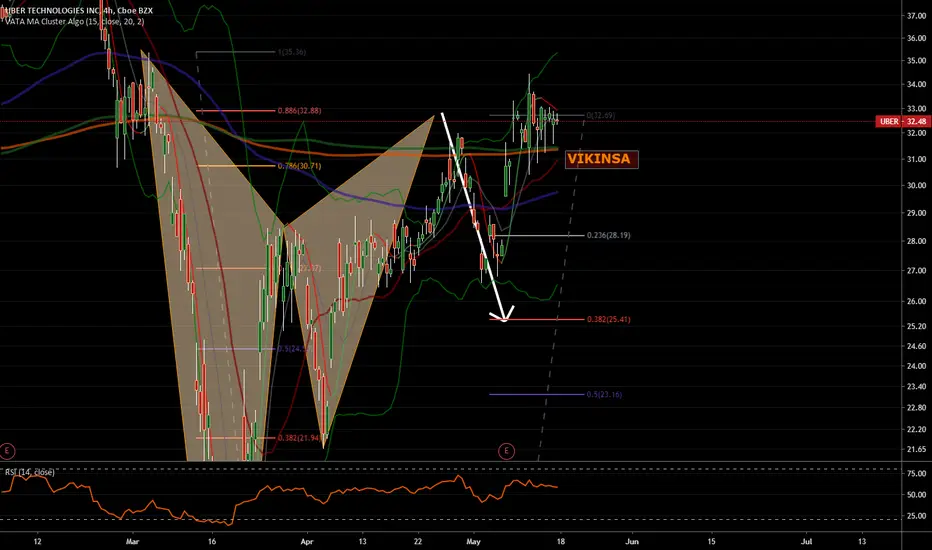
#UBER 32.69 Is Still Acting As Resistance (Pattern Completion)Trader, UBER completed this pattern at 32.69 and it did a fake breakout to the upside but then settled down under 32.69. It has been trying but so far the level has been acting as great resistance for it. Having said that, it still has potential to go up to 35.31. Lets see how it plays out.
If you found this useful hit the like button, subscribe to my channel and share this with other traders. Comment on the post to let me know what you think of them.
Have a great trading week!
P.S. (This is for education only. Not a financial advice or signal.)

#GBPUSD Weekly Analysis & Trading PlanTraders, GBPUSD has not been able to find strength on either side. However this can all change very quickly now. It has potential to go down. Here is my analysis and trading plan.
Support and motivate me by hitting the like button, subscribing to my channel and sharing this analysis with other traders. Comment below and let me know what you think of this analysis and what is yours? I welcome all comments, feedback, ideas and sharing of knowledge.
Have a great trading week!
P.S. (This is for education only. Not a financial advice or signal.)

ETH: $200 Short Target, Potential $155 RetracementFirst off, please don't take anything I say seriously, or as financial advice. That being said, let us get into my insights. Looking at Fibonacci circles, there is a potential negative retracement back to a $155 price point, given that Ethereum looks like it could follow a small negative correlation wave. This is why I think, so likely it is best to shorten at $200 and see if there is a market dip. As it looks like it may potentially be tipping this positive correlation wave. A bearish trend could happen, so I'm not sure a long hold would maximize profits over other cryptos (Such as BTC).

Fibonacci WavesAn idea regarding Fibonacci
I believe the price within the arcs of the fibonacci circle move in waves
With 1.618 being a bearish wave in this case, with a bullish transition to another ring.
There seems to be a clear relationship between 1.618 and .618 its probably simple for someone more knowledgeable in this field which I am still learning.
Explains on chart.
If anyone knows more about this comment please.

How I draw Fibonacci SpiralsFirst of all comment if i'm doing something wrong, last thing i want to be doing is spreading misinformation.
Bullish moves should be placed from peak to bottom point. Highlighted in green.
While bearish moves should be places from bottom to peak point. Highlighted in orange.
These can be placed on any bullish / bearish wave, as long as they 'respect' the fibonacci spiral to a reasonable extent.
You can play around with these waves and look at how you can pick tops and bottoms using these spirals.
The middle trendline does not have to be particularly strong for the spiral to pick tops and bottoms.
If the spiral respects the wave it should trend nicely along a price point. Highlighted in orange.
These spirals in turn work well with Fib Circles, creating nice arcs to identify movement.

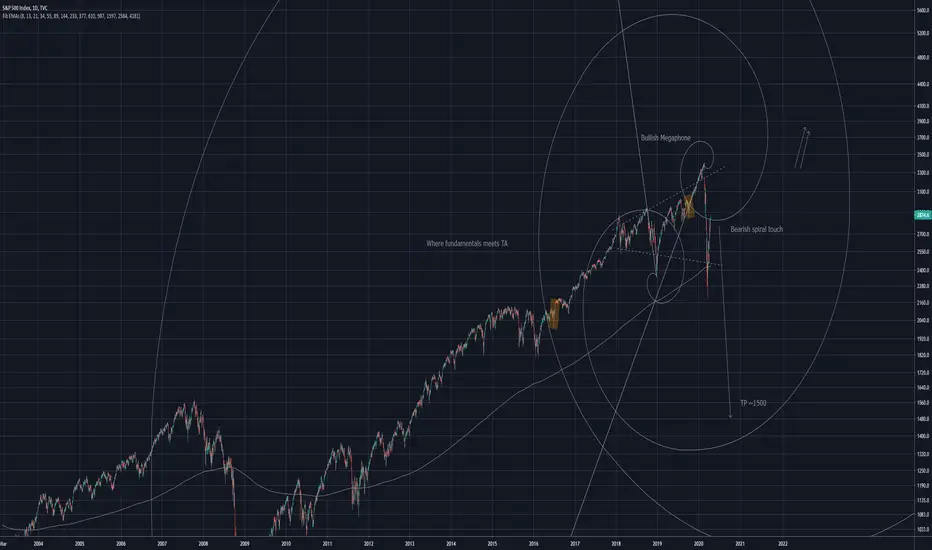
SPX Too good to be trueIt seems too good to be true! a bullish megaphone has emerged amidst all this chaos. This is where TA and fundamentals clash. Or do they?
As you can see the Fibonacci spiral provides sufficient resistance for a large drop. With the price gapping over the spiral!
I believe this to be one of the biggest bull traps i've seen.
I highly DOUBT we will see a follow through of this bullphone and a collapse is next.
EOS SpiralsSome spirals for EOS
Biggest takeaway from this is the buy point once the inner spiral or downward trend line is broken
Spiral tails are places of resistance / support for price

LTCBTC SpiralsSome spirals for the LTCBTC pair,
price tends to trend along the spiral, or break through it in a strong fashion
In this case i think the price will trend along the spiral until it breaks out upwards retesting resistance labelled (1)

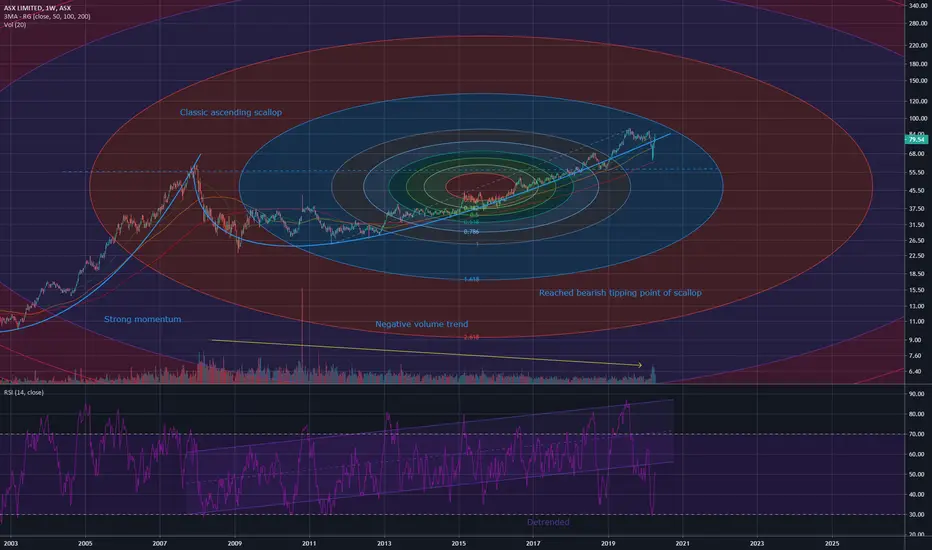
ASX Fib Circle and Ascending ScallopShowing the potential bearishness is an ascending scallop
The leg of the scallop has been extended so far that momentum has decreased and bearish momentum has been engaged
I am very bearish on Australian stocks.
First time using fib circles :)
FULL MOON AND JEW HIGH HOLY DAY GOOD FRIDAY AND EASTER AND JEWISH HIGH HOLY DAY GOOD FRIDAY AND EASTER FROM DARKEST INTO THE LIGHT FROM DEATH TO REBIRTH NOTHING IS RANDOM .BASED ON MATH IT IS ALL A RELATIONSHIP WITHIN THE BLUEPRINT OF THE GOLDEN RATIO AND THE WORK OF Einstein

Bitcoin's Capitulation Window, a close-up lookIf the fractal of the 2014 bear market is, in fact, repeating and gives us the clues then May 2021 seems to be what is written on the wall for Bitcoin's final capitulation-making-low.
Check out the related idea that is linked to this idea to learn more!
keep calm, hodl

Patience, grasshopper.... GOLD! (XAU)Hello friends. Hello Traders. The chart speaks for itself. A Breakout of $1500....the implications seem clear. You can look at my other gold charts for further reference....
I won't get into politics.
I won't go into a long winded monologue about the fed..
I will simply say....good luck traders =)

ETHUSD | GoldenIs anyone going to the Fibonacci convention? I hear it's going to be twice as big as last years.
Not Trading Advice
