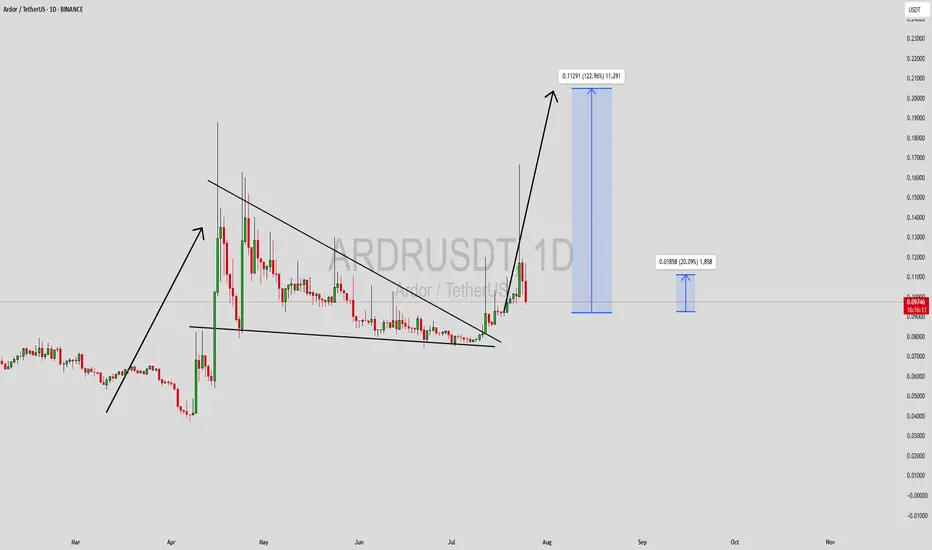
ARDRUSDT Forming Falling WedgeARDRUSDT is displaying a strong bullish technical structure following the successful breakout from a falling wedge pattern—a formation typically associated with trend reversals and substantial upside moves. This breakout is accompanied by solid volume, which further validates the move and hints at strong buying interest. Historically, falling wedge breakouts have produced impressive gains, and in this case, the chart is suggesting a potential rally in the range of 90% to 100%+.
Ardor (ARDR) is gaining traction among traders and long-term investors due to its scalable blockchain infrastructure and real-world applications, especially in enterprise use cases. As the project continues to evolve, market participants are starting to take note of its utility and strong development backing. The recent price consolidation within the wedge and the explosive breakout is a textbook signal for bullish continuation, especially when it occurs after prolonged accumulation.
The price target zones projected on the chart—up to the 0.1129 USDT level—highlight the bullish momentum that may follow. Technical indicators such as MACD crossover and RSI divergence also support this outlook. If the current trend persists and market sentiment remains supportive, ARDRUSDT could easily hit and even surpass these levels, delivering triple-digit percentage returns.
This setup represents a classic high-reward scenario for both breakout traders and position holders aiming to capitalize on mid-term trends. Keep an eye on volume spikes, as they often precede or confirm large moves. With overall market sentiment leaning bullish and increasing social engagement, ARDR is shaping up to be a potential breakout performer in the coming weeks.
✅ Show your support by hitting the like button and
✅ Leaving a comment below! (What is You opinion about this Coin)
Your feedback and engagement keep me inspired to share more insightful market analysis with you!
ARDRBTC
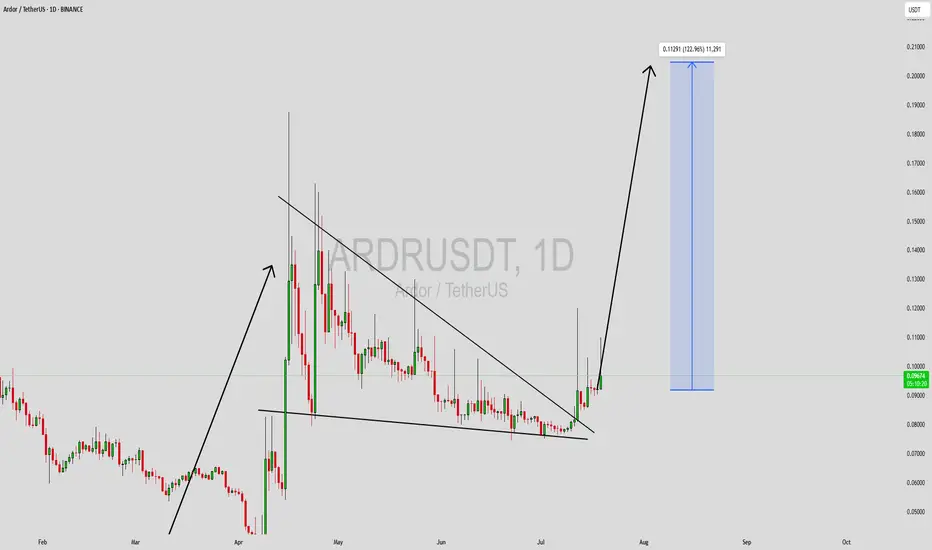
ARDRUSDT Forming Bullish WaveARDRUSDT is currently demonstrating a strong bullish wave pattern, indicating a powerful shift in market momentum. After a period of accumulation, the price has begun to trend upward with higher highs and higher lows forming on the chart. This bullish structure, supported by healthy trading volume, points to increasing confidence among traders and investors. If the pattern continues to hold, we can expect a significant breakout, with potential gains estimated between 90% to 100% in the near term.
The Ardor platform is gaining renewed attention in the blockchain space due to its unique multi-chain architecture and real-world applications, especially in enterprise solutions. As interest in scalable and interoperable blockchain ecosystems grows, ARDR is beginning to surface on more investors’ radars. The technical breakout is aligning well with this growing fundamental support, providing added conviction for bullish traders.
From a trading perspective, the current breakout offers a solid entry opportunity, especially if the price consolidates above recent resistance levels. Traders should watch for volume surges and continuation candles as confirmation of the bullish trend. With strong technical indicators aligning with positive sentiment, ARDRUSDT could become one of the leading performers in the upcoming altcoin rally.
✅ Show your support by hitting the like button and
✅ Leaving a comment below! (What is You opinion about this Coin)
Your feedback and engagement keep me inspired to share more insightful market analysis with you!
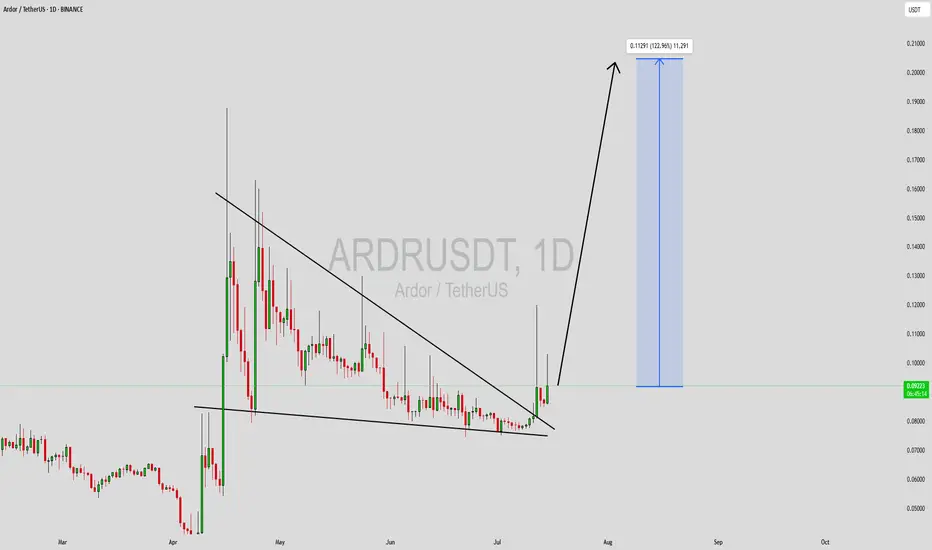
ARDRUSDT Forming Bullish BreakoutARDRUSDT is showing a highly promising setup that is catching the eyes of crypto traders looking for the next big breakout. The chart displays a clear structure that suggests a significant move could be imminent. With volume picking up steadily, the pair is indicating strong buyer interest, which supports the potential for a sharp upward surge. The current market sentiment combined with this technical formation points towards a likely bullish continuation that could deliver impressive gains for patient holders.
What makes ARDRUSDT stand out right now is the clear consolidation phase it has been undergoing, which often precedes explosive price action. As traders search for undervalued altcoins, ARDR is increasingly appearing on their radar due to its history of strong price swings and its current attractive technical setup. The market is closely watching the resistance levels, and a confirmed breakout could attract even more momentum-driven buying pressure, potentially driving the price towards the projected gain of 90% to 100%+.
Investors are showing renewed interest in ARDRUSDT because of its strong community support and its role within the blockchain ecosystem. With the broader crypto market stabilizing and altcoins regaining traction, ARDR could benefit from increased capital flow into smaller-cap projects that have room for growth. If the breakout holds with solid volume, this pair could easily outperform many peers in the coming weeks.
✅ Show your support by hitting the like button and
✅ Leaving a comment below! (What is You opinion about this Coin)
Your feedback and engagement keep me inspired to share more insightful market analysis with you!
ARDRUSDT: Blue Box Looks Promising!ARDRUSDT: Blue Box Looks Promising! 🚀
Here’s the quick breakdown:
Volume Surge: A 100% daily volume spike—buyers are waking up!
Key Zone: The blue box is shaping up to be a strong potential demand zone.
Next Steps: Waiting for confirmation—bullish market structure breaks on lower time frames or a strong reaction with CDV support.
This setup looks like a great opportunity if conditions align. Patience is key here—don’t chase the move, let the trade come to you.
Boost, comment, and follow for more insights like this! Let’s make it happen! 💪
Let me tell you, this is something special. These insights, these setups—they’re not just good; they’re game-changers. I've spent years refining my approach, and the results speak for themselves. People are always asking, "How do you spot these opportunities?" It’s simple: experience, clarity, and a focus on high-probability moves.
Want to know how I use heatmaps, cumulative volume delta, and volume footprint techniques to find demand zones with precision? I’m happy to share—just send me a message. No cost, no catch. I believe in helping people make smarter decisions.
Here are some of my recent analyses. Each one highlights key opportunities:
🚀 RENDERUSDT: Strategic Support Zones at the Blue Boxes +%45 Reaction
🎯 PUNDIXUSDT: Huge Opportunity | 250% Volume Spike - %60 Reaction Sniper Entry
🌐 CryptoMarkets TOTAL2: Support Zone
🚀 GMTUSDT: %35 FAST REJECTION FROM THE RED BOX
🎯 ZENUSDT.P: Patience & Profitability | %230 Reaction from the Sniper Entry
🐶 DOGEUSDT.P: Next Move
🎨 RENDERUSDT.P: Opportunity of the Month
💎 ETHUSDT.P: Where to Retrace
🟢 BNBUSDT.P: Potential Surge
📊 BTC Dominance: Reaction Zone
🌊 WAVESUSDT.P: Demand Zone Potential
🟣 UNIUSDT.P: Long-Term Trade
🔵 XRPUSDT.P: Entry Zones
🔗 LINKUSDT.P: Follow The River
📈 BTCUSDT.P: Two Key Demand Zones
🟩 POLUSDT: Bullish Momentum
🌟 PENDLEUSDT.P: Where Opportunity Meets Precision
🔥 BTCUSDT.P: Liquidation of Highly Leveraged Longs
🌊 SOLUSDT.P: SOL's Dip - Your Opportunity
🐸 1000PEPEUSDT.P: Prime Bounce Zone Unlocked
🚀 ETHUSDT.P: Set to Explode - Don't Miss This Game Changer
🤖 IQUSDT: Smart Plan
⚡️ PONDUSDT: A Trade Not Taken Is Better Than a Losing One
💼 STMXUSDT: 2 Buying Areas
🐢 TURBOUSDT: Buy Zones and Buyer Presence
🌍 ICPUSDT.P: Massive Upside Potential | Check the Trade Update For Seeing Results
🟠 IDEXUSDT: Spot Buy Area | %26 Profit if You Trade with MSB
📌 USUALUSDT: Buyers Are Active + %70 Profit in Total
🌟 FORTHUSDT: Sniper Entry +%26 Reaction
🐳 QKCUSDT: Sniper Entry +%57 Reaction
📊 BTC.D: Retest of Key Area Highly Likely
This list? It’s just a small piece of what I’ve been working on. There’s so much more. Go check my profile, see the results for yourself. My goal is simple: provide value and help you win. If you’ve got questions, I’ve got answers. Let’s get to work!

#ARDR/USDT #ARDR
The price succeeded in breaking the bear flag.
At the price of 0.9000. The price trended upward.
after penetrating the Moving Average 100.
The first goal is 0.2000.
The second target is 0.2666
This rise is supported by seven sells on the MACD
But attention must be paid to the correction before completing the ascent.

#ARDR/USDT#ARDR
The price has chosen the bearish channel to the top and the channel is now being retested again at the 0.0900 level.
We have a higher stability moving average of 100
We have an uptrend on RSI
We also have a bullish incentive from the rise of Bitcoin
Entry price is 0.0900
The first target is 0.1000
The second goal is 0.1086
The third goal is 0.1181

ARDR buy setupGiven the bullish iCH and iBOS, we have a bullish view on ARDR.
We have a liquidity pool above, which is expected to move from the demand range towards this pool.
Closing a 4-hour candle below the invalidation level will invalidate this analysis.
Note that the financial market is risky, so:
Do not enter any position without confirmation and trigger.
Do not enter a position without setting a stop.
Do not enter a position without capital management.
When we reach the first TP, save some profit and try to move the stop continuously in the direction of your profit.
If you have any comments please post them, comments will help us improve our performance
Thanks

ARDRUSDT 400% Potential!ARDRUSDT technical Analysis Update.
ARDRUSDT has been ranging for the last 550 days. We can expect a good up move soon.
Buy zone : Below $0.131
Stop loss : $0.102
Spot trade.

$ARDR/#BTC [#Ardor]: BBand_Breakout Super-TrendOn the $ARDR / $BTC chart, we can see a Bollinger Band breakout and a Super Trend pattern. Both indicators are indicating a bullish trend, with the Bollinger Band indicating a probable positive trend as the price has moved outside of the upper band and the Super Trend indicating a bullish trend. Because both indicators are in sync, this is a stronger bullish indication. To buy at the current price range and aim for higher levels would be a solid option. Our analysis indicates that the key resistance levels are at 0.00000465 | 0.00000497 | 0.00000552 and the major support zones are at 0.0000041 | 0.00000387 | 0.00000332.
Technical Metrics :
Current price: 0.00000413
24H Volume: 3.4779 Ƀ
24H Price change: 0.243%
- Pivot Points - Levels :
Resistance: 0.00000465 | 0.00000497 | 0.00000552
Support: 0.0000041 | 0.00000387 | 0.00000332
Indicators recommandation :
Oscillators: NEUTRAL
Moving Averages: NEUTRAL
Technical Indicators Summary : NEUTRAL
- In-depth ARDRBTC technical analysis on > Tradingview TA page
What do you think of this analysis? Share your insights and let's discuss in the comments below. Your like, follow and support would be greatly appreciated!
Welcome to the home of charting big: TradingView
Benefit from a ton of financial analysis features, instruments and data. Have a look around, and if you do choose to go with an upgraded plan, you'll get up to $30.
Discover it here

#ARDR/BTC [Ardor]: Resistance_Breakout_+_ConfirmationWe've detected a Resistance Breakout and Confirmation on the ARDR/BTC chart. The price has broken above a key resistance level and has been confirmed by a strong candle, indicating a potential bullish trend. We may consider buying at the current price zone and targetting higher level.

Ardor Weekly Reversal Pattern Can Print 270% Growth!The weekly candle will close in less than 12 hours, once this candle closes a bullish pattern can form if ARDRBTC closes above 0.00000545 (or EMA50).
For confirmation, we need this and next weeks candle to close.
On this chart we have the support levels marked (blue) and also the targets (grey/yellow).
You can leave a comment if you have any questions or revise the chart for additional information.
3000%+ to ATH:
Thanks a lot for your support.
Namaste.

$ARDRWe have a Huge triangel. And it looks similar like on 2017 before it broke out 20 NOV 2017. I have a bag but if it breaks 0.38$ and makes this as support We have a confirmed brakout.

ARDR Macro Bullish TrendArdor is in an upward trend. My last TA completed an Adam & Eve, but then I zoomed out to see a larger U-Shaped recovery, which it's following nicely. On the two and three day Ichimoku everything is bullish except cloud is still bearish. Tenkin is above Kejun, price is above cloud, and trailing indicator is above price. Having a long timeframe going bullish is very very good. Keep an eye on that. The one day is mega bullish.
We'll have to take this day by day until something breaks the trend, but here are two targets based on nearby peaks and resistance. Target 1, 772 sats which would complete the U-Shape by May 2nd. Target 2, around 1350 sats which is next point of resistance When T2 happens is difficult to predict, if it goes parabolic than early June, other wise by end of year. These can be real nice returns if you've been following since 330 sats. I'll keep updating this if there a re any trend reversals. God speed.

ARDR/USDTIt has been Accumulated over recent period and not showed up any significantly move in recent market but looks like Whales accumulated enough for next big pump and it is Whales favorite coin which always pump bigger in shorter time frames so have your sell targets as well.
I have marked the targets and stoploss on the chart.


Ardor (ARDR) Breaks Resistance, Next Target Mapped!Today we have a huge volume bar for ARDRBTC (Ardor) to break above the EMA100 blue line... This is great news.
Each time we see a strong resistance level taken out on high volume, this is a signal that favors the bulls.
The MACD is trending up strong while the RSI is now above 73, signaling that the bulls are being favored.
On this current move, ARDRBTC found resistance around 440 satoshis...
On the next move, we are likely to hit 680 or more...
Additional details on the chart.
Namaste.


$ARDR Onward and upward.Ardor is looking brilliant on the 1 day charts.
Stochastic RSI, MACD and EMA's all bullish
Yesterday we broke Trend and closed above the 55 day moving average, but at the moment it is below.
Id like to see the Supertrend indicator give us a buying signal. But overall this is nicely building up

ARDRBTCFirst, it needs to come above 2h MA200 that bitcoin bull caused it to drop. Then it will be above 2h MAs again.

