Buy low sell highA trader buys low and sells high. Usually with volatile stocks like these that will mean buy when sentiment is worse vice versa. If rsi goes under 30 you buy, over 70 you can start to unload because this stock tends take some time to form a top.
ARKK

Dont Short ARK, Buy SARK..!I believe It would be better to Buy SARK instead of Shorting ARKK..!
Why?
Look at ARKK biggest bets:
TSLA:
COIN: ARKK average cost 284 USD/Share
HOOD: ARKK average cost 30 USD/Share
PLTR: ARKK average cost 24 USD/Share
RBLX: ARKK average cost 84 USD/Share
I don't know when they want to start their active management???
They just keep buying, the problem is they don't have any money and they just sell tesla and buy others..!
The difference between tesla and their other investments is, Teslaraties believe in Elon Musk and it is a religion for them..!
Looking at my post published on FEB 14th, 2022:
About Tuttle Capital Short Innovation ETF
The investment seeks to provide investment results that are approximately the inverse of, before fees and expenses, the price and yield performance of the ARK Innovation ETF (the “ETF”). The fund is an actively managed exchange-traded fund that attempts to achieve the inverse (-1x) of the return of the ETF for a single day, not for any other period, by entering into a swap agreement on the ETF.
Entry: 42.5-45.5
Stop loss: close below 41
Reward/Risk: depends on entry and target
Target range: short term 53 midterm 63
Time Frame: 2-6 wks
Possible gain: 20-42%
Possible loss:10%
Position size: 5 % of trading capital
You can see the most important support(green line) and resistance (red line) levels.
Best,
Moshkelgosha
DISCLAIMER
I’m not a certified financial planner/advisor, a certified financial analyst, an economist, a CPA , an accountant, or a lawyer. I’m not a finance professional through formal education. The contents on this site are for informational purposes only and do not constitute financial, accounting, or legal advice. I can’t promise that the information shared on my posts is appropriate for you or anyone else. By using this site, you agree to hold me harmless from any ramifications, financial or otherwise, that occur to you as a result of acting on information found on this site.

Conclusions on the current context on MAToday, we will look at Master Card, a key name in the information & technology sector, with a market cap of 375B. As a comparative thing, VISA has a market cap of 484B
So, what are the main technical elements we can observe here?
1) The price has been inside a massive daily correction of 275 days, and a few weeks ago, we observed the breakout of it.
2) Now, we can observe a clear "throwback" (name to define the retest movement after a breakout on a bullish trend) that has been developing on the last 15 days
One of the fundamental aspects of the way we trade is understanding the current context and comparing it with historical data (that's why I love using the logarithmic chart)
As you can see, this is not the first time we have observed a correction of this size, and this has been a common behavior since 2007.
What's my conclusion on this?
Take all those corrections I have shown you in the Log chart, and check this concept "Drawing the corrections in the same way I'm doing it on the main chart of this post" after we have the breakout and the throwback, on average, trading on a new high its a great level to get exposure to a possible bullish movement. Of course, this is not working in all of them, but I can see an edge that I need to polish a little more before defining my final setup. (For this basic test I conducted, I placed stop losses below the throwback)
What if this keeps falling? Then you don't trade
What happens if you trade this and it's a stop loss? That's always a chance, to be precise, 50% of the time that happens to me, so make sure you control your risk (The general concept is 1% risk per setup) and only trade if your risk to reward ratio is equal to or higher than 1.8
Thanks for reading; I hope this was useful, and feel free to share your view and chart in the comments! Thanks.

This is my current plan on ROKUROKU is down 70% from the previous "ATH" and is below a clear descending trendline; I'm really interested in this kind of name to look for opportunities in case a new bull run comes. My main thesis to support the idea that a new bull run may come is on the logarithmic chart.
As you can see, these big drops have already happened in the past , and after that, we observed massive bullish movements. So my view is that there are similarities between them and that past behavior may repeat again.
Ok, nice that these mean that we should buy now? Of course not; that's why we use technical analysis to detect common patterns between all these past situations and try to find which would be the most efficient way of trading this "opportunity." My conclusion is that I want to observe breakout followed by a correction in the daily chart of 7 to 12 days and a clear 10% retracement.
IF that happens, then I will be interested in trading on a new local high in the same way you can see on the chart, with a target on the next major resistance level.
What happens if the price keeps falling? Then I will not trade, and I expect a move towards the next support. From there, I will look for the same setup I'm mentioning here.
Thanks for reading! Feel free to share your view and charts in the comments!

ARKK To Leak LowerIn this update we review the recent price action in ARKK and identify the next high probability trading opportunity and price objectives to target

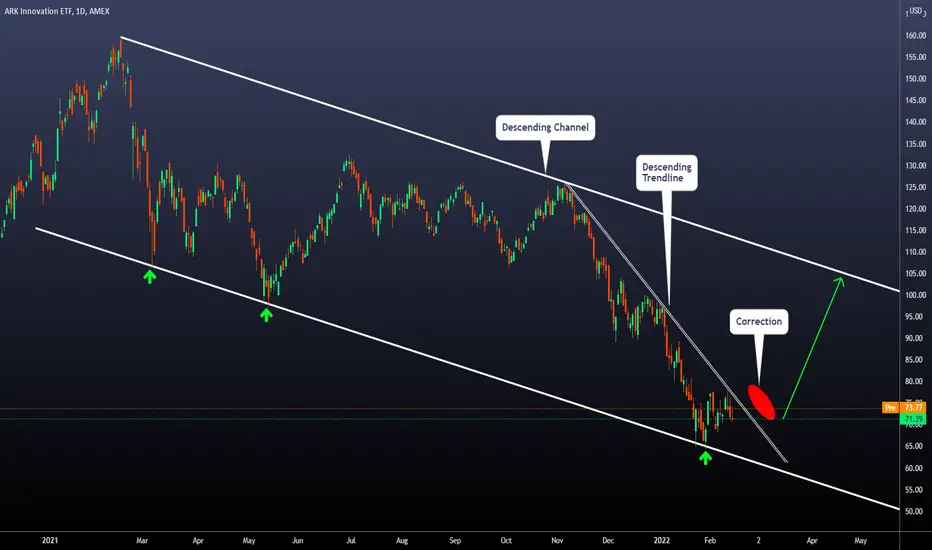
ARKK | Inside the descending channel Today we will look at the current situation on ARKK.
Technical Elements:
-The price has reached the lower zone of the cloned channel.
-Inside the descending channel, we can observe a descending trendline.
The main element I want to highlight here is that the price had reached a significant target for the bearish movement. Can the price keep falling? Of course, nobody knows with certainty what the price may do. However, we are in an excellent spot to start thinking about possible bullish situations.
What's the idea I'm developing? Wait for the breakout of the current descending trendline + a corrective pattern (red circle)
IF that happens, I think we have good bullish potential to trade on a new local high towards the higher trendline of the descending channel. At the moment, this is an idea that requires patience to see how the price evolves.
Thanks for reading!
Coincidences or No Coincidences that’s the question???This is just my observation ..!
And
I invite the 30 million users to think about it..!
Between January 12 and February 2, 2022, I noticed these 3 articles (linked to the chart) were chosen as editor’s pick..!
As you can see ARKK’s performance in all time frames is severely negative in the past year ..! (Right upper corner)
I checked all the editors picks in that 3 weeks timeframe (January 12-February 2nd), and find ARKK and BTC with 3 editors pick in that timeframe hold the 1st rank..!
All three editors picked articles present long ideas about ARKK, and now you can see ark is trading blow the prices of the days these articles were published and picked..!
Another interesting observation is: these coincidences happened around ARK invest summit on January 25th..!
I would like to finish my observation with a quote from Anthony Horowitz:
(Anthony Horowitz - Author of Alex Rider, Foyle's War, Sherlock Holmes, James Bond, TV and film writer, occasional journalist.)
“So it's a coincidence. Just like you said. Two rich parents with two rich kids at the same school. They're both killed in accidents. Why are you so interested?"
"Because I don't like coincidence," Blunt replied. "In fact, I don't believe in coincidence. Where some
people see coincidence, I see conspiracy. That's my job.”
Best,
Moshkelgosha
DISCLAIMER
I’m not a certified financial planner/advisor, a certified financial analyst, an economist, a CPA, an accountant, or a lawyer. I’m not a finance professional through formal education. The contents on this site are for informational purposes only and do not constitute financial, accounting, or legal advice. I can’t promise that the information shared on my posts is appropriate for you or anyone else. By using this site, you agree to hold me harmless from any ramifications, financial or otherwise, that occur to you as a result of acting on information found on this site.

ARKK: UPDATEWe always need to be cautious when the market is uncertain.
Know i'm not so confident we recover so quickly, so be prepared to more low prices and maybe buy again.

The Week Ahead: TWTR, UAA, GPN, PFE Earnings; ARKK, XBI, XRTEarnings Announcements in Options Liquid Underlyings with >70 rank and >50% 30-Day Implied:
TWTR (93 rank/90 30-day implied) (Thursday, before market open)
UAA (80/68) (Friday, before market open)
GPN (71/51) (Thursday, before market open)
PFE (76/42) (Tuesday, before market open)
Pictured here is a directionally neutral TWTR short strangle paying 1.34 on a buying power effect of 3.71 (on margin), 36.1% ROC at max; 18.1% at 50% max. It announces earnings on Thursday before market open, so look to put on a play in the waning hours of Wednesday's session if you want to take advantage of the ensuing volatility contraction post-announcement on Thursday.
For those more of a defined risk bent, consider the February 18th 25/30/44/49 iron condor, paying 1.14 at the mid price as of Friday's close on buying power effect of 3.86, 29.5% ROC at max, 14.8% at 50% max with 2 x expected move break evens.
UAA is probably small enough to short straddle/iron fly, with the February 18th 19.5 short straddle paying 2.42 on buying power of 3.93 (on margin), 61.6% ROC at max, 15.4% at 25% max. The risk one to make one iron fly would be a "stays within the expected move" sort of play with the February 18th 15.5/19.5/19.5/23.5, paying 2.03 on 1.97, 103% ROC at max; 25.8% ROC at 25% max.
The GPN February 18th 130/160 short strangle was paying 2.97 on buying power of 14.97 as of Friday's close, 19.8% ROC at max, 9.9% at 50% max. The bid/ask is showing wide in after hours, and I don't particularly like the five wides where I want to pitch my tent. This is probably why I haven't bothered to play it before.
Although PFE's 30-day is a bit <50%, I figured I'd price out a setup because of its high options liquidity. Unfortunately, it's not very compelling at the moment, with the 16 delta 48.5/58.5 in the February 18th contract paying a scant .89 on buying power of 6.12 as of Friday's close -- 14.5% ROC at max, 7.3% at 50% max.
Exchange-Traded Funds With Ranks >50 and 30-Day IV >35%:
ARKF (76/63)
XBI (71/45)
ARKK (70/67)
ARKG (70/65)
XRT (63/46)
KWEB (63/54)
SMH (60/41)
GDX (50/45)
Pick your Cathie Woods poison (ARKF, ARKK, ARKG), I guess. Otherwise, sell premium in XBI or (there's one I haven't seen in a while) ... XRT, although you're probably going to get more bang for your buck out of KWEB, with its higher 30-day.
Broad Market Exchange-Traded Funds, Ordered By Implied Volatility Rank:
QQQ (55/29)
IWM (54/30)
EFA (43/19)
SPY (41/22)
DIA (40/21)

Bullish setup on ARKK to $100Highest weekly candles for 2 weeks. Weekly MACD and CCI curling up.
Price at 200 weekly moving average. Many are expecting lower prices. But I think the correction is done and we will see rally towards $100 in the near future.

ARKK up & down CycleRegardless Macro Economy, ARKK had winter for 2 years then comes back up. Hope for 2023 -2024

Noahs Ark Got Stranded At Sea - Arkk Of HopeAn interesting ETF I will certainly be keeping my eyes on
ark-funds.com
ark-funds.com
AMEX:ARKK
BCBA:ARKK
BVL:ARKK
FINRA:ARKK_SHORT_VOLUME
FTX:ARKKUSD
UPBIT:ARKKRW
LSE:SARK
LSE:ARK3
LSE:ARKS
LSE:3ARK
LSE:1ARK
BITTREX:ARKKUSDT
LSE:ARKA
CAPITALCOM:ARKK

Oversold on Monthly chartMonthly CCI and RSI are showing highly oversold in the history of ARKK.
Price is at 50 Monthly moving average. There should be a good bounce from these levels.

Lets Talk ARKK Weekly Baby! Capitulation!
One of the most important chart patterns is the buying and selling climax. A classic example of the pattern, in the form of a potential selling climax (S/C) is showing up in the daily and weekly charts of ARKK. Climaxes are exhaustion patterns, they develop as the last needful seller (weak hands) capitulates and hits the bid. Sellers are essentially exhausted.
1) Selling climaxes exhaust the available supply and often mark an important change in the market state.
a. Even if they don't mark the end of a trend, they often lead to a period of consolidation. It is not unusual to see a trading range develop after the completion of the secondary test.
b. Climaxes are fractal, appearing in literally every time frame.
c. Climaxes appear after a long period of trend.
2) Climaxes typically appear concurrently with terrible news flow.
a. Late last week I overheard an obviously frustrated fund manager on Bloomberg state that "I'm liquidating and going back to the real fundamentals." Down nearly 60% over the course of the last year he, and many other investors were finally throwing in the towel.
3) Climax patterns occur on extremely heavy volume.
a. A clear reversal bar (often a key reversal) is typically evident.
b. But modern climaxes can take several days to complete.
c. Often the liquidated shares are distributed from weak hands, to strong hands.
d. The new buyers are not necessarily long term investors and they often take advantage of the reaction rally to take trading profits.
4) There is often a sharp rally just prior to the selling climax. Wyckoff labeled this as preliminary demand (P/D), a point where strong handed longs are beginning to accumulate shares. The P/D is an alert to begin monitoring for a selling climax. In the case of ARKK, this P/D warning did not occur.
5) Immediately following the S/C is the automatic rally (A/R). Since sellers have been exhausted, the A/R can often cover significant ground. Buyers of the selling climax often use this rally to sell a portion of the position built during the climax.
6) In the case of ARKK, there is a micro test of the S/C. The successful test set the stage for the A/R.
7) A much larger secondary test separated in time must be completed before the S/C can be trusted.
Its important to note WHERE the behavior is occurring. In past entries, I have talked about building confluences of support and resistance to create zones. These zones can then be monitored for patterns that are consistent with a change in trend.
1) Price is resting at the bottom of both short term and intermediate trend channels. I generally view channel tops and bottoms as more reliable indicators of overbought and oversold than most of the momentum suite of indicators. The two channel bottoms formed a support confluence in the 61.81 to 63.63 area.
2) There is a clear three wave move (A-B-C) that can be used to generate Fibo extension targets. I use the A-B-C pattern to generate three targets, 1, 1.382, 1.618%. The distance is then projected from the top of C. In this case the tool generated equality with the first wave at 63.38. You can use the Trend Based Fib Extension tool in MV to generate the calculation.
3) The three levels (two channels and 1 Fibo) produce a support confluence in the area between 61.81 and 63.38. This is the zone where the S/C occurred.
Most momentum oscillators are deeply oversold. I have included the weekly RSI to illustrate. Note the curl higher.
Odds are good that the selling in ARKK is essentially exhausted now. My guess, given the broader backdrop, is that it will form a trading range lasting several weeks, maybe months that will allow strong hands to redistribute shares before beginning a fresh markdown. But, opinion not withstanding, I will follow the evidence and clues as they build.
Good Trading:
Stewart Taylor, CMT
Chartered Market Technician
Shared content and posted charts are intended to be used for informational and educational purposes only. The CMT Association does not offer, and this information shall not be understood or construed as, financial advice or investment recommendations. The information provided is not a substitute for advice from an investment professional. The CMT Association does not accept liability for any financial loss or damage our audience may incur.

ARKK Clarification and UpdateAfter reading the comments in yesterday's ARKK post I realized that I needed to clarify the post, particularly in light of what, in retrospect, was an overly enthusiastic title.
I had hoped to call attention to the anatomy of an important price behavior that is important across a wide variety of assets and time frames. I also intended to highlight how I use charts to approximate where these structures might develop. Instead I gave some the impression that I thought the selling climax would mark a long term low. That was not my intent. I will be more precise in the future.
Finally, while I think ARKK represents a great example of how a selling climax develops, I don't think it's bear market is over. I made that point in the final paragraph. ARKK has a tremendous amount of work to do before the trend could be changed from bearish to bullish.
Thanks to all who posted in the comments. There are some great observations and questions. I would encourage you to read them. The community here is (for the most part) pretty cool with many very knowledgeable participants.
Clarifications:
1) Selling climaxes clear out the immediately available supply. This does not mean that new supply can't come out.
2) Selling climaxes typically stall the market for a period of time, and often result in a trading range. But they can fail, and when they fail rapidly, which they often do in bear markets, the failure says very bad things about the asset.
3) This is why climax structures MUST BE SUCCESSFULLY TESTED before they represent anything other than short term capitulation. A micro test isn't enough for more than a few days, perhaps a quick trade. This was point 7 in the post. In retrospect, I should have made it point 1.
4) A successful test must be well separated in time from the initial selling climax. I prefer to see them play out over several weeks.
5) In other words, the huge volume and the reversal bar are only a warning that things may be changing. But, without the completed test, it is only conjecture and does not constitute (at least in my opinion) it’s a data point, not a tradable event.
6) In short, YOU MUST HAVE A COMPLETED TEST before deciding that a low of any consequence has been made.
7) I ended the piece by stating that the selling in ARKK is essentially exhausted now. I should have written it…. Essentially exhausted FOR now.
8) Finally, the only reason I monitor ARKK is the individual names in the portfolio. Funds are made up of many individual assets. Individual assets may be in very different positions in their trends than a given fund, index or market. ARKK holds many names that might eventually hold interest for me.
A final point, I think the fundamental/macro influences on equity are quite negative (just my opinion, but I am wrong a lot). Given that, its difficult for me to believe that the risk reward for a long position in ARKK is advantageous or that it will survive the testing process. But, I will follow the evidence and reevaluate if a successful test of the selling climax and subsequent bullish behavior develops.
Good Trading:
Stewart Taylor, CMT
Chartered Market Technician
Shared content and posted charts are intended to be used for informational and educational purposes only. The CMT Association does not offer, and this information shall not be understood or construed as, financial advice or investment recommendations. The information provided is not a substitute for advice from an investment professional. The CMT Association does not accept liability for any financial loss or damage our audience may incur.


ARKK - Buying BS, but make moneySeriously, I just can't take her serious...
But OK, she's providing opportunity to make some cash.
Going long after today is OK.
Just sell after a couple days §8-)
#makemoneywithsh

$ARKK - Highest weekly volume in its existenceVolume is a truth indicator. Last week's volume was the highest in the history of $ARKK. I think we have found the floor. Price action today is likely a lot of shorts covering. I would expect to consolidate around these levels for a few months before any major upside movement, but this is a good level to start adding to your growth portfolio.

ARKK: IS TIME TO BUY?In my opinion start to accumulate in this range is a good bet for the long term.

Arkk - at amazing confluence - should be bottoming Jim Cramer just came on and said sell it all, right at the bottom, perfect. Huge capitulation wick, I think it's time to go long.

Rolled: ARKK March 18th 103.22 Short Put to April 14th 103... for a .10 credit.
Comments: Rolling this out on strength to lock in the gain experienced by the 103.22 (which it quickly gave up during the day), improve the strike slightly, and to keep some extrinsic in it. I'm still looking at the deep in-the-money short put as functionally long stock that I'm short strangling with the March 18th 59.22/81.22 to reduce cost basis. I've collected a total of 22.68 in credits, so my break even is 103 (the short put strike) minus 22.68 (total credits collected) or 80.32 relative to where the stock closed today at 69.03, so I still have some cost basis reduction work to to do.

Be on the right side of change. Tuesday, Jan. 25 ARK sumitBe on the right side of change is a fancy title for an investment company that lost 23-25% of the value of their 4 main funds in the past 16 trading days!
No need to say that these funds had lost 17-34% of their values in 2021.
I think it is crucial to be on the right side of the change, otherwise...!
One of my favorite Youtubers is Ozzy man, he has a series called Destination F..!
It is a compilation of failures, he usually says: Someone is definitely ending up in destination F regarding their employment status over this.
(being on the wrong side of the change)
Market sentiment has changed a lot and those who are on the right side of the change are sitting on piles of cash or shorted the market..!
Each candle shows 1 year.

ARKK - Hydrophones Picking Up Crush DepthNoise has given way to a creaking Hull.
This JUNK ETF was doomed, it took some time, but
our $64 PO is coming into view.
Cathy has gone from Hero to Goat with her JPM
cohort - Tom Lee, the other Carnie.
_____________________________________________
I detest lying shills.
