Ethereum Leveling Map — ETH/USDT 1DNo directional bias for Ethereum, but will use levels to spot entries for intraday.
Right now located at POC and seems balanced for both sides.
Potential Adam&Eve setup in development.
Quality levels for support $2150, 2000, 1800, 1500.
Resistances $2700, 3000, 3500, 4000
Keep in mind it will follow BTC price action by most of time.
Happy trading
Arshevelev

BTC/USD 1h Chart Analysis: BTFDBitcoin is showing a bullish structure on the 1h timeframe with a potential move towards $109,000.
On smaller timeframes, it exhibits a clear "buy the dip" profile.
Key Levels:
$109,000: Potential upside target.
$107,000: Resistance/Support zone to watch for rejection.
$105,000: Low Volume Node (LVN*) a possible good long entry zone.
$102,000 - $100,000: Support levels to monitor if $105,000 fails.
Currently it have bullish trend with a potential dip near $105,000 showing good entry point.

Bitcoin Trajectory for Q2 and Q3 2025Bitcoin clearly have lack of buying pressure at this stage. Currently price creating a Rounded Top structure, which we've seen in the past. Projected target zone for this pattern is swing to $107,000 and swing down to $91,000.

Bitcoin Trajectory for Q1 and Q2 2025Hey everyone, it’s been a while! 👋
Let’s dive straight into the Bitcoin outlook and my vision for the months ahead. 🚀
Key Observations 📊
Patterns : Rounding Top & Bottom.
Rebound Levels:
Alt. 1: $101,000
Alt. 2: $82,000
Moving Averages : EMA50 & EMA188.
Target Area : $135,000+ 🔥
Pro Tip 💡
I'm setting an alert for the EMA188 cross on BTCUSDT to stay ahead of the game.
Stay tuned for more updates and insights! 💬

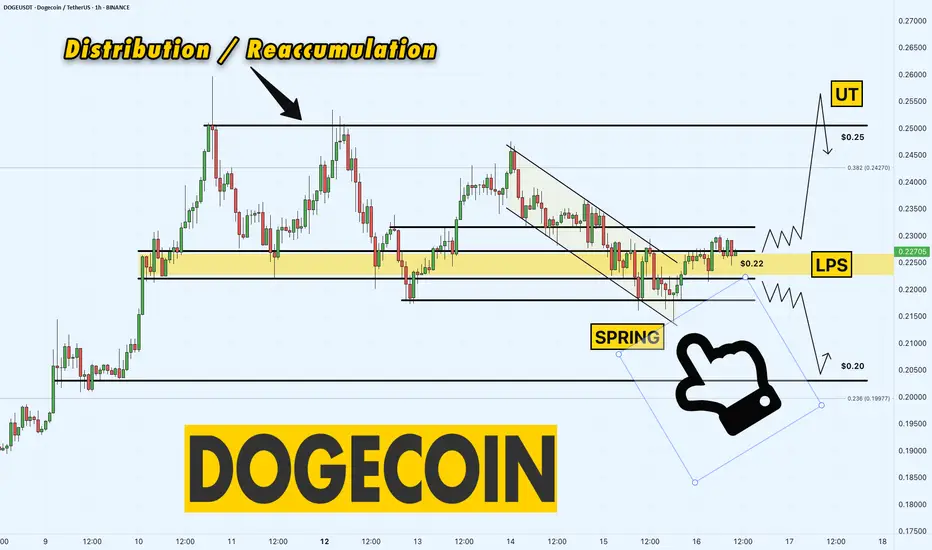
DOGE/USDT 1-Hour Chart – Distribution or Reaccumulation?Dogecoin is at a critical juncture on the 1-hour chart!
We’re seeing signs of a Distribution/Reaccumulation phase, with the price action teasing a potential move. After a possible Spring shakeout at $0.215, DOGE has climbed into the Last Point of Support (LPS) range between $0.22 and $0.23. This could be a launching pad for a bullish move!
I’m watching for a push toward $0.25, where we might see a UT (Upthrust) structure form — a solid target for this setup. However, if the price fails to hold, a breakdown below $0.22 could send us toward the $0.20 level, a key support to watch. The $0.22-$0.23 zone is critical right now — will bulls take control, or will bears strike back? Let’s find out!
Key Levels to Watch:
Support: $0.22 (LPS range), $0.20 (breakdown target)
Resistance: $0.23 (upper LPS range)
Target: $0.25 (potential UT structure)
What’s your call, traders? Are we heading for $0.25, or will $0.20 come into play ? Drop your thoughts below!
LTC/USDT 1-Hour Chart – Symmetrical Triangle Alert! Litecoin is gearing up for a big move on the 1-hour chart!
We’ve got a textbook Symmetrical Triangle forming, with LTCUSDT squeezing tighter and tighter between converging trendlines. The price is now approaching the upper resistance of the triangle around $104. This setup is screaming breakout potential!
If LTC clears the triangle’s resistance, we could see a strong push toward the $111.01 target — a key resistance level to watch. On the flip side, if it fails to break out, the $92.16 level (now potential support) will be critical to hold. Volatility is coming, and I’m ready for it — are you? Let’s see if Litecoin can spark a rally!
Key Levels to Watch:
Support: $92.16 (previous resistance, now support)
Resistance: $104 (triangle upper boundary)
Target: $111.01 and $125 (next major resistances)
What’s your take, traders? Are we breaking out or pulling back? Drop your thoughts below!

ARB/USDT 1-Day Chart – Downtrend Channel with a Bullish Twist!Arbitrum is playing out a textbook downtrend channel on the 1-day chart, and the structure is crystal clear!
We’ve been cycling through Accumulation → Rise → Distribution → Selloff, and right now, we’re in the Rise phase at $0.43. The price is climbing steadily after bouncing from the $0.35 support after breakout from Fallind Wedge within Selloff phase, and I’m eyeing a potential target of $0.66 — 0.618 Fib near the upper boundary of the channel!
This channel has been guiding ARB’s price action since late 2023, with each phase clearly marked. The current $0.35 level is a key support to watch — if it holds, this rise could have legs. But if we break below, the next accumulation zone might kick in. Let’s see if ARB can keep the momentum going and hit that $0.66 target!
Key Levels to Watch:
Support: $0.35 (current base of the rise)
Current Price: $0.43 (rise phase)
Target: $0.66 (0.618 fib near channel resistance)
What do you think, traders? Are we heading for $0.66, or will the downtrend channel strike back? Drop your thoughts below!

Solana 1-Day Chart – Are We on the Brink of a $1,000 MOONSHOT?!Solana is absolutely on fire! On this 1-day chart, we’re witnessing a massive rising channel that’s been building since 2023. After a solid rebound from the $93 support, Solana has smashed through a fractal resistance line (check that arched arrow from mid-2023 to early 2024 top) . Now, it’s breaking out at a parallel resistance, hanging around $174 — and this could be the setup for a MASSIVE move upward!
I’m calling a potential target of $1,000 if SOLUSDT can muscle through the big resistances ahead: $200, the ATH at $270, and everything beyond. This breakout screams opportunity — Solana might just catch another wave of demand and go parabolic! The $93 support (marked "Back to Nothing Below This Line") looks rock-solid, giving us a strong foundation for this rally.
Key Levels to Watch:
Support: $93 (channel base)
Current Price: $174 (breakout zone)
Resistances: $200, $270 (ATH)
Target: $1,000 (if momentum holds)
Are you ready for this? I’m buzzing — I can’t believe this might actually happen!
Let’s hear your thoughts, traders! Are we heading to $1,000, or will resistance hold us back?

BNB/USDT 4H Chart: Rising Channel with Fractal Vibes!Hey traders! Binance Coin is showing some promising action that’s got me on the edge of my seat!
We’ve got a clear rising channel in play, with BNBUSDT moving beautifully in sync with a fractal line pattern shown above the chart — mirroring past price behavior like a roadmap! BNBUSDT is currently trading at $650 , I think price will continue bouncing between the channel’s support at $620-$600 and move upwards to the key resistance target at $700-$720 . A breakout above this resistance could send BNB soaring to new highs, potentially targeting $800 or beyond!
However, if BNB fails to break through, we might see a pullback to the channel support at $620-$600 .
Key Levels to Watch:
Resistance: $700-$720
Support: $620-$600
Breakout Target: $800+
Breakdown Risk: $600
Is BNB about to blast through $720, or will it retreat below support? Let’s hear your thoughts below!

Ethereum (ETH) XABCD Pattern – $3,000 Target Ahead?ETHUSDT is at $1,759 and we’ve got an XABCD harmonic pattern in play!
▸ From $1,516 (X) to $4,147 (A), then slow retracement to $2,120 (B), then a big spike to $4,120 (C), and crash to $1,385 (D).
▸ Now, the chart is eyeing $3,000 as the next big target!
▸ Watch $2,100 and $2,500 as resistance on the way up. $1,500 is key support – let’s see if it holds!
✉️ What’s your take?
Will ETH hit $3,000, or are we dipping first? Drop your thoughts! ⬇️

BTC/USDT 1H Chart: Testing Critical Support!Bitcoin is at a pivotal moment after showing weakness at $104,000 !
BTC recently hit a high of $104,338 but failed to hold, pulling back to $102,500 . The big question now: will this level hold as support?
I seeing a potential support at $102,500 . A break below could send BTC toward the Prev Day Mid at $100,600 , while a bounce might push it back toward $104,000 or even $109,100 to Yearly Highs.
Key Levels to Watch:
Resistance: $104,000
Support: $102,500, $100,600 (Prev Day Mid)
Breakout Target: $109,100
Breakdown Risk: $98,00
Will BTC hold $102,500 , or are we in for a deeper correction? Let’s hear your thoughts below!

Total Market Cap Weekly Chart: Ready to Explode?Hey traders! Let’s dive into this weekly TOTAL Crypto Market Cap chart. The headline says it all— Total Market Cap Is About to Explode , and we’re here to break it down!
We’re seeing a massive expanding triangle formation, with the market cap currently at 3.21T , right at retest of triangle resistance. Historically, these patterns have led to parabolic moves — check out the 2019 - 2020 breakout! If history repeats, a breakout could send the market cap soaring toward 8.0T or even higher!
However, if the breakout fails, we might see a pullback to the previous level of support around 2T .
Key Levels to Watch:
Resistance: 3.66T (ATH)
Support: 2T
Breakout Target: 8.1T+
Breakdown Risk: 1.20T (latest strong resistance below 2.6T)
Is the market cap about to go parabolic, or are we in for a fakeout? Let’s hear your thoughts below!

ZEN/USDT Daily Chart: Accumulation Before the Big Move? Hey traders! Let’s dive into this daily ZENUSDT chart. Horizon is in a sideways accumulation phase, forming an Expanding Wedge right after a massive bullish Falling Wedge breakout.
We’re also seeing a small inverted head and shoulders at the bottom support range of $7.08-$10.08 , with the neckline at $10.08 . ZEN recently revisited this level, and a confirmed breakout could propel it toward $18.08-$28.94 , with a major target at $41.15 .
If the breakout fails, we might see a pullback to the neckline at $10.08 or the shoulder support at $8.28 .
Key Levels to Watch:
Resistance: $18.08, $28.94, $41.15
Support: $8.28
Breakout Target: $41.15
Breakdown Risk: $8.28
Is ZEN about to skyrocket, or will this breakout fail? Let’s hear your thoughts below!

RDNT/USDT 4H Chart: Inverted Head and Shoulders? Hey traders! Let’s dive into this 4-hour RDNTUSDT chart.
Radient Capital is setting up a classic pattern that could signal a big move!
We’re seeing an inverted head and shoulders forming, with the price breaking above the resistance of Wedge around $0.2290. The "head" bottomed out near $0.1590, with the shoulders forming at higher lows.
If this pattern plays out, we could see a bullish surge targeting $0.2650 and higher!
However, if the breakout fails, we might see a pullback to the shoulder low at $0.2160 or even the support at $0.1974.
Key Levels to Watch:
Resistance: $0.2650
Support: $0.2160 (shoulder)
Breakout Target: $0.2650+
Breakdown Risk: $0.1974
Is RDNT ready to soar, or will this breakout fail? Drop your thoughts below!

BTC/USDT 1H Chart: Channel Breakdown Alert!Hey Bitcoin traders! Let’s dive into this 1-hour BTC/USDT chart. Bitcoin has made a decisive move, and it’s not looking good for the bulls!
BTC was trading within a well-defined ascending channel, with key levels at $95,800 (upper resistance) and $88,000 (last higher high). The price recently tested the support around $95,800 but failed to rebound, and now it’s crashed below the channel’s support, currently sitting at $94,300. This breakdown signals potential bearish momentum!
The next critical support to watch is $92,000, and if that fails, we could see BTC slide toward the previous resistance at $84,400. On the flip side, a recovery above $93,000 might bring some relief, with resistance at $98,000 and a potential retest of $100,000.
Key Levels to Watch:
Resistance: $95,800, $98,000
Support: $92,000
Breakdown Target: $86,000
Recovery Target: $98,000+
The bears are in control — where do you think BTC is headed next? Let’s hear your thoughts below!

Bitcoin 1-Hour Chart: Quick Market BreakdownBTC is trading within a well-defined ascending channel, with the price currently at $97,400, after breakout and retest of weekly high resistance around $95,800. The channel’s upper boundary projects a potential target of $104,000 if BTC continues to move upward over the week!
Key resistance levels to watch are $98,000 and $100,000, while support lies at $96,200 and the channel’s lower boundary at $95,000.
A breakout above $100,000 could ignite a rally toward $104,000, but if BTC fails to hold support at $96,000, we might see a dip back to $94,400-93,000.
Key Levels to Watch:
Resistance: $100,000, $98,000
Support: $96,000, $94,000
Breakout Target: $104,000+
Breakdown Risk: $93,000
Will BTC soar to new heights, or are we in for a pullback? Let’s hear your thoughts below!

Altcoins Market Cap: We on the Verge of a 5T Exposion!Hey crypto traders! Let’s dive into this monthly chart of the Altcoins Market Cap. You won’t believe what’s brewing!
We’re currently approaching a critical channel support at 200B, a level that might act as a springboard for massive rally — check out the jumps from channel support in 2019 and 2023! Each time the market cap hit this support, it skyrocketed, and now we’re at that pivotal moment again.
The chart projects a jaw-dropping target of $5T within the next 24 months if history repeats itself!
The price action shows we’re testing the lower boundary of this ascending channel, with the market cap sitting around 239.65B. A bounce here could send altcoins on a parabolic run, potentially hitting 5T by mid-2026. But if support fails, we might see a dip toward 100B — let’s keep an eye out!
Key Levels to Watch:
Support: 175B (channel support)
Resistance: 1.55T, 5T (projected target)
Breakdown Risk: 100B
Are altcoins about to explode to 5T, or will we see a deeper correction? Drop your thoughts below!
PS take a look at others vs. btc price action here:

Bitcoin 1-Hour Chart: Quick Market BreakdownIn this concise market review, we'll analyze the latest movements on Bitcoin's 1-hour chart.

XRP/USDT 1H Chart: Ready for a Moonshot? Hey XRP fam! Let’s break down this sizzling 1-hour chart. XRPUSDT is cooking up something big, and we’re on the edge of our seats!
We’re seeing a series of triangles forming, with XRP stuck in consolidation phases — each one tighter than the last. The price is currently testing the upper trendline of the latest triangle, sitting around $2.247 after bouncing off a solid support at $2.050. This setup screams potential breakout! I put on the chart a bold “Highway to Moon” arrow pointing upward, hinting at a possible surge toward $2.600 or beyond if XRP breaks free.
But let’s not get too starry-eyed — failure to break out could see XRP retreat to the support zone at $2.050, or even lower to $2.000 if things get shaky.
Key Levels to Watch:
Resistance: $2.299
Support: $2.2184
Breakout Target: $2.360+
Breakdown Risk: $2.000
Are we heading to the moon, or is this a fakeout? Let’s hear your thoughts below!

NEAR/USDT 1H Chart: Breakout or Breakdown?Hey crypto traders! Let’s zoom into this 1-hour chart, because NEAR is serving up some serious action!
We’ve got a massive triangle forming, with the price squeezing tighter and tighter between converging trendlines. NEAR is currently dancing around $2.466, teasing a breakout after bouncing between resistance at $2.729 and support at $2.419. This pattern is a pressure cooker, and a big move is coming — will it soar to new highs or crash back down?
A bullish breakout above the upper trendline could propel NEAR past $2.610, potentially targeting $2.729 or higher! But if it fails to hold support at $2.540, we might see a dip toward $2.419 or even lower.
Key Levels to Watch:
Resistance: $2.610
Support: $2.540
Breakout Target: $2.729+
Breakdown Risk : $2.419
What’s your take — bullish surge or bearish pullback? Let’s hear your predictions below!

BTC/USDT 1H Chart Analysis: Breakout Incoming?Hey traders! Let’s dive into this juicy BTCUSDT 1-hour chart. Bitcoin is teasing us with some serious action!
We’ve got a textbook symmetrical triangle pattern forming, with price consolidating tightly between converging trendlines. This is a classic setup for a big move — Bitcoin is coiling up like a spring, ready to explode!
The chart shows multiple phases of consolidation , with the latest triangle pushing BTC toward a critical decision point near the weekly high of $95,773.15 and the monthly high of $95,119.06.
The price is currently hovering around $95,000, testing resistance. A breakout above the upper trendline could send BTC soaring past $96,600, potentially targeting $97,200 or higher!
On the flip side, a rejection here might see it dip toward the daily low of $92,839.27 or even the lower trendline for support.
Key Levels to Watch:
Resistance: $95,773.15 (weekly high)
Support: $92,839.27 (daily low)
Breakout Target: $97,200+
Breakdown Target: $92,800
✉ What do you think — bullish breakout or bearish?
Drop your thoughts below!

LINK/USDT 1H Chart Update Chainlink is riding a strong Rising Channel!
Price action shows clear patternson LINKUSDT
▸ Bullish Doritos at $12.00 & $13.00, pushing the price higher.
▸ Reverse Doritos at $13.00 & $15.00, leading to pullbacks inside Rising Channel.
▸ Key levels to watch: $14.00 (support) and $17.00 (upper resistance).
✉️ As long as LINK stays in the channel, the bulls are in control! Will we see a breakout to $17.00 soon? Let’s discuss!

XRP Nears Triangle Apex: Breakout to $2.30 Incoming?XRPUSDT is heating up! Approaching apex of the Triangle!
Will we see a breakout to $2.30? Or possibly to $2.03!
Check the 1H chart & watch the breakout!
