Ascending

GBPJPY BEARISH SWING SIGNALGBPGPY IN AN ASCENDING CHANNEL AND THATS AN INDICATION OF A BEARISH BREAKOUT SO WE ARE GOING TO LOOK FOR A SHORT FROM THIS PRICE

ETH Bulliesso i wrote an in depth analysis here but tradingview deleted the entire thing
long story short -
bulls have taken back ethereum, its elliot wave has been completed (5 impulse, 3 corrective waves), higher highs lower lows signal bullish trend, ascending channel convergence point should act as stop loss, resistance levels will be tested heavily on the way up so stay watching that volume indicator ,
we don't gamble around here set your stop loss


GBP/JPY, Ascending Triangle formingHey guys,
The red line was the top of a Descending Triangle, and now the bottom of an Ascending Triangle indicating that this is a strong resistance point.
Furthermore, most of the time the trend line side of a triangle breaks, so that's why I think the following pattern will happen.
The purple line is the bottom of the Ascending Traingle and a possible turning point.
If, you zoom out you can see a giant orange channel. Because, these channels sometimes work like a magnet it is even possible that the market will go back inside of this channel or bounce of it.
Kind Regards,
Khaine


Ascending trendline in Bitcoin/USD (1w chart)We can watch a pronounced ascending trend. In the last two weeks the trend is slowly decreasing.
Ana Valentina Tosta
TF

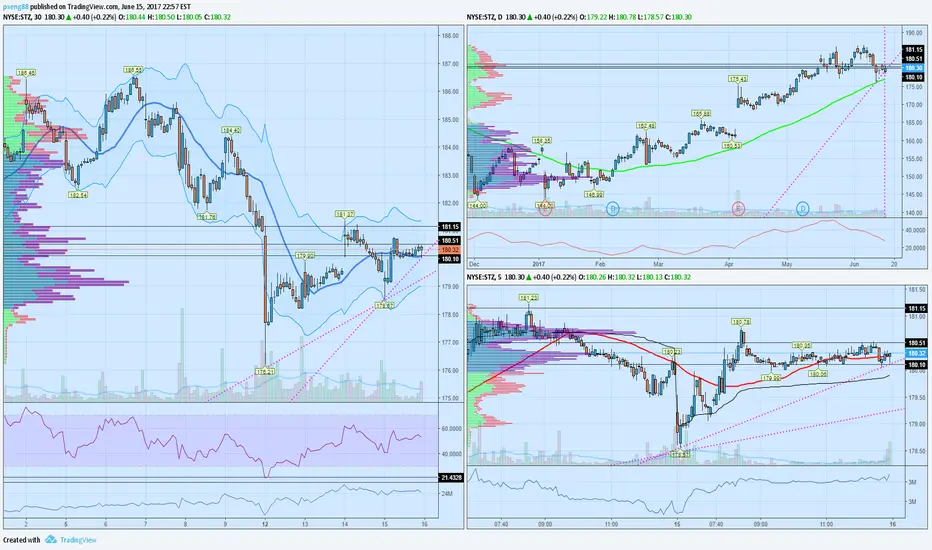
$stz ascending triangle higher time frame in defined uptrend and found support area after pullback-high probability
mid time frame showing formation of ascending triangle- an inverse head and shoulders showing symmetry
lower time frame in range bound consolidation- monitoring price action for break of first resistance area of 180.5x to target to 181.2x area
$MDT positioning for a big breakouthigher time frame is in channel range uptrend looking to breakout strong
mid time frame is showing positive price action- showing higher highs and higher lows along trend line
rising rsi and positive volume pressure-trading above value area showing strong momentum
lower time frame is showing price action showing uptrend with weak correctives moves meaning bulls in control-working way up ascending triangle
trend alignment across the board

Ascending Triangle PASC/BTCThis point would be perfect to buy pascal to get a good position before the Stronger pump of the triangle.

WBA potential trade setuplong term trend is trending down finding support at 80.21
looking to play for a mini breakout short term
ascending triangle on intermediate time frame
increasing positive volume pressure/ increasing relative strength
measured move up to around 82.32 resistance area
risk reward ratio= 3.25 stop at 81.15
remaining cautious as longer trend is to the down side

Bitcoin ascending wedge brokendownAscending wedge broken, breakdown point retested, now heading down to horizontal support + secondary trendline + broken wedge target.
Entry 1791
Stop loss: 1841
Target 1686

wtiusd/ usoil / cl1! pattern & elliottwave & channelWTIUSD / USOIL / CL1! /CL2! /
* PATTERN
Ascending Triangle
*Elliott wave
Corrective wave ABC
=> Corrective wave Elliott wave5 (ABCDE)
*Hamonic pattern
Gartley
*UPtrend!
CL1! CL2! USOIL WTIUSD

Eur/Usd 28-03-2017 (AP)Hello Dear Traders & Welcome To Growing Forex
After The Major Downfall Back In 2015 The Pair Is Trading In A Consolidation With No Clear Direction.The Pair Is Forming A Double Zigzag As Of Now But Can Make Possible Move Of Triple Zigzag Correction.As You Can See In The Chart The First Wave Of Zigzag Correction Where Point C Falls Short To Complete Its Flat Pattern Therefore Indicating A Double Or A Triple Correction.(#Flat Correction#Wave C Falls Short Of Wave A #Indicating A Double Or A Triple Correction.)The X Correction Is A Zigzag Followed By Wave A Having A Zigzag Inside That Can Extend Up To 1.0978 Minor Resistance.If The Pair Breaks Above This Levels Next Target Would Be The 78.6% Of Swing High & Swing Low Which Is The Second Trend Line Above.On The Flip Side The Pair Can Triangle Correction (Flat + Any three + Triangle) But The Possibilities Are Less.
Note: Try Creating Pockets.
Note: Please Leave Comments For Any Query.
Disclaimer: Trade At Your Own Risk.
Good Luck,
Regards,
Growing Forex.

AUDCHF Ascending Triangle Short ideaPrice has formed a ascending triangle with resistance being a major level
price has bounced off once before and if it bounces again now I'm expecting it to go down and break the lower trendline
A retest of the TL will add extra validity to the trade meaning it is a good idea to enter short


EURCHF ascending triangle shortprice formed an ascending triangle and broke in direction if impulse
retest is expected to enter short

Ascending Triangle Formation-Daily Chart
-Forming Ascending Chart
-Watch for Breakout to Previous High

EURUSD M240 - ascending Wedge, wait for the BreakoutEURUSD formed an ascending Wedge on the M240 timeframe. Wait for the breakout for a possible downmove.

Ascending Channel reaching Strong Resistance-Reaching strong Resistance at 17.72
-Prices are trading in a Ascending Channel formation
-Prices have dropped from this level in the past
-Very likely prices will drop to approx 12


Trendline and Fib testingTesting the Trendline and the 50.00% Fib and as you can see it's forming HL on the 4h chart. Watching how market behaves the next hours and if it doesn't break => Long position

Watch for GBPUSDSince we've hit the Weekly resistance and hit the TL , we have have a ascending triangle. Beter wait for further confirmation. After the strong bearish move we have formed newer HL and HH on the daily. Either trading the bearish breakout or waiting for a bullish movement to enter whenever it should cross the weekly resistance. But for now just observing...
