How Can You Use the Ascending Triangle in Trading?How Can You Use the Ascending Triangle in Trading?
An ascending triangle is a chart pattern traders rely on to identify potential breakouts and further price movements. Recognised for its versatility, this pattern can signal trend continuations across all types of markets, including stocks, forex, commodities, and cryptocurrencies*. In this article, we’ll break down how to spot and trade this formation.
What Is an Ascending Triangle?
An ascending or rising triangle is a bullish chart pattern that usually signals a trend continuation. It is framed by two trendlines. The upper line connects highs placed at almost the same level, while the lower line is angled and connects higher lows.
The triangle’s appearance is explained as follows: buyers try to push the price up, but they meet a strong resistance level, so the price rebounds. Still, buyers have strength, which is reflected in higher lows. Therefore, they continue pushing the price until it breaks above the resistance level. The period during which the price bounces back and forth between the two lines depends on the timeframe. On daily charts, the triangle can be in place for over a week.
Note: The ascending triangle is a continuation chart pattern but sometimes it can be used as a reversal signal. It happens when the ascending triangle occurs in a downtrend. It’s the biggest challenge of all the triangles.
The rising triangle is one of the setups in the triangle group. There are also descending and symmetrical formations.
Ascending, Descending, and Symmetrical Triangles: The Differences
The triangle group of patterns comprises ascending, descending, and symmetrical formations.
The ascending triangle is a bullish formation and the descending triangle is bearish. At the same time, the symmetrical triangle is a bilateral setup that signals a rise and a fall in the price.
To distinguish between them, traders draw trendlines. In a rising triangle pattern, an upper trendline is horizontal and connects equal or almost equal highs, while the lower trendline is rising as it connects higher lows. In a descending or falling triangle pattern, the lower trendline is horizontal and connects equal or almost equal lows, while the upper trendline declines, going through lower highs. A symmetrical triangle has a falling upper line that connects lower highs and a rising lower line that connects upper lows.
How Traders Spot the Ascending Triangle
It’s quite easy to identify the formation on a chart. Still, there are a few rules that may help a trader determine its strength.
- The trend strength. Although the setup may appear on any timeframe, traders look for strong long-term trends as risks of a fakeout on low charts are higher.
- Consolidation. Triangles appear when the market consolidates within an overall trend.
- Trendlines. Trendlines must be drawn through at least two points. Still, the larger the number of points, the higher the possibility the setup works.
- Breakout. Can the ascending triangle pattern be bearish? No. It is a bullish formation that appears in a bullish and a bearish trend but always signals a potential price rise.
How Can You Trade Ascending Triangles?
The rising triangle pattern is usually considered a continuation setup formed in an uptrend. Still, if the ascending triangle is in a downtrend, it may signal a trend reversal. The trading rules will be the same in both cases.
As with most chart patterns, triangles have specific rules that help traders place entry and exit points.
Entry
The theory suggests trades go long when the price breaks above the setup's upper boundary. In a conservative approach, traders wait for the price to form at least several candles before entering the market. In a risky strategy, traders open a position as soon as the breakout occurs, and the breakout candlestick closes.
It's worth considering trading volumes as breakouts often turn into fakeouts, meaning the market returns to its previous trend. The chance of a strong breakout is higher if the volumes are high.
However, increased volumes aren't the only tool used to confirm a breakout. Many traders consider trend indicators and oscillators to potentially limit the risks of bad trading decisions.
- If the triangle serves as a continuation setup, it may be helpful to look at the signals of trend-strength indicators, including the average directional index.
- If traders use the ascending triangle as a reversal setup, they usually implement indicators that may signal a trend reversal, including the moving average, the relative strength index, the moving average convergence divergence, and the stochastic oscillator.
Take Profit
A standard take-profit target equals the size of the largest part of the setup and is measured just from the breakout trendline.
Stop Loss
Traders consider several options when placing stop-loss levels. In a conservative approach, they implement the risk/reward ratio, which is usually 1:2 or 1:3 but depends on the trader's willingness to take risks. Also, traders utilise the upper trendline as a threshold and place the stop-loss order just under it.
Note: These are general rules. However, traders can develop their own trading strategies and adjust the pattern's parameters and rules according to their trading approach.
Ascending Triangle: Strategy
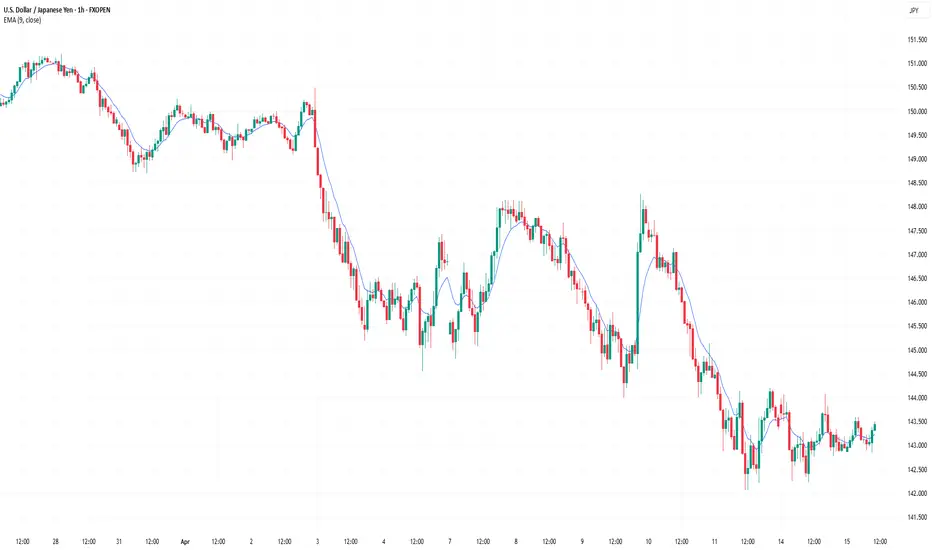
In this strategy, traders observe an existing bullish trend and the formation of an ascending triangle, which suggests the potential for a continuation pattern. Incorporating a short-term moving average, such as a 9-period EMA, provides dynamic support, aligning with the trendline to strengthen the setup.
Entries
- Traders typically wait for the price to break through the top trendline of the ascending triangle.
- A strong candle breaking the resistance level adds confidence, though any move above the top trendline can serve as an entry signal.
- The price should also trade above the moving average, offering additional confirmation.
- An order is often placed at the top trendline, anticipating a retracement to this level, which now acts as support.
Stop Loss
- Traders place a stop-loss below the most recent swing low within the triangle.
- For more conservative traders, the stop may be set at any prior swing low, depending on risk tolerance.
Take Profit
- Many traders aim for a risk-reward ratio of 1:2 or 1:3.
- Profits might also be taken at the next strong resistance level, aligning with the market structure.
Rising Triangle: Benefits and Drawbacks
This formation has advantages and pitfalls that traders consider when developing their strategies.
Benefits
- It can be used on any timeframe. Triangles are formed on charts of any period. Still, they might be more effective if the setup appears in a solid trend on a high timeframe.
- It can be used for any asset. Another advantage is that the ascending triangle pattern is used for stock, commodity, cryptocurrency*, and Forex trading.
- Easy to spot. A trader only needs to draw two trendlines to define this setup on the chart.
- Exact entry and exit points. Although traders can develop their entry and exit points, the setup assumes there are specific rules traders with any experience utilise.
Drawbacks
- It can confuse traders. As the rising triangle is used as a reversal and continuation formation, traders with less experience may be confused with its signals.
- False breakouts. The setup works when a price breakout occurs. However, there is a high risk the breakout will appear to be a fakeout, and the price will return.
- The pattern may fail. Aside from a fakeout, there is another risk when trading with triangles. The price may break another side of the formation, and the formation will fail.
- The trading rules may not work. Although specific rules indicate where a trader should place entry and exit points, buyers may be too weak to push the price to the take-profit target.
Final Thoughts
The ascending triangle is one of the more common chart patterns traders use when trading various assets. Still, there is no 100% guarantee that it will work every time you spot it on a price chart. It's vital to remember that every signal must be confirmed with other indicators, chart patterns, and candlesticks. Also, it's a well-known fact that any trade involves risks that should be considered every time a trader enters the market. Improve your skills by practising on different assets and timeframes.
FAQ
How Do You Form an Ascending Triangle?
An ascending triangle is formed when the price action creates a series of higher lows while facing a resistance level, resulting in a horizontal upper trendline and a rising lower trendline. The price consolidates between these two lines before potentially breaking out above the resistance, signalling a bullish continuation.
Is an Ascending Triangle Bullish or Bearish?
The ascending triangle is a bullish pattern. It suggests that buyers are gaining strength as higher lows form, increasing the likelihood of a breakout above the resistance level. There is a descending triangle pattern that usually appears in a downtrend, signalling a downward movement.
How to Enter an Ascending Triangle?
According to the theory, in triangle pattern trading, it’s common to enter the market when the price breaks above the upper trendline of the triangle. In a conservative approach, traders wait for confirmation through several closing candles after the breakout. The increased volume also adds confidence to the trade.
What Is the Ascending Triangle Pattern Retest?
A retest occurs when the price breaks out of the triangle but then briefly falls back to test the former resistance level. A successful retest confirms the breakout and can provide an additional entry point.
How Long Does an Ascending Triangle Pattern Take to Form?
The formation of a bullish triangle pattern can vary based on the timeframe. On daily charts, it can take several days to weeks, while on shorter timeframes, it might form within hours.
What Is the Difference Between an Ascending Triangle and a Rising Wedge?
In comparing the ascending triangle vs. the rising wedge, it’s key to recognise that the rising wedge has converging trendlines, signalling a possible weakening trend, often leading to a bearish reversal. In contrast, an ascending triangle trading pattern typically signals a continuation of the uptrend.
*At FXOpen UK, Cryptocurrency CFDs are only available for trading by those clients categorised as Professional clients under FCA Rules. They are not available for trading by Retail clients.
This article represents the opinion of the Companies operating under the FXOpen brand only. It is not to be construed as an offer, solicitation, or recommendation with respect to products and services provided by the Companies operating under the FXOpen brand, nor is it to be considered financial advice.
Ascending_triangle
Bullish- Watching Closely Keeping a close eye here on CRWD heading into earnings on 10/8'. CRWD has been testing the $195.11 mark for quite some time now and just closed out the week reclaiming its 20-Day SMA. Additionally, it would look like a smaller ascending triangle is forming within a broader falling wedge, accompanied by some slight bullish hidden divergence on the RSI, Bollinger bands squeezing (Not Pictured), and an increase in buyer volume relative to seller volume- all points to a breakout coming. I will be looking for a breakout from this wedge (Broader Markets Permitting) - Just some support and resistance levels along with some RSI-based supply and demand zones to keep an eye on in the meantime - Bullish and looking for a breakout from this wedge & triangle
--Previous Charts & Price Targets Attached Below--
PT1- $189.36
PT2- $187.64
PT3- $191.48
PT4- $195.37

Flagging on the Daily- BullishNKE looking interesting here sitting right on its 20-day EMA, falling wedge on the 4-hour and hourly timeframes along with what appears to be a big ascending triangle forming. Just some support and resistance levels to watch along with some RSI based supply and demand zones to keep an eye on in the meantime- Certainly a longer-term play, however, bullish and looking for a breakout from this flag
- Flagging on the Daily & 4-Hour Timeframes
- Sitting on its 20-day EMA
- Seemingly Going to Reclaim the 20-Day SMA (Not Pictured)
- Ascending Triangle Forming (Not Pictured)
- Falling Wedge on the Hourly Timeframe (See Attached Chart Below)
- Bollinger Bands Squeezing on the Hourly Timeframe (See Attached Chart Below)
PT1- $169.91
PT2- $170.98
PT3- $172.39
PT4- $173.18 +
-Hourly Timeframe-

Ascending Triangle Forming- UpdateJust posting a quick update on GS as it would appear to be a nice bullish ascending triangle forming on the GS daily timeframe. Solid close yesterday after reclaiming the 50-day SMA as well sitting right on the 50-day EMA. GS is also holding a bullish falling wedge on the 4-hour and shorter timeframes. Just some support and resistance levels to watch along with some RSI-based supply and demand zones to keep an eye on in the meantime- Bullish and looking for a breakout, previous charts are attached below.
- Ascending Triangle Forming on the Daily Timeframe
- MACD Cross on the 4-Hour Timeframe (See Attached Chart Below)
- Falling Wedge on the 4-Hour Timeframe (See Attached Chart Below)
- 8-Day EMA & RSI are About to Cross on the 4-Hour Timeframe (See Attached Chart Below)
- Slight Bullish Hidden Divergence on the RSI on Shorter Timeframes
- Reclaimed the 20-day & 50-day EMA's, SMA's starting to converge as well
- Buyer Volume Starting to Pick Back Up Relative to Seller Volume
PT1- $402.62
PT2- $403.93
PT3- $405.73
PT4- $408.35+
4-Hour Timeframe
-Previously Charted-

Falling Wedge- Bullish - UpdateNice falling wedge on SQ's hourly timeframe- Just posting a quick update as SQ is still looking very interesting here- will be watching closely for a breakout from this wedge here (broader market conditions permitting). Just some support and resistance levels to watch along with some RSI based supply and demand zones to keep an eye on- Bullish
- Bullish divergence on the RSI
- MACD Cross
- Ascending Triangle Forming on the Daily Timeframe (See Attached Chart Below)
- Sitting on its 200-day EMA on the Daily Timeframe as well
PT1- $239.71
PT2- $243.06
PT3- $244.66
PT4- $246.51
Daily Timeframe-
Previously Charted-

Ascending Triangle Forming- BullishTTD looking really nice here- Big ascending triangle forming along with a falling wedge on shorter timeframes (not pictured). Will be looking for a breakout from this triangle (Broader Markets Permitting) - Just some support and resistance levels to keep an eye on along with some RSI-based supply and demand zones - Bullish & looking for a breakout
- EMA's consolidating- sitting right on the 200day EMA
- Inverse Head and Shoulders formed on the weekly timeframe (See Chart Below)
- Bollinger Bands Squeezing on the weekly timeframe as well
- Bullish Gartley formed on the daily timeframe (Not pictured)
- Slight bullish divergence on the RSI
PT1- $74.33
PT2- $76.55
PT3- $78.33
PT4- $83.34
Weekly Timeframe-

Ascending Triangle Forming- BullishABNB really catching my eye here- Big ascending triangle forming on the 2-hour timeframe along with a big falling wedge on the hourly timeframe (See Attached Chart Below). Will be looking for a breakout from this triangle (Broader Markets Permitting) - Just some support and resistance levels to keep an eye on along with some RSI-based supply and demand zones - Bullish
- Bollinger Bands Squeezing (Not Pictured)
- Falling wedge on the hourly timeframe
- MACD cross
- Slight bullish hidden divergence on the RSI
- Sitting right on its 100-day EMA
PT1- $171.21
PT2- $172.46
PT3- $175.67 + Breakout
Hourly Timeframe-
Previously Charted-

Falling Wedge- Bullish - UpdateSQ frankly looking very Bullish here Going into Earnings. Bullish and looking for a breakout- Just some support and resistance levels to keep an eye on along with some RSI based supply and demand zones
See Previous charts & weekly chart below
Weekly Timeframe-
- Ascending triangle forming on the weekly (See Chart Below)
- Bollinger Bands squeezing
- Slight hidden bullish divergence
Daily TimeFrame
- EMA's starting to curl upwards
- Falling wedge
- Sitting right on its 50 day Moving Average (Not Pictured)
PT1- $261.28
PT2- $267.18
PT3- $271.76
PT4- $272.33
Previous Charts-

ETH- Double Top at Supply Level- UpdateMixed emotions on ETH here- Double top formed on the daily timeframe right at an RSI-Based supply level as well as a bearish ABCD Harmonic pattern formed on the 2 and 4-hour timeframes (2-hour Chart Below). RSI overbought on every timeframe besides the daily timeframe, which is nearing overbought territory as well. However, does seem to be forming a larger ascending triangle, likely will see a bit of a pullback and some consolidation before another push to new highs. Bearish short-term, very bullish long-term- Just some FIB levels and RSI-based supply and demand zones to keep an eye on **See Previous Charts Below**
2-Hour
Previous Charts

Bullish- Breakout Play (Long)Had my eye on PYPL for quite some time now, RSI is still hovering right above the oversold range on almost every timeframe after selling off after earnings. Will be looking for a breakout (broader market conditions permitting) Bullish - just some support and resistance levels to keep an eye on as well as some RSI based supply and demand zones to keep an eye on-
- Bullish ABCD Pattern Formed
- Falling Wedge (Bullish)- Within a Larger Ascending Triangle
- Sitting right on the 200-day EMA
- Slight bullish divergence on the RSI
PT1- $264.79
PT2- $269.18
PT3- $271.76
PT4- $274.08 + Breakout
(*Previously Charted*)

Ascending Triangle Forming- BullishBig Ascending triangle forming on MSFT here- EMA's are starting to curl upwards as well as buyers have maintained control for quite a while now. RSI is nearing the overbought level, just something to be aware of and keep an eye on, however, will be watching this one closely especially with earnings coming up on 10/27' - Just some support and resistance levels and some RSI-based supply and demand zones to keep an eye on- Bullish

Update | Inverse H&S- BullishVery bullish on SEDG here along with many others in the sector- while certainly a longer-term play, will be watching for a breakout. ICLN & TAN look ready for a breakout as well (attached below along with previous chart)- some bigger support and resistance levels to watch along with some RSI based supply and demand zones to keep an eye on- Bullish all the way and looking for a breakout here
- Inverse Head and Shoulders formed (Orange Neckline)
- Ascending triangle forming on its yearly chart
- Sitting right on its 100-day EMA with the rest starting to curl upwards
- Bollinger bands are starting to squeeze (not pictured)
- Slight hidden bullish divergence on the RSI accompanied with buyers volume starting to pick up relative to seller volume
PT1- $279.50
PT2- $287.52
PT3- $294.32 + Breakout
ICLN
TAN
Previous Charts

Ascending Triangle Forming- BullishLooks like an ascending triangle forming on GS after a long downtrend & some consolidation-
- Closed yesterday sitting on the 100day EMA and looks like it will reclaim the 50-day as well
- Buyer volume starting to pick up again, was in oversold territory for quite some time
- MACD is seemingly about to cross, EMA's curling upwards on shorter timeframes (Not Pictured)
- The previous times GS has been rangebound for a bit have seen a big breakout to new ATH's (See Previous Charts Below)- also consecutive pattern of making higher highs and lower lows
- Bullish & looking for a breakout, just some support and resistance levels to keep an eye on along with some RSI based supply and demand zones to keep an eye on
PT1- $392.16
PT2- $396.52
PT3- $398.95+ Breakout

Bullish- Long PlayAMZN has been consolidating in this channel for quite some time now and is forming what appears to be a very clear bullish ascending triangle off of a long-term uptrend line. As most already know, the DIA posting its worst week since October posting a 3.5% loss on the week with the SPY and NDAQ following posting losses of 1.9% and 0.2%, respectively. By no means is this a short-term play, however, certainly will be watching closely for a breakout at the end of this ascending triangle. The last time AMZN was consolidating in a parallel channel like this one we saw a breakout to new highs, AMZN has prime day coming up as well as earnings on 7/16' which could both serve as a catalyst for a nice run. Broader market conditions permitting-
PT1- $3,750
PT2- $4,000
PT3- $4,115

