Massive Base Formation on Charts – Potential Multibagger LoadingThere are two Chart of HIMATSINGKA SEIDE.
Himatsingka Seide is forming a symmetrical broadening wedge pattern on the weekly timeframe, with a strong support zone near ₹100.
On the daily timeframe, Himatsingka Seide is forming an ascending broadening wedge pattern, with a crucial support level near ₹135.
If this level is Sustain then we may see higher prices in Himatsingka Seide.
Thank You !!
Ascending Broadening Wedge

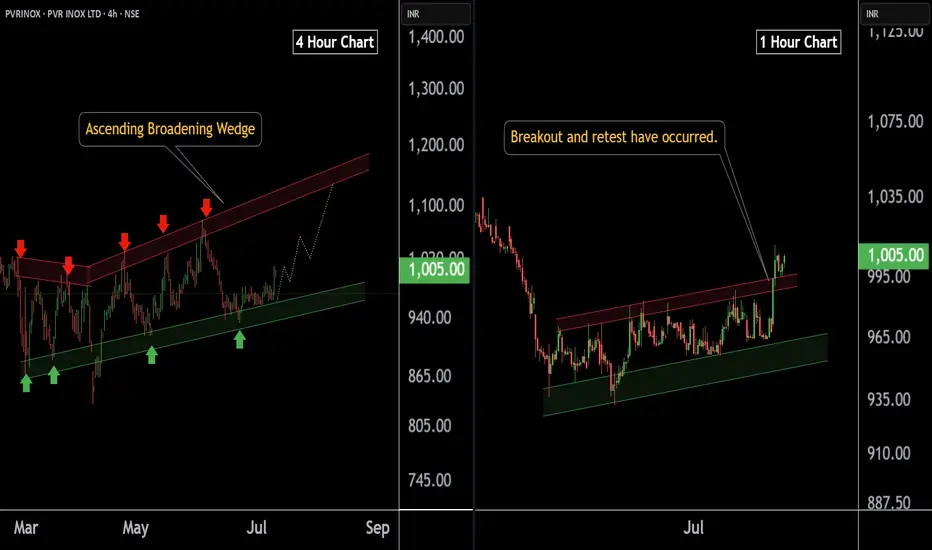
PVR INOX LTD at Best Support !! Breakout Alert !!Here are two charts of PVERINOX — one in the 4-hour timeframe and the other in the 1-hour timeframe.
4-Hour Timeframe Chart:
In the 4-hour timeframe, Power Inox is respecting its lower boundary, with a support range between 930–950.
ChatGPT said:
1-Hour Timeframe Chart:
In the 1-hour timeframe, the stock has given a breakout and has now completed a retest at 980-990 level.
If this level is sustain then , we may see higher in PVRINOX.
Thank you !!
FSN E COMMERCE VENTURES at Best Support Level | NYKAA !!This is the 4 hour Chart of Nykaa.
Nykaa having a good law of polairty near at 195-190 range.
Nykaa is forming ascending boradening wedge pattern with support at 190-195 range .
If this level is sustain , then we may see higher prices in Nykaa .
Thank You !!

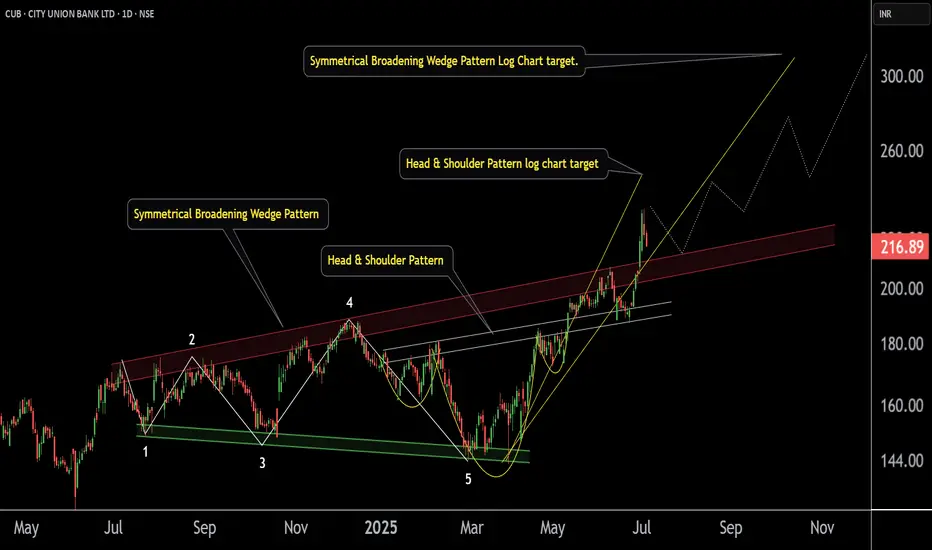
City Union Bank ' s Key level | Breakout |This is the Daily Chart of City Union Bank .
CUB has formed a Broadening Wedge pattern on the daily chart, with a breakout near the ₹200 support zone. Post breakout, the pattern suggests potential upside targets of ₹274 and ₹310
On the 4-hour chart, the stock has formed a Head and Shoulders pattern, with a breakout at ₹190, which has already been retested. The first target of the pattern has been achieved, while the next potential target is ₹250.
Thank You !!
SJVN 's Key level for Swing .This is the 4 hour chart of SJVN.
SJVN is forming a broadening pattern with support near at 90 range.
SJVN is forming a descending broadening pattern within a larger ascending broadening structure with support at near 91 range.
If this level is sustain then ,we may see higher prices in SJVN.

SAIL at Best Support !!This is the 4 hour Chart of STEEL AUTHORITY OF INDIA .
SAIL having a good law of polarity at 125 range .
SAIL has formed a broadening pattern indicating the uptrend.
if this level is sustain then we may see higher prices in SAIL.
Thank You !!

SEI Rebound or Final Trap?Yello Paradisers, have you considered that this little bounce might be the last trap before a brutal selloff? SEIUSDT is giving us strong signals that most retail traders are missing and if you’re not reading the structure clearly, you’re walking straight into a setup designed to clean you out.
💎The recent price action shows a clear rejection from the $0.22 level, which has now confirmed itself as a strong resistance zone. What’s more concerning is that this resistance rejection comes right after the price broke down from an Ascending Broadening Wedge. This is not a random pattern it’s a classic formation that tends to attract breakout buyers and then punishes them with aggressive downside moves once the structure fails.
💎Currently, the market is drifting just below that resistance, attempting weak bounces. However, there is a clear lack of bullish momentum. If this weakness persists, the next stop is around the $0.16 region, where moderate support is likely to be tested.
💎If sellers get aggressive, that level might not hold, and we could head lower into the $0.13 area still not where true value lies. The major support zone sits far below, around the psychological $0.10 level, and that’s where the real high-probability bounce setup is likely to occur.
MyCryptoParadise
iFeel the success🌴

NESCO at Resistance zone !!This is the Daily Chart of NESCO.
Nesco having good law of polarity at 1050 range.
NESCO is forming a pattern near its L.O.P, characterized by the development of an Ascending Broadening Wedge. The resistance zone for this formation is positioned between 1050 and 1060 levels
if this level is sustain, then we may see lower prices in NESCO.
THANK YOU !!

SHREE DIGVIJAY CEMENET AT LONG TERM SUPPORT ZONEThis is the Weekly chart of SHREDIGCEM.
SHREDIGCEM is trading near it's long term support zone at 60-70 range.
stock has been moving within a long-term parallel channel, with a well-established support zone in the range of ₹65–₹70.
Currently, the stock is forming a broadening pattern near its support zone, with the pattern support range between ₹70–₹75.
If this level is sustain then,we may see higher prices in SHREDIGCEM.

DONEAR AT SUPPORT ZONE.This is the Weekly chart of DONEAR.
Donear is currently trading near its support zone in the ₹95–₹100 range.
The stock is trading within a larger pattern structure (broadening pattern) and is currently moving inside a smaller formation—an ascending channel (in DAILY timeframe) support at 103-105 range.
if this level is sustain ,then we may see higher price on ascending channel resistance at 130-135 range and long term resistance of the broadening pattern .........
Thank you !!!!

Bitcoin's Structure Breaks — PRZ May Trigger a BounceBitcoin ( BINANCE:BTCUSDT ) has finally continued its downward trend , as I expected in my previous idea .
Do you think this downward trend will continue or not?
Bitcoin has now managed to break the Support zone($104,180-$103,670) and the lower line of the Ascending Broadening Wedge Pattern .
In terms of Elliott Wave theory , Bitcoin appears to be completing microwave C of the main wave Y of the Double Three Correction(WXY) .
I expect Bitcoin to continue to decline to the Support zone($102,000-$107,120) and the Potential Reversal Zone(PRZ) and then start to rise again.
I choose to label this idea as ''Long''.
Note: If Bitcoin falls below $100,200, we should expect further declines.
Please respect each other's ideas and express them politely if you agree or disagree.
Bitcoin Analyze (BTCUSDT), 1-hour time frame.
Be sure to follow the updated ideas.
Do not forget to put a Stop loss for your positions (For every position you want to open).
Please follow your strategy and updates; this is just my Idea, and I will gladly see your ideas in this post.
Please do not forget the ✅' like '✅ button 🙏😊 & Share it with your friends; thanks, and Trade safe.

BZ BO of ascending wedgeBZ Trade Update 📈
BZ has shown strong bullish behavior after bouncing off a key support level. It has now broken out of an ascending wedge formation, offering another solid entry opportunity.
I've entered a second position and adjusted risk management accordingly:
✅ SL of the first trade moved to breakeven (BE)
✅ New SL set 1% below the second entry candle
Now it's a matter of patience and discipline, letting the trade play out while following the plan.
Stay consistent and trust your process! 💪
Gold Testing PRZ & Resistance Zone-Short Opportunity? Gold ( OANDA:XAUUSD ) moved according to yesterday's analysis and the position that was Risk-To-Reward:1.61 and hit the target of this position. Do you think Gold will continue its correction, or should we wait for the next gold rally to start?
Gold is trading in the Resistance zone($3,280-$3,245) near the Potential Reversal Zone(PRZ) , and the Resistance lines .
From a Classical Technical Analysis perspective , it seems possible that an Ascending Broadening Wedge Pattern could form.
Educational note : An Ascending Broadening Wedge is a bearish technical pattern characterized by higher highs and higher lows that expand over time. It signals increasing volatility and weakening bullish momentum, often leading to a breakdown below support.
In terms of Elliott Wave theory , Gold appears to be in corrective waves in the 15-minute time frame .
I expect Gold to decline at least to the Support lines again , at least I think you can find a good Risk-To-Reward in PRZ for short positions .
Note: If Gold touches $3,292 [ Worst Stop Loss(SL) ], we can expect further gains.
Gold Analyze ( XAUUSD ), 15-minute time frame.
Be sure to follow the updated ideas.
Do not forget to put a Stop loss for your positions (For every position you want to open).
Please follow your strategy; this is just my idea, and I will gladly see your ideas in this post.
Please do not forget the ✅' like '✅ button 🙏😊 & Share it with your friends; thanks, and Trade safe.

Bitcoin Hits PRZ — Reversal or Breakout?As I expected in my previous idea , Bitcoin ( BINANCE:BTCUSDT ) started to rise from the Support zone($95,760-$95,200) . One of the news that pumped Bitcoin was " Arizona Becomes Second U.S. State to Adopt Bitcoin for State Treasury "
Bitcoin is trading in the Resistance zone($100,200-$97,700) and near the upper lines of the Ascending Broadening Wedge Pattern , Time Reversal Zone(TRZ) and Potential Reversal Zone(PRZ) .
Also, we can see a Regular Divergence(RD-) between Consecutive Peaks.
From an Elliott wave theory , it seems we should wait for corrective waves because the Cumulative Short Liquidation Leverage($100,888-$99,826) is very important and I DO NOT expect it to be broken by a single attack .
Another point we can pay attention to is the existence of two small CME Gaps , the first CME Gap($98,430-$98,380) is likely to be filled.
I expect Bitcoin to drop to at least $98,100 in the coming hours, and if the Support zone($97,900-$97,240 ) is broken, we should expect further declines, so I will label this idea as ''Short' '.
Cumulative Long Liquidation Leverage: $98,500-$97,514
Note: If Bitcoin can break the Potential Reversal Zone(PRZ) with the good volume, we can expect a new All-Time High(ATH).
Do you think Bitcoin is on track for a new All-Time High(ATH)?
Please respect each other's ideas and express them politely if you agree or disagree.
Bitcoin Analyze (BTCUSDT), 2-hour time frame.
Be sure to follow the updated ideas.
Do not forget to put a Stop loss for your positions (For every position you want to open).
Please follow your strategy and updates; this is just my Idea, and I will gladly see your ideas in this post.
Please do not forget the ✅' like '✅ button 🙏😊 & Share it with your friends; thanks, and Trade safe.

$ETH Ascending Broadening Wedge BreakoutCRYPTOCAP:ETH Ascending Broadening Wedge with completed Partial Rise and Breakout to the downside with Pullback at resistance

Bitcoin’s Bullish Patterns_Ready for a Breakout!?As I expected in the previous post , Bitcoin( BINANCE:BTCUSDT ) approached the Heavy Support zone($93,300-$90,500) and Support lines but quickly started to rise.
Bitcoin is moving in the Support zone($96,150-$94,700) . And in this increase of Bitcoin in the last few hours, we can see the Morning Star Candlestick Pattern well in the 2-hour time frame .
Educational tip : The Morning Star is a bullish reversal candlestick pattern that forms after a downtrend, consisting of three candles: a large bearish candle, a small indecisive candle, and a strong bullish candle. It signals a potential trend reversal and growing buying momentum.
In terms of Classic Technical Analysis , it seems that Bitcoin has succeeded in forming the Descending Broadening Wedge Pattern , which can be a sign of Bitcoin's increase .
According to the theory of Elliott waves , it seems that the entire corrective waves inside the descending channel were all in the form of a Zigzag Correction(ABC/5-3-5) so that it seems that Bitcoin finally completed the main wave C in the previous hours. If Bitcoin breaks the upper line of the wedge pattern, we can confirm the end of the main wave C .
I expect Bitcoin to be able to touch the Targets I specified on the chart AFTER breaking the upper line of the Descending Channel .
Note: If Bitcoin goes below $94,400, we expect more dumps.
Do you think Bitcoin can finally break out of this Descending Channel? Pump or Dump?
Please respect each other's ideas and express them politely if you agree or disagree.
Bitcoin Analyze (BTCUSDT), 2-hour time frame.
Be sure to follow the updated ideas.
Do not forget to put Stop loss for your positions (For every position you want to open).
Please follow your strategy and updates; this is just my Idea, and I will gladly see your ideas in this post.
Please do not forget the ✅' like '✅ button 🙏😊 & Share it with your friends; thanks, and Trade safe.

Gold's Uptrend Nearing Key Reversal Zone—Time to Sell?Gold ( OANDA:XAUUSD ) is creating a new All-Time High(ATH) during these few days; finally, how far can gold continue this upward trend? What do you think?
Educational Note : From the point of view of Technical Analysis , when the asset is forming an All-Time High(ATH) and the previous history of the price is not around the price, the analysis becomes a little difficult, but we must be able to make the best use of the technical analysis tool.
----------------------------------------------------
Gold is entering the Potential Reversal Zone(PRZ) . Also, Gold is facing a Series of Resistance lines that can stop its increase .
From the point of view of Classical Technical Analysis , it seems that Gold is in the Ascending Broadening Wedge Pattern formation. Do you agree!?
Educational Note : An Ascending Broadening Wedge is a bearish technical pattern characterized by higher highs and higher lows that expand over time. It signals increasing volatility and weakening bullish momentum, often leading to a breakdown below support. Traders watch for a confirmed breakdown as a short-selling opportunity.
According to the theory of Elliott waves , Gold seems to be completing microwave 5 of the main wave 5 .
Also, we can see the Regular Divergence(RD-) between Consecutive Peaks.
I expect Gold to start falling after entering the PRZ and at least to the lower line of the wedge pattern and Support zone($2,800-$2,787) .
Note: If Gold breaks the Resistance lines and goes above $2,873, we should expect Gold to increase further.
Be sure to follow the updated ideas.
Gold Analyze ( XAUUSD ), 1-hour time frame.
Do not forget to put Stop loss for your positions (For every position you want to open).
Please follow your strategy; this is just my idea, and I will gladly see your ideas in this post.
Please do not forget the ✅' like '✅ button 🙏😊 & Share it with your friends; thanks, and Trade safe.

XAUUSD GOLD ⇒ Sellers interested in retesting gold.Hello, Traders!
As we all know, this week gold made ATH with a red candle and also did a retest to 2799, but this retest is not enough for the continuation of the bullish trend. Here I have presented my analysis regarding gold.
Currently, gold is trading at 2799 at the gold support level, as the new week begins in three hours, so gold can do a gap down opening with a strong volume candle, and we can see 2774 in gold because gold is in a strong bullish trend, so it should touch 2774, which is the golden zone of fib to continue its bullish trend.
Support Level: 2758 – 2767
Resistance Level: 2815 – 2819
Fib Golden Zone: 2773 – 2763.
Liquidity Zone: 2730 (strong low)
Because gold is trading in an ascending channel, our aim would be the ascending trendline, but our entry point should be the golden zone of fib.
Do not enter at ATH because it is the initial technical analysis, thus our buy entry is quite dangerous, so we will wait for a retest.
For now, we can take sell trades for scalping, but always utilize SL because SL is better than liquidation, thus I'm in for sell until 2763.
If you enjoy my analysis Please support my concept and follow me for more analysis.
Have a wonderful day, thank you!

GOLD → Sellers taking interest for retesting in goldHello Traders!
As we all know that last week gold has made ATH with red candle and also did a retest to 2799 but this retest is not enough for continuation of bullish trend here i have shared my analysis about gold
Currently gold is trading on 2799 at gold support level as next week is going to start in 3 hours so gold can do a gap down opening with strong volume candle and we can see 2774 in gold because gold is in strong bullish trend so it should touch 2774 which is golden zone of fib to continue its bullish trend.
Support Level: 2758-2767
Resistance Level: 2815-2819
Fib Golden Zone: 2773-2763
Liquidity Zone: 2730 (also strong low)
As gold is trading in a ascending channel so our target would be the trendline of ascending trendline but our entry should be at golden zone of fib.
Do not take entry at ATH that is the first of technical analysis so here our entry for buy would be very risky so we will wait for retest.
For Now we can take sell trade for scalping but always use SL because SL is better than liquidation so i am in for sell till 2763
If you like my analysis kindly boost my idea and follow me for more analysis
Analysis By: PIPsOptimizer
Have a nice day thank you!

Gold Analysis==>>Still Chance to Fall by Wedge Pattern!!!Gold ( OANDA:XAUUSD ) is moving in the Support zone($2,671-$2,653) and managed to break the Support line .
According to the theory of Elliott waves , Gold seems to have completed the Double Three Correction(WXY) .
In terms of Classic Technical Analysis , the Ascending Broadening Wedge Pattern is still valid , although, after the announcement of US rates , this pattern was slightly challenged.
Also, we can see the Regular Divergence(RD-) between Consecutive Peaks.
I think Gold will fall to at least $2,651 in the coming hours.
This week, US indexes can affect the Gold trend , so be careful about your positions when the index is published.
The most important economic indexes of the US this week :
Core PPI m/m, PPI m/m = Tue Jan 14
Core CPI m/m, CPI m/m, CPI y/y = Wed Jan 15
Core Retail Sales m/m, Retail Sales m/m, Unemployment Claims = Thu Jan 16
⚠️Note: If Gold goes over $2,700, we can expect more pumps⚠️
⚠️Note: If Gold closes a 4-hour candle below 50_SMA(Daily), we can expect a break of the lower line of the wedge pattern.⚠️
🔔Be sure to follow the updated ideas.🔔
Gold Analyze ( XAUUSD ), 1-hour time frame ⏰.
Do not forget to put Stop loss for your positions (For every position you want to open).
Please follow your strategy; this is just my idea, and I will gladly see your ideas in this post.
Please do not forget the ✅' like '✅ button 🙏😊 & Share it with your friends; thanks, and Trade safe.

Gold Analysis==>>Ascending Broadening Wedge Pattern!!!Gold ( OANDA:XAUUSD ) attacked the Resistance zone($2,670-$2,653) as I expected yesterday .
Gold is moving in the Resistance zone($2,670-$2,653) and near the upper line of the Ascending Broadening Wedge Pattern .
Ascending Broadening Wedge Pattern : The Ascending Broadening Wedge pattern is a bearish reversal pattern that forms when price makes higher highs and higher lows within diverging trendlines, often signaling a potential breakdown.
According to the theory of Elliot waves , it seems that Gold has completed the main wave C , and we should wait for Gold to fall .
Also, we can see the Regular Divergence(RD-) between Consecutive Peaks.
I expect Gold to at least fall to the Support zone($2,639-$2,630) , and if this zone is broken, it will attack the lower line of the Ascending Broadening Wedge Pattern .
⚠️Note: If Gold breaks the Resistance zone($2,670-$2,653) , we can expect more Pumps⚠️.
🔔Be sure to follow the updated ideas.🔔
Gold Analyze ( XAUUSD ), 1-hour time frame ⏰.
Do not forget to put Stop loss for your positions (For every position you want to open).
Please follow your strategy; this is just my idea, and I will gladly see your ideas in this post.
Please do not forget the ✅' like '✅ button 🙏😊 & Share it with your friends; thanks, and Trade safe.

Gold is Ready to Pump Again==>>Short-term!!!Gold ( OANDA:XAUUSD ) is currently moving near the Resistance zone($2,670-$2,653) and the 50_SMA(Daily) .
Regarding Classic Technical analysis , Gold is moving in the Ascending Broadening Wedge Pattern .
According to the theory of Elliot waves , it seems that Gold has completed microwave 4 , and we should wait for microwave 5 .
I expect that Gold can have an upward trend in the coming hours and can attack the Resistance zone($2,670-$2,653) for the umpteenth time.
⚠️Note: If Gold breaks the Support zone($2,639-$2,630), we can expect more dumps⚠️.
🔔Be sure to follow the updated ideas.🔔
Gold Analyze ( XAUUSD ), 1-hour time frame ⏰.
Do not forget to put Stop loss for your positions (For every position you want to open).
Please follow your strategy; this is just my idea, and I will gladly see your ideas in this post.
Please do not forget the ✅' like '✅ button 🙏😊 & Share it with your friends; thanks, and Trade safe.

BTCUSDT - Bearish sign?daily chart displays a ascending broading wedge pattern
can notice obviously how price action going when touches the lower side of the pattern
You'll notice a full absorption of the candle, with only a wick touching the lower part of the pattern.
It's important to understand that the ascending wedge pattern is inherently bearish, often signaling a downward move. However, Bitcoin rarely gives you a clear short signal like this—it will likely liquidate all short positions first.
What’s expected is a strong upward move in the coming days, followed by a drop. Bitcoin’s target for this correction is 85k.
