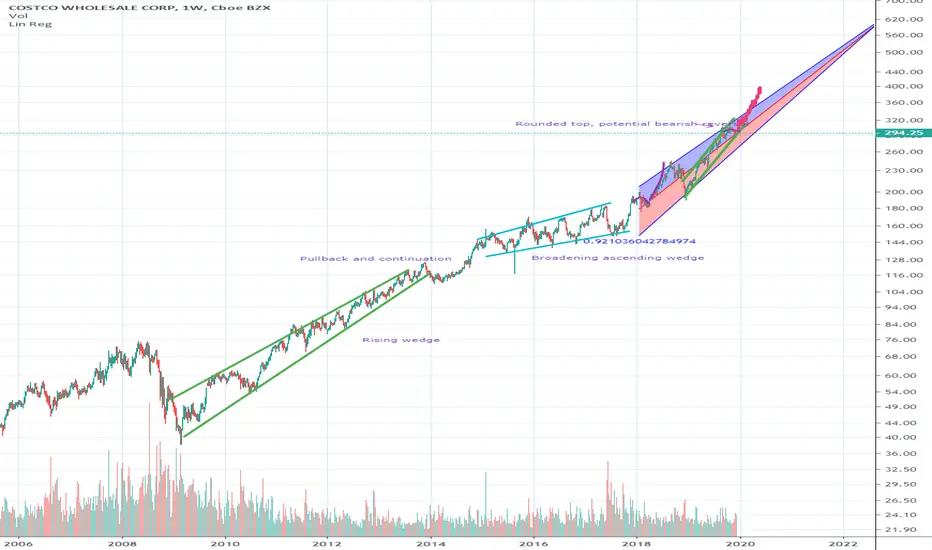
COST Regression analysisPresence of a rising wedge, broadening ascending wedge, Costco has been on a massive bull run. Rounded top also present which may be indicative of a bearish move, but with the strong rising channel and regression trend of 0.92 (strong regression trend according to Pearson's R value) the chart appears definitely more bullish rather than bearish.
Ascending Broadening Wedge
BTCUSD | Going down to $6 000 levelA confident and sharp growth of Bitcoin's value this summer brought most cryptocurrency holders to a bullish mood. However euphoria finished with a last parabolic wave on 26th of June. Further price action formed a standard for Bitcoin triangle which unfortunately was broken down on the 24th of September (Point I at the chart).
Further an ascending broadening wedge was formed which is a strong bearish sign. An ascending broadening wedge is a bearish chart pattern (a reversal pattern). It is formed by two diverging bullish lines. An ascending broadening wedge is confirmed/valid if it has good oscillation between the two upward lines. The upper line is the resistance line; the lower line is the support line.
Each of these lines must have been touched at least twice to validate the pattern.
These touches are displayed at the chart and we can see that price sharply broke down at point II but then met a strong support and bounced above Fib 0.5 level. However ascending broadening wedge resistance rejected further growth and at point IV price action confirmed bearish trend.
Currently the price is at point V and crawls down near with the major resistance which was formed by the original triangle upper edge created by the June's pump. In case of continuation the price will reach $6 000 level within 20 days.
The most important is that the mentioned point of $6 000 is also a place of crossing with the major support which rejected very bearish pattern last time thus with a high probability a new bull run will start there
Stay tuned to receive updates to this trading idea
Best regards,
SkyRock Signals


Small-Caps May Be Set For Pull BackThe iShares S&P Small-Cap ETF has been in a bearish wedge pattern on its daily chart since early October. The price is once again testing the resistance line. The price is near an overbought condition while generating a bearish divergence on the RSI indicator.
I am targeting the support line of this wedge pattern first. If the price is able to break down through that support line then I will look at the $80.30 price level noted on the chart.

HBAN - Weekly Chart BreakoutHuntington Bancshares broke out of an ascending triangle pattern last week & has continued to see its bullish momentum continue. The stock is showing relative strength across the board whether talking about the SPY or its sector/industry.
I would like to see it hold above the breakout level but I have my two initial price targets noted on the chart.

GBPUSD 60 Minutes chart Possible BEARISH Breakout.....- Ascending wedge formation ----> BEARISH Breakout
- Hidden Bearish divergence with OBV indicator ----> Bearish Trend continuation

GBPUSD 15 minutes possible BEARISH Break out...... - Ascending wedge formation ---> Bearish break out
- Hidden Bearish divergence with OBV indicator ---> Bearish trend continuation

Long term GOLDWelcome fellow Tradingviewers,
I am back with another long term view, after the last analyses followed my path to the point. We literally caught the trade from 1285 all the way up to 1557 giving us immense profits. If you are new to my channel you should check my previous analyses stating the areas said above. Please remember, that this is not financial advice, I am again only showing you guys my view on Gold .
If you guys like this analyses please don't forget to leave a Like and if you have any questions or thoughts let me know below!
Lets go for round 2 I guess!
Since the first analyses played out perfectly extending all the way to the end of the cup and handle we are now ready to start phase 2.
Monthly :
The last monthly candle managed to avoid becoming a Bearish engulfing candle which is slightly bullish, but still leaving more room for downside momentum.
Weekly :
We are slowly approaching the 50 MA weekly, the 100 MA is also slowly climbing to give us some higher dynamic support levels which is almost located at the 'heavy resistance' of around 1350.
The weekly ascending wedge broke out with the target around 1700-1750 if you have not seen it yet make sure to checkout my previous analyses!
Daily :
We are seeing that the 50 and 100 MA are starting to form a death cros s, which would indicate more downside momentum.
We are currently at the 1450 support, this one will probably not hold and we will see some more downward momentum.
The 200 MA is known as 'the last leg' of support and we are expecting this to be touched. We expect it to be touched because the death cross is showing us that there is room for some bearish momentum.
The 200 MA is located around 1400 and this will probably elevate a bit between the 1400 and 1420 zone, which currently is the highlighted buying zone.
Ideal buying zone would be between the 200 daily MA and the 50 weekly MA, we are expecting a lot of buy orders between 1420 and 1400. This is where we believe the second rally will start.
We are still waiting on clearer signs for entry points, we still need the 'trigger' to enter a position.
The trigger wil usually be a clear pattern or a candlestick conformation.
If you guys liked my analyses or have any comments please leave them below I will answer them asap.
Lets hope that this second analyses follows our path like the first!
Kind regards,
Forallcrypto

KO short/long-ascending wedge!Hello everyone, I noticed an ascending wedge on the daily coca cola stock. I suggest ti short until the green support line, and then long until it touches the dynamic resistance of the channel.

GBPCAD still a sell We are getting an Extension of the fifth wave on the 4 hr and price is making an ascending wedge reversal and it is divergent with MACD. This is telling me to look for short positions rather than long on smaller timeframes.

GBPUSD ascending wedge!Hello everyone, i saw ascending wedge on GBPUSD... There is a strong resistance level, so we can set there the TP, then shorting again.
Happy trading to all!

EURAUD Update: Bearish White Swan And Rising WedgeBearish White Swan achieved TP1
The wedge is broken.
Targets as described in the chart


How I see ADA's immediate future in 4H chartWe are at the the point where ADA is going down to support once again at 0.03850 price zone. Just for a short time :)
This pattern- ascending widening wedge is 80% of times bearish.
But I believe that we will bounce from the support zone right back up and then going to real bull season again. Right at the time when BAKKT is going live.
Like always, place a Stop Loss for your trades -> ALWAYS!
Just my 5 cents, not a trading advice!

The Beginning of the End for Apple?Two scenarios here:
1. Ascending wedge is in play and Apple re-tests 2018 lows. This would not be a good look.
2. Symmetrical triangle is in play and Apple breaks out after a bit of a rest.
Either way, this stock is going down short-term.
Furthermore, my analysis suggests that Apple stock price is the direct result of buyback efficacy. Net revenue is down, guidance is down, yet this stock continues to get bought for its dividend. I believe Q3 will show weakness, resulting in a break in their buyback strategy, revealing that this emperor truly wears no clothes.
Bias is leaning bearish.


LTC - Litecoin - Ascending Broadening WedgeLitecoin has been within an Ascending Broadening Wedge since its bottom in December of 2018, similar to my Etherium analysis, and is currently below the 60-Day Hull Moving Average on the Weekly...
The Daily candle opened lower and below the 8- and 20-Day HMA...
With the support of the 8- and 20-DHMA's on the 4Hour but below all HMA's on the 1Hour...
The measure rule for this patter based on the principles of Charles Bulkowsi are for a maximum target of the beginning of the formation of the pattern, with that here are the targets we are eyeing...
And if we measure the previous local downward move as a Motive Wave...
The Fibonacci levels match pretty closely with our targets...
The bearish technicals on BTC lead me to believe there is a strong chance of this pattern breaking down to these targets.

Bulls trying their best 2 prevent the approaching 4hr deathcrossThe bull flag definitely seems like it wants to trigger a bullish breakout here. Of course being still in the last 10 minutes of the 1 day candle anything can happen and we must remain patient and balanced until we get a better idea upon the daily candle close...we also need to keep a close eye on the top trendline of the broadening wedge's resistance(in red), and the 11113.83 horizontal trendline(in white)...I expected at least a wick above the white horizontal if we breakout but the horizontal may potentially maintain its resistance for candle close...if not the next resistance will be the 11271 horizontal (red) above that, and just above that 11585 descending green trendline which is currently the biggest resistance to overcome...it's the one thats maintained resistance this whole correction. . .still waiting to see where the current candle closes the daily at but looks good for a breakout currently..anything could change in the last 10 minutes though. Even if we do breakout though it may not be enough to prevent the 4hr deathcross from happening...however if we dont immediately nosedive after the cross then the cross will likely be a fakeout and shortlived. So very important here to see how price action reactts to any kind of deathcross...as long as price stays above both the 200(in blue) and the 50ma(in orange) i should result in a fakoeut. If not it will resume dumping.

ETHUSD - Critical technical state At the long-term timeframe of 1D chart we can see the price touches global support trend line. You may think it is a good sign because as usual the price touches the global support and bounces, however take a closer look at technical indicators.
Volume decreases while oscillator shows hidden bearish divergence and Bollinger bands narrowing. Seems strange for a bullish scenario ? Yes, it is strange and we check series of Fibonacci retracement levels we would see that the price has just broke down Fib 0.5 support level.
Finally we have ascending broadening wedge at the chart with a rejection of long scenario thus we come to conclusion. ETHUSD price action should be bearish for mid and long-term target price is $180.
Ethereum can still break the pattern and move higher in case Bitcoin will perform great ascending movement however BTCUSD is in decrease stage according to our latest analysis. Such situation will force ETH to go down finishing the pattern

ETH - Ascending Broadening Wedge*Using Poloniex for historical data. Shorting can be done on other exchanges, Bitmex in the case of this analysis.
ETH is within an Ascending Broadening Wedge for its overall history, currently having broken below the lower trend line with the Weekly 60-Day Hull Moving Average and the 175-Day HMA above it at $235. A cross of these two HMA's could occur within the next 2 weeks.
According to Charles Bulkowski (can be viewed on his PatternSite website or in his Encyclopedia of Chart Patterns) the measure rule for targets of Broadening Wedges is the beginning of the formation, for which in the case of Etherium would see it go back to $1. With that, here are levels of Support to consider for targets...
Measuring the move from 6/24/19 to 7/15/19, on the Weekly, as a Motive Wave gives local targets of $172/$129/$86 before reaching the December 2018 low of $74.
A Short with multiple targets and a tight stop would be the best play here, with orders laddered higher than the current price, in case of an attempt to break above the lower trend line...

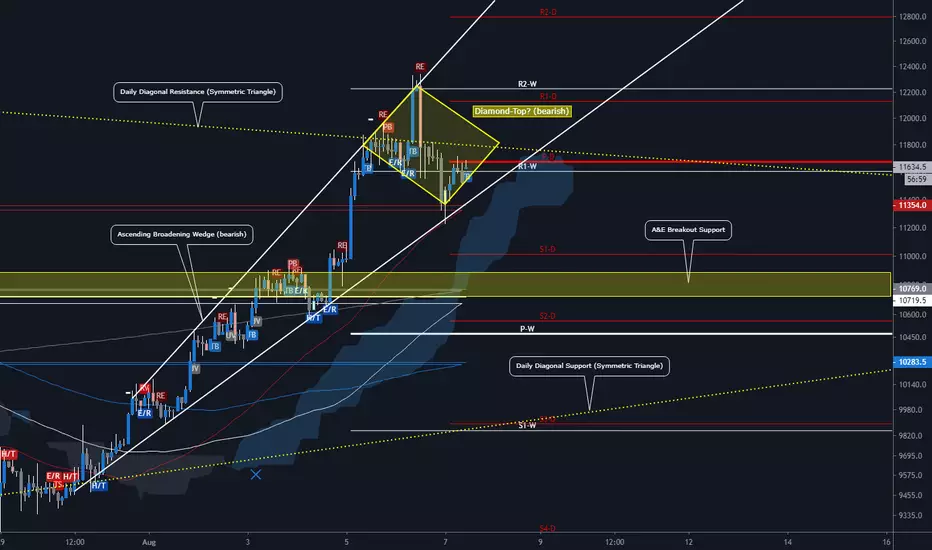
#bitcoin - Possible bearish diamond top "H2"During the day a new pattern, that is considered bearish has come into play and possibly marking a high, a diamond-top. Also taking into consideration, that we have developed a bearish ascending wedge, it becomes more likely that we have seen a local high now. Possible targets for this are not $8k .... those are $10.7 and $10k, where we would have to look at the possibility of making a symmetric triangle which can go both ways, instead of the former mentioned ascending triangle which is rather bullish nature.
This is only H2 interval, so nothing that is going to have an intense influence on the further longterm development. Keep an eye out.
_____________________________
Warm regards,
Neru
Bonus Bonus chart: SoftBank weaknessCouple of things to unpack with Softbank, 9984:
#1 Lower 78.6% high from previous peak
#2 Previous peak was reversal off a massive long-term wedge resistance marking major tops from 2006
#3 Broke down from 30M SSR and key MA support
#4 Softbank is super levered and materially dependent on unicorn valuations for its acquisitions to keep 9984 share price up. Softbank is now ranked up there with dumb money as it habitually overpays for acquisitions. 9984 paid $45 for Uber pre-IPO and no prizes for guessing the mark-to-market on that "investment".
#5 Upward sloping wedges almost always breaks lower. Son almost lost everything during the tech bust, he has not changed his MO so why would this time be different?

BTCUSD Ascending Broadening Wedge/Falling Wedge 8.1k-8.6k BottomBTCUSD Ascending Broadening Wedge/Falling Wedge 8.1k-8.6k Bottom
- Two Alternate Ascending Broadening Wedge Formations Drawn with decline leading into bullish Falling Wedge formation.
- Breakouts downward of ABW at ~10400 or ~9800.
- Per Bulkowski, average decline of Ascending Broadening Wedge is 17%
- Targets ~8640 and ~8140, respectively.
